Hemodynamics of Enhanced External Counterpulsation with Different Coronary Stenosis
Sihan Chen, Bao Li, Haisheng Yang, Jianhang Du, Xiaoling Li and Youjun Liu,
Abstract: Enhanced external counterpulsation (EECP) is able to treat myocardial ischemia, which is usually caused by coronary artery stenosis. However, the underlying mechanisms regarding why this technique is effective in treating myocardial ischemia remains unclear and there is no patient-specific counterpulsation mode for different rates of coronary artery stenosis in clinic. This study sought to investigate the hemodynamic effect of varied coronary artery stenosis rates when using EECP and the necessity of adopting targeted counterpulsation mode to consider different rates of coronary artery stenosis. Three 3-dimensional (3D) coronary models with different stenosis rates,including 55% (Model 1), 65% (Model 2), and 75% (Model 3), were generated, then coupled with a 0-dimensional (0D) lumped parametric model of the blood circulatory system. EECP was applied to the 0D/3D coupled models to study the hemodynamic response of the coronary artery. Under the same counterpulsation mode, the ratio of diastolic blood pressure to systolic blood pressure of 3 models during counterpulsation was 1.4, and the cardiac output and coronary artery flow rate increased significantly. The low wall shear stress (WSS) and high oscillatory shear index (OSI) areas were mainly located at the posterior end of the stenosis and coronary artery bifurcation. Moreover,with an increase in the rate of coronary artery stenosis, the increased percentage of flow rate through the coronary artery stenosis and area-averaged WSS decreased. The geometric multiscale model in this study can be used to effectively simulate the hemodynamic characteristics of cardiovascular system following the application of EECP.Local precise hemodynamic effect of the coronary artery stenosis can be observed. It was found from the hemodynamic factors that the coronary artery with lower stenosis rate more likely led to better vascular endothelial remodeling. Thus, it is necessary to adopt patient-specific counterpulsation mode accounting for different condition of coronary artery stenosis.
Keywords: Enhanced external counterpulsation, coronary artery stenosis, geometric multiscale method, wall shear stress, hemodynamics.
1 Introduction
Enhanced external counterpulsation (EECP) is able to treat myocardial ischemia, which is usually caused by coronary artery stenosis. EECP equipment includes cuffs around the calves, thighs and buttocks. The cuffs are rapidly filled with air during the diastole of heart, compressing the legs and pushing the blood sequentially from the lower limbs towards the aorta, which improves the diastolic blood pressure significantly to promote coronary collateral circulation [Sharma, Ramsey, Tak et al. (2013)]. Before cardiac contraction, the cuff is rapidly deflated to expand the compressed artery so that it can easily accept the blood from the heart. Afterwards, the aortic systolic pressure and ventricular ejection resistance are reduced and the cardiac afterload is alleviated[Michaels, Accad, Ports et al. (2002); Michaels, Accad, Ports et al. (2005)].
Previous studies indicated that the hemodynamic environment of internal vessel was of great significance for vascular remodeling [Davies (2009); Casey, Beck, Nichols et al.(2011); Han, Starikov, Hartaigh et al. (2016)]. Zhang et al. [Zhang, He, Chen et al. (2007)]have found from animal experiments that the increase of wall shear stress (WSS) to improve endothelial function is an important mechanism contributing to the favorable clinical effect of EECP. Yang et al. [Yang and Wu (2013)] investigated the potential mechanisms contributing to the immediate and long-term benefits of EECP from the perspective of shear stress-increasing effect. However, the WSS of the vascular endothelium is clinically unmeasurable and little is currently known about the accurate hemodynamic effect of EECP on local blood vessels.
EECP equipment can assist cardiac work and improve myocardial perfusion in patients with ischemic coronary heart diseases [Bonetti, Barsness, Keelan et al. (2003); Braith,Casey and Beck (2003)]. While coronary artery stenosis is one of the main factor that affect myocardial ischemia [Libby, Pierre and Theroux (2005)], there was no appropriate mode of counterpulsation for patient-specific coronary artery with different rates of stenosis. Development of targeted treatment strategies for coronary artery with different rates of stenosis is imperative. This study aimed to establish a geometric multiscale model to calculate hemodynamic parameters of concerned blood vessels during EECP and determine local precise hemodynamic phenomenon. In this study, three 0D/3D coupled models were established to simulate the human blood circulatory system and to study the hemodynamic effect of coronary artery with different rates of stenosis under the same EECP mode.
2 Materials and methods
2.1 The 3D coronary model
The 3D models in this study was established based on a 62 years old patient with coronary heart disease. The CT scans of patient were provided by The Eighth Affiliated Hospital, Sun Yat-sen University. The physiological parameters of this patient were shown in Tab. 1.

Table 1: Physiological parameters of patient
The 3D models were reconstructed following threshold segmentation and regional growth on CT images [Zhao, Liu and Wang (2015)]. Based on the original 3D model, other models were built with the software FreeForm Modeling Puls 2013.0 by modifying the stenosis section at the left anterior descending branch. EECP is mainly used to treat coronary heart disease with moderate degree of stenosis in clinical, so this study change the stenosis section at the same location with rates of 55% (Model 1), 65% (Model 2) and 75% (Model 3) by the diameter, respectively (Fig. 1).
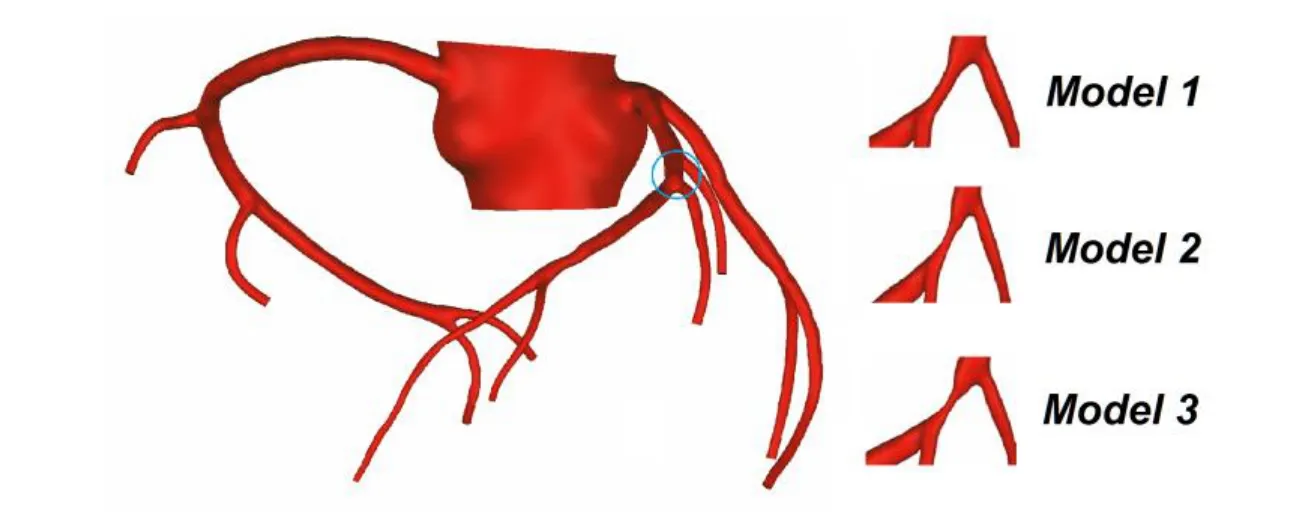
Figure 1: 3D modified models with different stenosis rates
The 3D models were meshed to generate the computational models. A hexahedral mesh was generated mainly by using the size control method with the assistance of the commercial software ANSYS-CFX. The node and element numbers for the models are listed in Tab. 2.

Table 2: The node and element numbers of the 3D model
2.2 The 0D/3D coupled model
2.2.1 The lumped parametric model of blood circulatory system
The lumped parametric model of blood circulatory system was able to simulate the hemodynamic behavior of the human blood circulation at the system level. The vascular resistance, blood pressure and blood flow were compared to the resistance, voltage and current, respectively. The heart was compared to the time-varying capacitance, the vascular elasticity and blood inertia were compared to the capacitance and inductance. The structure of lumped parametric model referred to the study of Jaron and physiological anatomy of blood vessels [Jaron, Moore and Bai (1988); Bai, Ying and Jaron (1992)].
The lumped parametric model of blood circulatory is consisted of a cardiopulmonary circulation module, 18 arterial and venous modules and 9 peripheral circulation modules.Fig. 2 showed the structure of each module in the lumped parametric model, and the values of each module were shown in Tab. 3 and Tab. 4. The parameters of lumped parametric model in this study referred to the physiological parameters of patient and previous literature [Frolov, Sindeev, Lischouk et al. (2016)].
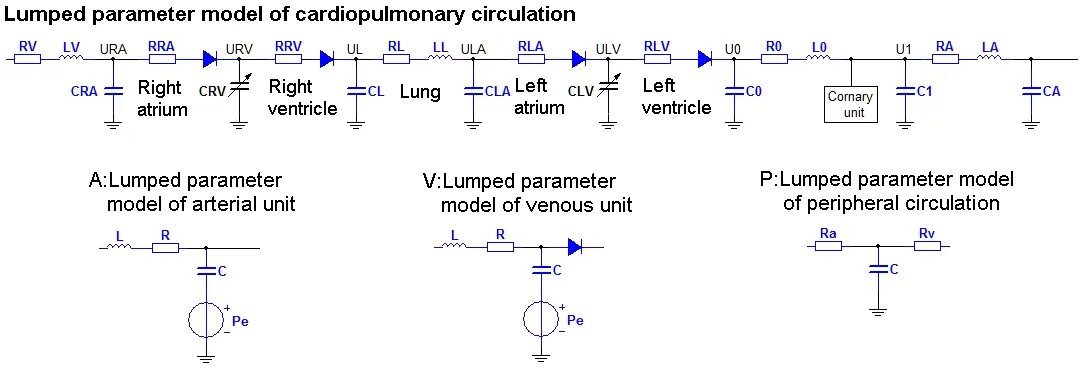
Figure 2: The structure of each module in the lumped parametric model
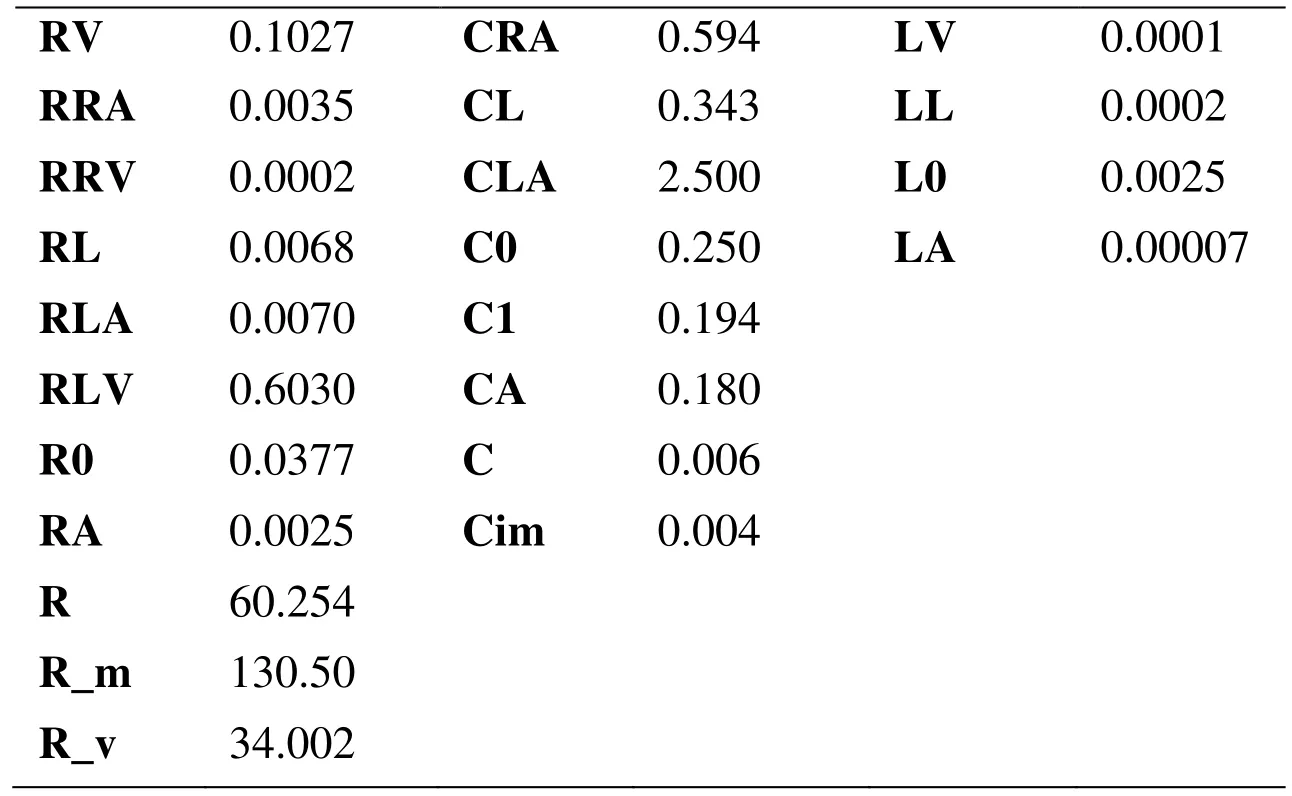
Table 3: Parameters of the cardiopulmonary bypass
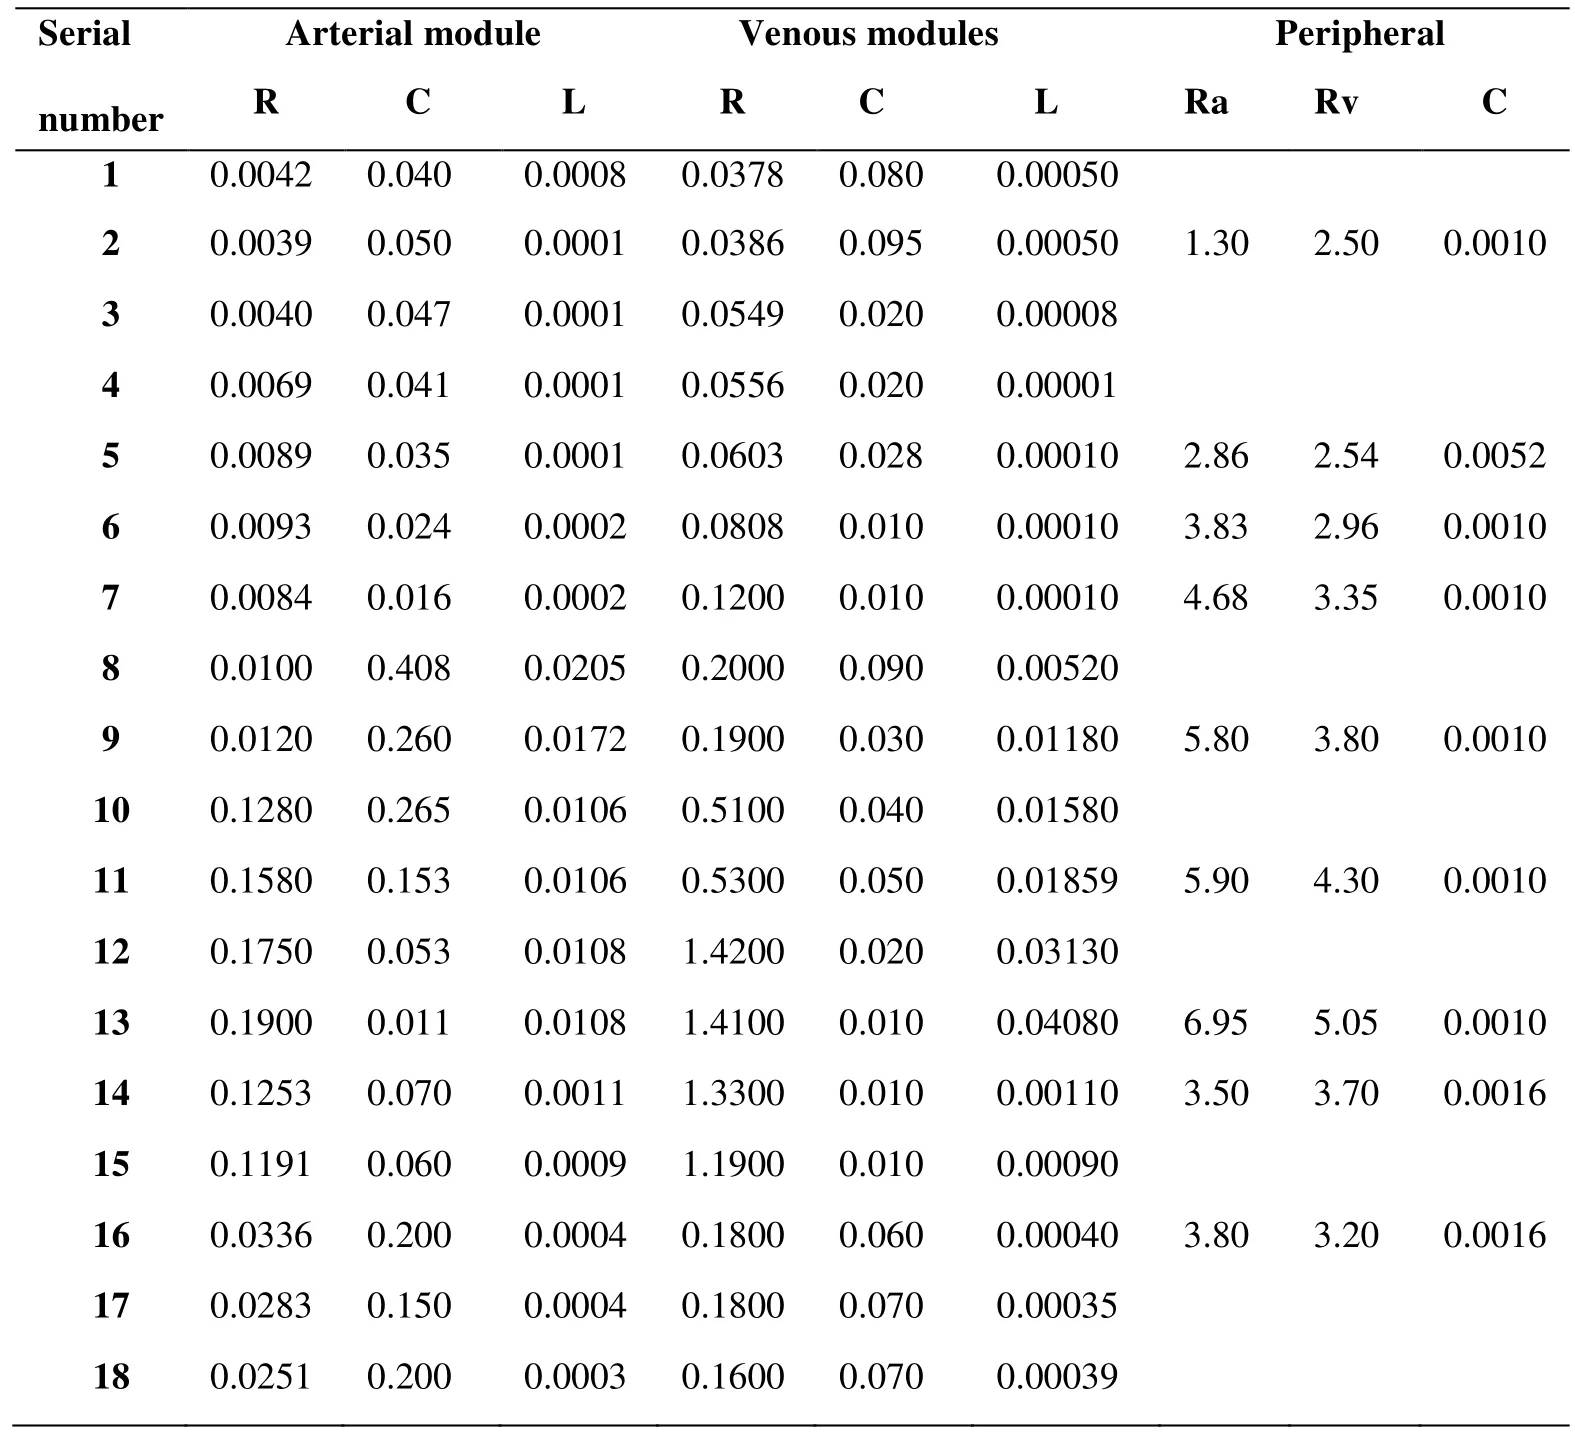
Table 4: Parameters of the blood circulatory system
The explicit Euler method was used for simulation, and the time step of lumped parametric model is 0.000001 s. The variable capacitance CLV(t) and CRV(t) was the energy source for the entire circuitry system, to simulate the contraction of left and right ventricular. Suga et al. [Suga and Sugava (1974)] established the elastic time-varying function E(t) (mmHg/ml) to describe ventricular features by animal experiments, which can be expressed as:

V0 is ventricular reference volume (ml), Vsv(t) is time function of ventricular volume (ml),and Psv(t) is time function of ventricular pressure (mmHg). In actual calculation, the shape of the elastic curve is best approximated by Eq. (2) [Stergiopulos, Meister and Westerhof (1996)].

Emax (mmHg/ml) is ventricular pressure-volume relation during end-systole and Emin(mmHg/ml) is ventricular pressure-volume relation during end-diastolic. En(tn) is double hill function, tn is t/Tmax, while the Tmax (s) can be calculated by the cardiac cycle tc (s):

In this study, the Emax of left ventricle was 6.0, Emin of left ventricle was 0.007; the Emax of right ventricle was 0.00042, Emin of right ventricle was 0.00003. The value of Emax and Emin is different, because the left ventricular and right ventricular systolic intensity is different. By applying E(t) to CLV(t) and CRV(t) in Fig. 2, respectively,pressure waveforms simulated left and right ventricular contraction would produce on CLV(t) and CRV(t). Combining with patient-specific physiological parameters, the solution results indicate the physiological reliability of model and its feasibility to execute hemodynamic simulation for the blood circulatory system.
2.2.2 Coupling method
The geometric multiscale model was established by coupling the 3D coronary model with the lumped parametric model of the patient’s blood circulatory system. According to coupling algorithm and boundary conditions [Zhao, Liu, Li et al. (2015)], the lumped parametric model and 3D models were able to exchange data. The boundary conditions of 3D models were the pressure at the outlet and flow rate at the inlet, which were calculated by the lumped parametric model. Also the pressure at the inlet(B) and flow rate at the outlet(A) calculated by 3D model were imposed to the lumped parametric model. The simulation of 3D model and calculation of 0D model were implemented based on User CEL Function and Junction Box in ANSYS-CFX. Based on the linear interpolation method, the timeline in 0D calculation was consistent with 3D simulation.For each coronary branch(a-j) of 3D model, as shown in Fig. 3, coupled with a lumped parametric model with a ventricle pressure source [Tayler, Fonte and Min (2013); Kim,Vignon, Coogan et al. (2010)].

Figure 3: The structure of 0D/3D coupled model
2.3 The application of EECP
EECP was applied to the vein and arterial of lumped parametric model lower body modules in the form of pressure waveform. The pressure amplitude, pressure duration,pressurized moment, pressurized and decompressed rate are four parameters of the application of EECP [Bai, Wu and Zhang (2002)].

Figure 4: The control chart of EECP mode
The inflation and deflation rates of EECP were very fast in clinic, and pressurized moment is based on the beginning of diastolic period. Fig. 4 shows the control chart of counterpulsation, the pressurization time and decompression time were 5 ms. For patient with a cardiac cycle of 0.8 s, the pressurized moment of calves is 0.25 s [Bottom (1999)].The detailed values of pressure amplitude and pressure duration are shown in Tab. 5.

Table 5: The parameters of EECP mode
3 Results
3.1 Aortic pressure and cardiac output
The therapeutic target for traditional treatment of EECP is that the diastolic blood pressure is 1.2 times greater than systolic blood pressure following counterpulsation. The improvement of diastolic blood pressure will promote the establishment of collateral circulation, allowing blood through it into the myocardial tissue and relieving the ischemic state of myocardial cells. In this counterpulsation mode, the ratio between the diastolic blood pressure and systolic blood pressure during counterpulsation is 1.4, and the waveform of aortic pressure is in line with the physiological parameters, as shown in Fig. 5. These results promised the effectiveness of our simulation.
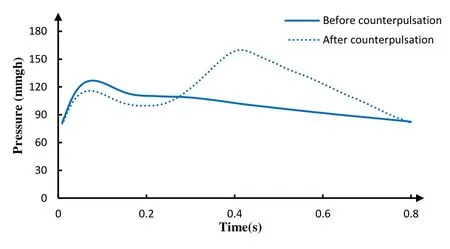
Figure 5: The aortic pressure of 3 models
The increase in the cardiac output enhances heart, brain, kidney and other organs blood perfusion thus it is an important index to evaluate the effect of counterpulsation. But the waveform of cardiac output with EECP is different from normal state because of the reverse flow by the counterpulsation wave, as shown in Fig. 5. When the counterpulsation wave arrived to the aortic root, the reverse flow was generated and the numerical value of cardiac output was negative. After the counterpulsation pressure was released, the reverse flow turned to be positive again. The negative numerical value of cardiac output was just an expression of flow direction.

Figure 6: The cardiac output of 3 models
3.2 Coronary flow
The coronary flow rate is one of the most important parameters for evaluating the myocardial ischemia. The flow through the coronary artery stenosis is depicted in Fig. 7,the solid line waveform represents the coronary flow rate before counterpulsation and the dashed line represents the coronary flow rate during counterpulsation. After the application of counterpulsation, the coronary flow rate during diastole is much higher.

Figure 7: The stenosis flow rate of 3 models
The time-averaged coronary flow rate and the percentage of flow increase are also listed in Tab. 6. It can be found that the flow through the stenosis in Model 1 is much higher than Model 2, and that Model 2 is much higher than that of Model 3.

Table 6: Time-averaged coronary flow rate
3.3 Wall shear stress
Wall shear stress (WSS) is one of the most important parameters and is proposed to relate blood flow to atherosclerosis. In arteries, the magnitude of WSS is in the range of 17 Pa.Arterial level WSS (>1.5 Pa) induces endothelial quiescence and an atheroprotective gene expression profile, whereas low WSS (<0.4 Pa), which is prevalent at atherosclerosisprone sites, stimulates an atherogenic phenotype. The stenosis would produce bad hemodynamic effect on the distal coronary artery, which was considered in this study.The WSS contours during counterpulsation at 0.35 s were shown in Fig. 8. The time is the moment of maximum coronary flow rate.

Figure 8: The WSS counter of 3 models at 0.35 s
The waveforms of area-averaged WSS on the distal vessels of coronary artery stenosis were depicted in Fig. 9. The time-averaged WSS of coronary artery for Model 1, Model 2 and Model 3 are 3.335 Pa, 3.006 Pa and 2.662 Pa, respectively. It can be seen from Fig. 9 that the WSS in Model 1 is higher than Model 2, and Model 2 is higher than Model 3.
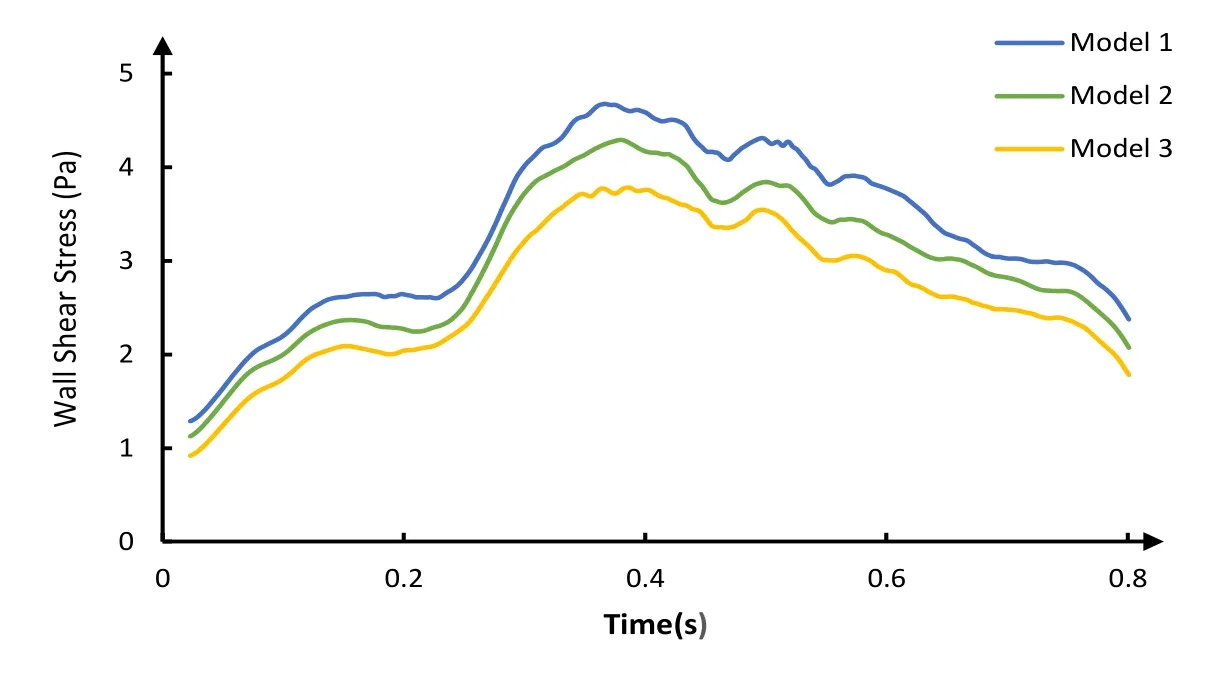
Figure 9: The area-averaged WSS on the distal vessels of the coronary stenosis
3.4 Oscillatory shear index
Oscillatory shear index (OSI) was based on the expression in Eq. (4), and τω is WSS.


Figure 10: The OSI counter of 3 models
The OSI distributions on the distal vessels of the coronary artery stenosis are illustrated in Fig. 10. It can be seen that the OSI in Model 1 and Model 2 is higher than Model 3. Also high OSI area only appear in bifurcation of coronary. The area-averaged OSI of distal vessels was 0.0107, 0.0106 and 0.0081 for Model 1, Model 2 and Model 3, respectively.
4 Discussion
4.1 Hemodynamic characters of coronary with stenosis during EECP
Previous studies indicated that EECP improved myocardial ischemia by promoting coronary collateral circulation and modifying vascular endothelium gene expression[Hashemi, Hoseinbalam and Khazaei (2008); Davies (2009)]. The EECP device compresses lower body sequentially, forcing the blood back to the aorta. Thereby the aortic pressure and coronary artery flow rate increase in the diastole of heart [Prasad,Ramasamy, Thomas et al. (2010)]. These behaviors are also shown in the results of this study, the aortic pressure and cardiac output increased significantly during diastole (Fig.5 and Fig. 6). Therefore, the geometric multiscale model was able to simulate coronary artery hemodynamic completely following EECP.
Furthermore, some local precise hemodynamic phenomenon of coronary artery stenosis during EECP was observed in the geometric multiscale model. Some studies have demonstrated that low WSS is prevalent at atherosclerosis prone sites, and a high OSI would increase the probability of vascular intimal hyperplasia [Malek, Alper and Izumo(1999); Mori, Hayasaka and Yamaguchi (2002); Chiu, Wang, Chien et al. (2008)]. Our results (Fig. 8 and Fig. 10) indicate that the low WSS and high OSI region on coronary are mostly located at the back end of the stenosis and bifurcation. Although the myocardial ischemia can be effectively relieved by EECP, there are some hemodynamic responses that could be improved by changing counterpulation mode in future study.
4.2 Difference among different coronary stenosis during EECP
Our results show that no significant difference exists among 3 models in aortic pressure and cardiac output during counterpulsation. However, the increase of the stenosis rate leads to a decrease of the percentage of blood flow through the coronary artery during counterpulsation. The coronary artery flow rate is an important indicator that improve myocardial ischemia and hypoxia [Uren, Merlin, De et al. (1994)]. Moreover, it can be seen from Fig. 9 that area-averaged WSS of distal vessels of coronary artery stenosis is decreased with the increase of the rate of coronary artery stenosis. Studies have indicated that the function of endothelial cells was improved effectively and the occurrence and development of atherosclerosis was delayed by increasing the WSS of vascular endothelium [Wentzel, Gijsen, Stergiopulos et al. (2003); Carlier, Damme, Blommerde et al. (2003)]. Based on the observed hemodynamic features above, it can be found that difference exists among different coronary stenosis during EECP. Under this counterpulsation mode, the therapeutic effect became worse with the increased rate of coronary artery stenosis.
5 Conclusions
The 0D/3D coupled models in this study can effectively simulate the hemodynamic characteristics of coronary artery after the application of EECP. This model could calculate WSS and observe local precise hemodynamic phenomenon of coronary artery stenosis. Furthermore, there are some hemodynamic response that would be concerned during EECP.
Under the same counterpulsation mode, different rates of coronary artery stenosis have different hemodynamic effects-the lower the stenosis rate is, the better the effect of counterpulsation would be. Clinic considerations of the influence of different stenosis rates on the coronary should therefore be taken into account.
6 Future work
For a specific coronary artery stenosis condition, a specific counterpulsation mode should be applied to achieve the best counterpulsation effect. The appropriate counterpulsation mode of EECP for different rates of coronary artery stenosis will be studied in our future work.
Acknowledgemen:This research was supported by National Natural Science Foundation of China (11772016, 11472022, 11702008), Key Project of Science and Technology of Beijing Municipal Education Commission and Support Plan for High-level Faculties in Beijing Municipal Universities (CIT&TCD201804011).
 Computer Modeling In Engineering&Sciences2018年8期
- Computer Modeling In Engineering&Sciences的其它文章
- Angle of Attack Between Blood Flow and Mitral Valve Leaflets in Hypertrophic Obstructive Cardiomyopathy: An In Vivo Multipatient CT-based FSI Study
- The Analysis of Wall Shear Stress Modulated by Acute Exercise in the Human Common Carotid Artery with an Elastic Tube Model
- A Fast-Fractional Flow Reserve Simulation Method in A Patient with Coronary Stenosis Based on Resistance Boundary Conditions
- Influence of Clip Locations on Intraaneurysmal Flow Dynamics in Patient-specific Anterior Communicating Aneurysm Models with Different Aneurysmal Angle
- Computational Fluid Dynamics Analysis of Shroud Design on Hemodynamic Performance and Blood Damage in a Centrifugal Blood Pump
- Numerical Analyses of Idealized Total Cavopulmonary Connection Physiologies with Single and Bilateral Superior Vena Cava Assisted by an Axial Blood Pump
