Angle of Attack Between Blood Flow and Mitral Valve Leaflets in Hypertrophic Obstructive Cardiomyopathy: An In Vivo Multipatient CT-based FSI Study
Long Deng, Xueying Huang , Heng Zuo, Yuan Zheng, Chun Yang, Yunhu Song and Dalin Tang
Abstract: The mechanisms of systolic anterior motion (SAM) of the mitral valve in hypertrophic obstructive cardiomyopathy (HOCM) remain unclear. To investigate the angle of attack between blood flow and mitral valve leaflets at pre-SAM time point,patient-specific CT-based computational models were constructed for 5 patients receiving septal myectomy surgery to obtain pre- and post-operative 2D vector flow mapping. The comparisons between pre- and post-operative angles of attack based on 2D vector flow mapping of 5 patients were performed. It was found that there was no statistically significant difference between pre- and post-operative angles of attack (61.1±t wao vs.56.2±56.o, p=0.306, n=5). Therefore, we propose that the angle of attack might not play an important role in the initiation of SAM.
Keywords: Hypertrophic obstructive cardiomyopathy, systolic anterior motion, mitral valve leaflets, computational model, angle of attack.
1 Introduction
Hypertrophic obstructive cardiomyopathy (HOCM) is a genetic disease characterized by hypertrophic interventricular septum and left ventricular outflow tract obstruction(LVOTO). Severe LVOTO would cause symptoms including chest pain, dyspnea, and syncope. Heart failure and sudden cardiac death are frequently seen in these patients. The left ventricular outflow tract (LVOT) is bounded by the interventricular septum and the anterior mitral valve leaflet, and its obstruction is predominantly attributed to the systolic anterior motion (SAM) of the mitral valve, namely the anterior motion of the mitral valve towards the septum in the systole. Numerous studies have been intended to illustrate the relevant factors and possible mechanisms of SAM [Hwang, Choi, Kwan et al.(2011); Jiang, Levine, King et al. (1987); Kim, Handschumacher, Levine et al.(2010); Lefebvre, He, Levine et al. (1995); Levine, Vlahakes, Lefebvre et al.(1995); Nakatani, Schwammenthal, Lever et al. (1996); Sherrid, Chu, Delia et al.(1993)]. However, the hydrodynamic mechanisms of SAM remain unclear. At present,the most popular explanation is that the septal bulge redirects the blood flow towards a posterior to anterior direction, thus increasing the angle of attack between the flow and the mitral valve leaflets (MVL), and then the increased flow drag force would move the valve anteriorly towards the septum. As this theory suggests, successful septal myectomy(also known as Morrow procedure) could chip off the septal bulge and decrease the angle of attack significantly to eliminate SAM.
With the improvement of computational modeling, image-based computational modeling becomes more and more widely used to simulate and visualize the hemodynamic status in the heart and to investigate the mechanisms of the heart motion. There are recent reviews of the modeling development, especially image-based computational ventricular modeling,which could be found in Hunter et al. [Hunter, Pullan and Smaill (2003); McCulloch,Waldman, Rogers et al. (1992); Yang, Tang, Geva et al. (2013)]. In our previous article,patient-specific CT-based 3D fluid-structure interaction (FSI) computational model for left ventricle in hypertrophic obstructive cardiomyopathy has been developed to simulate the left ventricle contraction in the early systole phase [Deng, Huang, Yang et al. (2018a);Deng, Huang, Yang et al. (2018b)]. In this study, the pre- and post-operative CT images of 5 patients receiving satisfactory septal myectomy surgery were selected to construct the pre- and post-operative FSI computational models. The angle of attack was measured based on the obtained simulation results to investigate whether it was related to the initiation of SAM.
2 Methods
2.1 Patients’ selection and characteristics
Between October 2016 and April 2017, 5 patients with HOCM receiving septal myectomy at Fuwai Hospital were recruited in this study. Before surgery, all patients had severe SAM and left ventricular outflow tract (LVOTG)>50 mmHg. The operation techniques had been described previously [Liu, Song, Gao et al. (2016)], and no concomitant mitral valve (MV) procedures (repair or replacement) were performed in these patients. After surgery, SAM and mitral regurgitation were successfully eliminated,and the left ventricular outflow tract gradient (LVOTG) decreased significantly as well.Patients characteristics before and after surgery are shown in Tab. 1. The Institutional Review Board of Fuwai Hospital approved the protocol, and written informed consent was obtained from all patients involved.

Table 1: Patients’ characteristics before and after surgery
2.2 Data acquisition
ECG-gated cardiac CT scans were performed at every 5% RR interval in the cardiac cycle. The beginning time of SAM ranged from 5% to 8% RR interval in the cardiac cycle in all 5 patients. Therefore, to investigate the mechanisms of the initiation of SAM,we selected the CT images of patients’ left ventricle (LV) at 5% RR interval (pre-SAM times point) to construct the geometry model. For each patient, there were about 110-150 slices (slice thickness is 0.625 mm) of images covering the LV. To facilitate the modeling construction process, one from every 4 slices was used to construct the 3D FSI model.The segmentation was performed manually to obtain the contours of each component. Fig.1 presents the selected CT images, and segmented contour plots of the LV, the MV, and the aorta for the modeling construction. Heart rate and blood pressure at the time of the CT examinations were used in the numerical simulation.

Figure 1: Segmented contours corresponding to CT images. a) Selected CT images from a patient with HOCM; b) Segmented contours corresponding to CT images shown in a); c)
Re-constructed 3D Geometry of LV from segmented CT Images; d) 3D-velocity vector flow map (numerical results). LV=left ventricle; MV=Mitral Valve
2.3 FSI computational modeling
The material property of the left ventricle was assumed to be hyperelastic, isotropic,incompressible and homogeneous. The governing equation for the structure is as follows,

where ρ is the density of the ventricular muscle, t stands for time, i and j label spatial coordinates, v is the displacement vector, σ is the stress tensor, f.,jstands for derivative with respect to the jtℎvariable. The strain-displacement relations is given by,where ε =[εij] is the Green-Lagrange strain tensor. The modified non-linear Mooney-Rivlin strain energy density was used to describe the material properties,


Blood flow in the left ventricle was assumed to be laminar, Newtonian, viscous and incompressible. The Navier-Stokes equation with Arbitrary Lagrangian Eulerian formula was used as the governing equation. The density of the blood was assumed to be ρ=1 g ·cm−3and the viscosity was assumed to be 0.04 dyn ·cm−2. No-slip boundary conditions and natural force boundary conditions were specified at all interfaces to couple fluid and structure models [Bathe (2002); Tang, Yang, Geva et al. (2008); Yang, Tang,Haber et al. (2007)]. Putting these together, we have,

where u and p are fluid velocity and pressure, ugis mesh velocity, Γ stands for the left ventricle inner wall, σ is structure stress tensor, (superscripts, f and s, indicate blood and the left ventricle, respectively), and n is the outward normal directions. Together with Eqs. (1)-(3), we completed the FSI model.
2.4 Active contraction
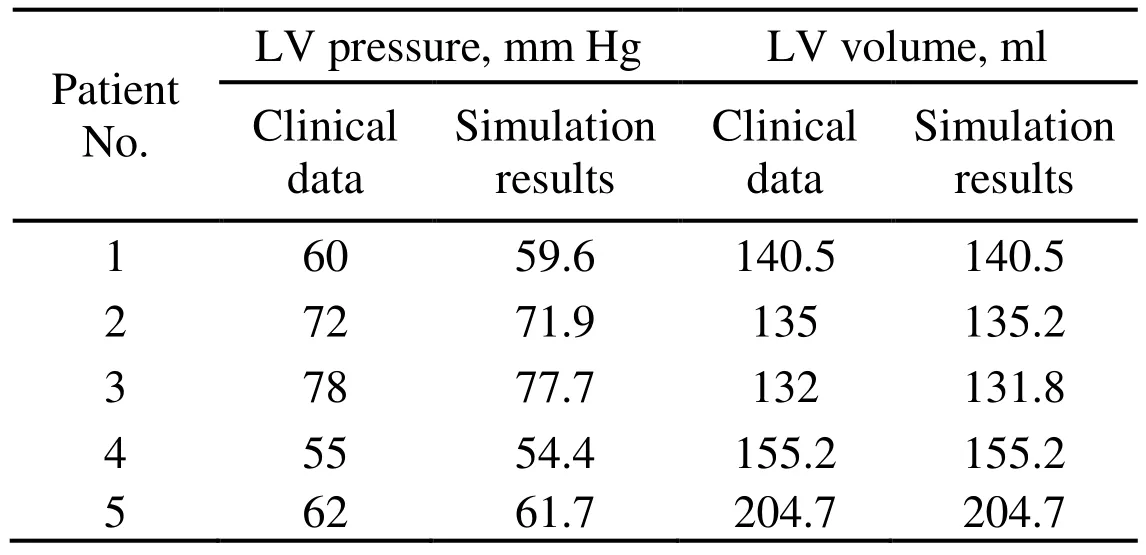
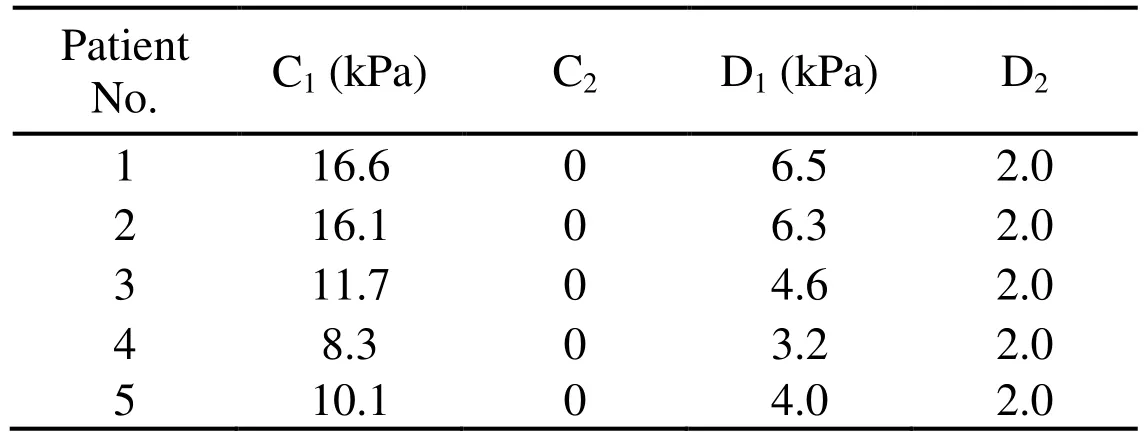
A pre-shrink process was then applied in our model to obtain the geometry (initial geometry) of LV at a zero-load state [Tang, Yang, Geva et al. (2011)]. The shrinkage rates in short-axis direction (each slice) and in long-axis direction were 6% and 1%, respectively.As the inlet pressure increased, the LV expanded in short-axis and long axis direction then the volume increased. The patient-specific material constants ciand Diwere adjusted to match the obtained numerical LV volume to CT-measured LV volume data at the end of isovolumic systole phase for each patient. The procedure started with initial estimated material parameters [Tang, Yang, Geva et al. (2008)]. If the obtained numerical volume was greater than the CT measured volume, then the material should be stiffer, which means that the material parameters should be greater; otherwise, the material should be adjusted to be softer and the material parameters should be smaller. When the numerical LV volume at the end of isovolumic systole matched with the real LV volume measured with CT data, the optimal material parameters were found (Tab. 2).

Table 2: Comparisons of LV pressure and volume at the end of isovolumic systole between numerical simulation results and clinical measured data for each patient
The patient-specific material constants were listed in Tab. 3.

Table 3: The patient-specific material constants for non-linear Mooney Rivlin model
The purpose of this pre-shrink-stretch process is to obtain both the information of the blood flow and LV at the end of isovolumic systole phase which will be used as initialstate for the real active contraction simulation.
We simulated the LV active contraction by specifying the pressure conditions at the outlet and epicardium of LV from the end of the isovolumic systole to the pre-SAM time point [Deng, Huang, Yang et al. (2018a)]. The pressure conditions were adjusted until the differences of velocity at LV outflow tract, pressure, and average contraction rate of LV at the pre-SAM time point between the simulation results and the clinical measured data were less than 5%.
2.5 Mesh generation and solution method
Volume component-fitting method was employed to generate meshes for both the fluid and myocardium in patient-specific left ventricle [Tang, Yang, Geva et al. (2008); Yang,Tang, Haber et al. (2007); Tang, Yang, Geva et al. (2011)]. By applying this method, the mesh generated would not be too distorted under large deformation. There were around 90,000 4-node elements for solid model and 60,000 4-node elements for fluid model. The optimal element size for each dimension is between 0.05-0.1 cm. The fully coupled FSI model was solved by ADINA using unstructured finite elements and the Newton-Raphson iteration method.
2.6 Angle of attack onto the leaflet
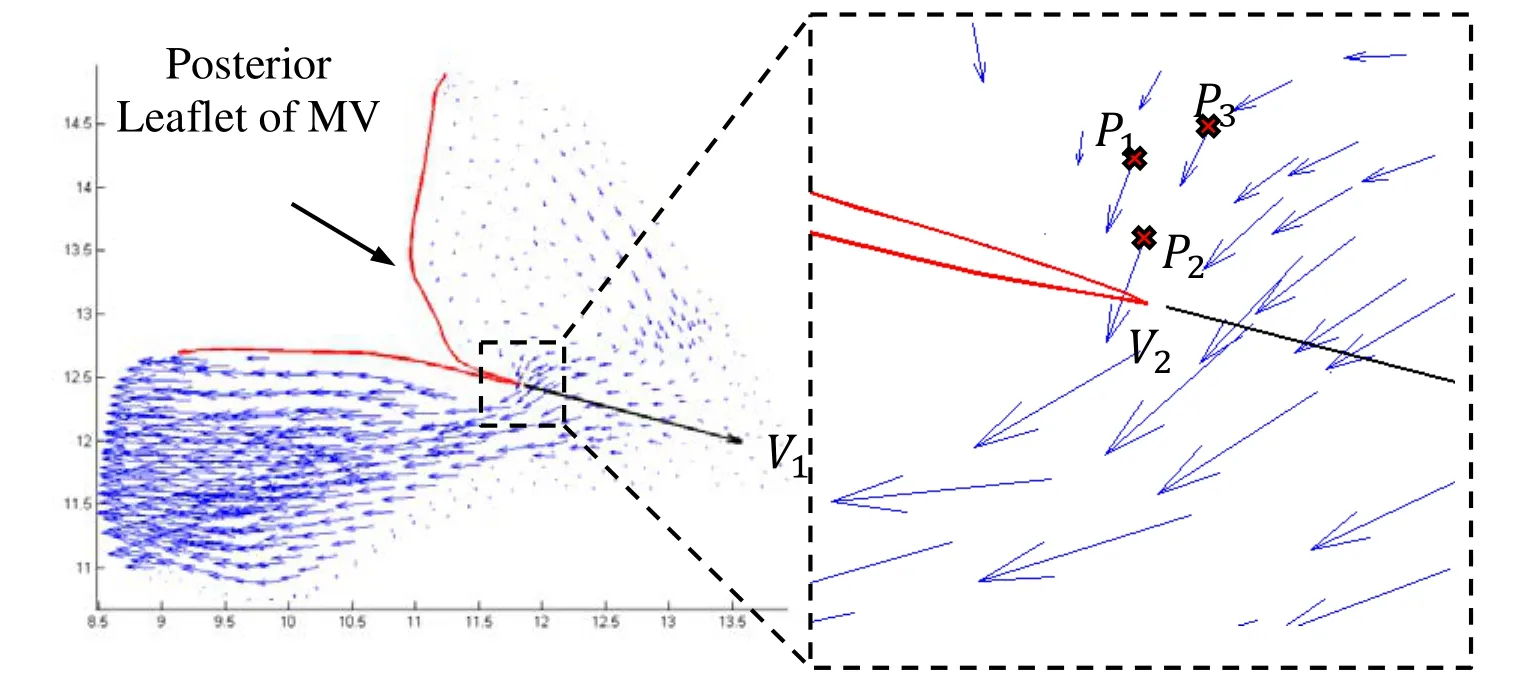
As suggested previously, it is believed that in patients with HOCM, the septal bulge redirects the blood flow and increases its angle of attack onto MVL. The angle of attack was measured based on the numerical simulation results at pre-SAM time point of computational model. At each 2D slice, a vector (V1) was drawn through the point of coaptation closest to the annulus and bisects the angle of posterior and anterior leaflets.Vector V2was the velocity vector at selected flow point which was just upstream from the tip of the posterior mitral valve leaflet [Nakatani, Schwammenthal, Lever et al. (1996);Ro, Halpern, Sahn et al. (2014)]. The following formula was used to calculate the angle between V1and V2,

Three flow points on the posterior mitral valve leaflet slide, which have minimal distances to the point of coaptation closest to the annulus, were selected to determine V2.The mean value of the angles between V1and V2, was then used to indicate the angle of attack at this slice. The technique was similar to a previous study [Ro, Halpern, Sahn et al.(2014)]. Fig. 2 presents the vector flow map showing selected points.

Figure 2: Vector flow map showing three flow points (P1, P2, P3) selected to determine the angle of attack onto the mitral valve (MV) leaflets
2.7 Statistical analysis
The data were expressed as mean±SD. Paired t test was used to compare the mean value of angles of attack of each patient between pre- and post-operative groups. Due to the small size of data, the angle of attack in each slice was also used in the analysis. The linear Mixed-Effect-Model [Tang, Yang, Del Nido et al. (2016)] was used to take care of data dependence structure and make comparisons between different outcome groups. A p value <0.05 was established as the level of statistical significance.
3 Results
For each individual patient, the mean value of pre- and post-operative angles of attack at each slices were calculated and compared between the two groups (Fig. 3). There was no statistically significant difference found (61.1±).Tovs. 56.2±56.o, p=0.306, n=5). The mean value of post-operative angles of attack was only 8.7% less than the pre-operative value.
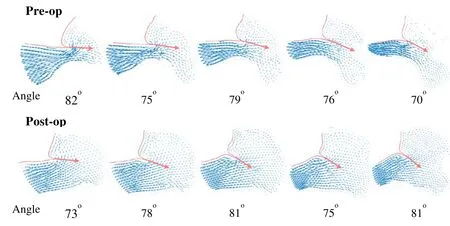
The pre- and post-operative angles of attack at the pre-SAM time point of 54 slices in total were also analyzed. It was found that the maximum and minimum values of preoperative angle of attack were 87.0oand 10.5o, respectively. After surgery, the maximum and minimum were 86.6oand 8.5o, respectively. In the total of 54 slices, the postoperative mean value of angles of attack was 10.7% less than that in the pre-operative group (62.4spectovs. 55.7specto, p=0.05, n=54). Fig. 4 showed representative pre- and post-operative vector flow maps in selected slices of Patient No. 1.

Figure 4: Comparison of representative pre- and post-operative vector flow maps in selected slices
4 Discussions
It was reported by Ro et al. [Ro, Halpern, Sahn et al. (2014)] that high angles of attack onto MVL (>60°) was found in HOCM patients before and after SAM began, while it was not observed in nonobstructive hypertrophic cardiomyopathy and control patients.The authors concluded that the early systolic flow impacts posterior surface of the protruding mitral valve leaflet and thus increasing the angle of attoack. In the present study,high angles of attack were also found pre-operatively (62.4 pres), which was consistent with Ro et al.’s study [Ro, Halpern, Sahn et al. (2014)]. However, when SAM was abolished following successful septal myectomy surgery, the angle did not decrease significantly. Our results indicated that the high angle of attack might not be the dominant mechanical factor that initiated caused SAM, which disagreed with the previous theory. Also, the “angle of attack” theory could not explain why SAM is not observed in patients with mid-LV obstruction alone, who also have the prominent bulge in the septum. In that study [Ro, Halpern, Sahn et al. (2014)], the reason why the angle of attack could not be measured in nonobstructive hypertrophic cardiomyopathy and control patients might be that, the blood flow volume posterior to the MVL was too small to be detected in the echocardiography, which was not a problem for the present study.
Based on our previous study, we believed that in the early systole, the distance from the MVL to the septum was a more decisive factor in the initiation of SAM, which determined the ratio of blood flow volume anterior to and posterior to the MVL [Deng,Huang, Yang et al. (2018a)]. When the distance is too small, the blood volume posterior to the MVL would be large enough to create high pressure on the posterior surface of MVL, which drives the anterior motion of mitral valve, namely SAM. Successful septal myectomy enlarges this distance sufficiently and decreases the blood volume posterior to the MVL, and thus eliminating SAM.
One limitation of this study is the small sample size which results in limited statistical power. The reason for the small sample size was that the construction and solving of the computational modeling in this study was very time consuming due to the dramatic deformation of the ventricle and significant pressure change in a very short period. Thus,improving the model construction techniques, such as automatic modeling procedure making the process less labor-intensive and more clinically applicable, will be a major effort for our future work. Other limitations include: a) The simulation was performed only for the early stage of systole; b) Fiber orientation and anisotropic models should be considered to improve the accuracy of our models; c) Inclusion of valve opening in the current model will be an important addition.
5 Conclusion
To clarify the hydrodynamic mechanisms of SAM in HOCM, the angle of attack between blood flow and mitral valve leaflets was investigated by using patient-specific CT-based FSI computational models. Our results indicated that when SAM was abolished following successful septal myectomy surgery, the angle of attack did not decrease significantly compared to that when SAM was observed before surgery, and the post-operative angle of attack remained still high. Based on our results, we propose that the angle of attack might not play an important role in the initiation of SAM.
Acknowledgement:The authors would like to acknowledge the research support from Natural Science Foundation of Fujian Province of China (Grant No. 2017J01009),Fundamental Research Funds for the Central Universities (Grant No. 20720180004),National Heart, Lung and Blood Institute grants R01 HL089269, and National Sciences Foundation of China (Grant No. 11672001, 81571691).
 Computer Modeling In Engineering&Sciences2018年8期
- Computer Modeling In Engineering&Sciences的其它文章
- The Analysis of Wall Shear Stress Modulated by Acute Exercise in the Human Common Carotid Artery with an Elastic Tube Model
- Hemodynamics of Enhanced External Counterpulsation with Different Coronary Stenosis
- A Fast-Fractional Flow Reserve Simulation Method in A Patient with Coronary Stenosis Based on Resistance Boundary Conditions
- Influence of Clip Locations on Intraaneurysmal Flow Dynamics in Patient-specific Anterior Communicating Aneurysm Models with Different Aneurysmal Angle
- Computational Fluid Dynamics Analysis of Shroud Design on Hemodynamic Performance and Blood Damage in a Centrifugal Blood Pump
- Numerical Analyses of Idealized Total Cavopulmonary Connection Physiologies with Single and Bilateral Superior Vena Cava Assisted by an Axial Blood Pump
