Mechanical Behavior and Failure Criterion of High Performance Concrete Under Biaxial Tension-Compression Loading Condition
Jinlong Pan, Dan Wu and Changyu Qi
(Key Laboratory of Concrete and Pre-stressed Concrete Structures of Ministry of Education, Southeast University, Nanjing 210096, China)
Abstract: The mechanical behavior and failure criterion of high performance concrete (HPC) subjected to biaxial tension-compression loading conditions were investigated experimentally with a real triaxial testing system. The failure modes, ultimate strength and stress-strain curves of HPC under biaxial tension-compression loading conditions were obtained. Then, mechanical behavior of HPC under different stress ratios were analyzed. Finally, based on the Kupfer’s strength criterion for conventional concrete and test results, a novel failure criterion was proposed for HPC under biaxial tension-compression loading conditions.
Key words: high performance concrete (HPC); biaxial tension-compression; failure mode; failure criterion
Concrete is a composite material made up of filler and binder materials, and widely used in engineering structures. The service life of infrastructures in our country is far below the world average level, and often cannot meet the design requirement. Some roads and bridges broke when they were just in service for 3-5 years. Some structures even need repairing before being used[1]. The above-referred problems are normally not caused by the lack of concrete strength, but caused by the material performance degradation and durability challenges. To deal with this problem, high performance concrete is introduced to improve the durability.
Nowadays high performance concrete (HPC) is distinguished by use of superplasticizers and mineral admixtures. HPC has decreased requirement on cement, and the rheology behavior of mixture becomes more significant. The durability of structures is greatly enhanced by using HPC[2]. In recent years, HPC has been widely used in high-rise buildings. In reinforced concrete structures, the concrete members, such as beam-column joints and so on, are normally in complicated stress state. Up to now, the mechanical behavior of traditional concrete under different stress states including complicated stress states has been comprehensively studied, including the influence of testing technology[3], the failure criterion and strength models of concrete under different stress states[4], stress-strain relationship[5]and constitutive equations[6-10]of concrete, experimental study on compressive stress-strain curve and mechanical behavior under uniaxial stress of HPC[11-12], and so on. The mechanical behavior and failure criterion of HPC under multi-axial stress have been studied[13-14], but the number of stress ratio is relatively small, and the failure criterion has some limitations.
In this paper, an experimental investigation was conducted to characterize the mechanical behavior and failure criterion of HPC subjected to biaxial tension-compression loading conditions by using a real tri-axial testing system in the National Key Laboratory of Costal and Offshore Engineering in Dalian University of Technology (DUT). The failure mode and ultimate strength of HPC under biaxial tension-compression loading conditions were obtained. Then, mechanical behavior of HPC under different stress ratios were analyzed. Finally, based on the test results, a novel failure criterion was proposed for HPC under biaxial tension-compression loading condition.
1 Experiment
1.1 Design of specimens
The constituent materials used in the experiment for HPC consisted of cement, sand, coarse aggregate, superplasticizer, silica fume, water and water reducing agent. The mixture proportions were illustrated in Tab.1. The proportion of cement to silica fume was 9∶1. The efficient water reducing agent was calculated based on solid content, and solid content accounted for 35% of the weight of the solution.

Tab.1 Mix proportion of test specimens
Type I cement (ordinary Portland cement) with alkali content (Na2O+0.658K2O) not more than 0.60%, and its fineness of 350 m2/kg was used for casting HPC.
River sand, with fineness modulus of 2.5-2.6, was used as fine aggregate. The mud content (by mass) was less than 1.5%, and the clod content (by mass) was less than 0.5%.
Crushed limestone was used as coarse aggregate, and the gradation was: 4.75-9.50 mm: 45%; 9.5-16.0 mm: 47%; 16-19 mm: 8%. The mud content (by mass) was less than 1.5%, and the clay lump content (by mass) was less than 0.5%.
The poly carboxylic acid water reducing agent was used for casting HPC, and its solid content is 30% and the water reducing rate can reach 35%.
The mineral components of silica fume from a commercial supplier are shown in Tab.2.
The specimens used in biaxial tests were cubes with dimensions of 100 mm×100 mm×100 mm. In order to prevent the eccentricity effect in the tests, the specimens were carefully polished to ensure that each surface was smooth, and adjacent planes were perpendicular to each other. A total of 12 stress ratios has been designed for the biaxial tension-compression tests, and for each stress state more than 4 specimens were tested for obtaining the average strength value. The stress ratio of tensile stress to compressive stress design and the number of specimens for each stress state are shown in Tab.3.

Tab.2 Mineral component of silica fume

Tab.3 Stress ratio design of biaxial tension-compression test
1.2 Test setup
The triaxial testing machine with the compressive or tension load capacity of 3 000 kN or 500 kN along each axial direction is used for the biaxial tension-compression tests. This machine is a servo-controlled loading system with a close-loop displacement control strategy along the vertical axis and a force control strategy along the other two perpendicular horizontal axes. The testing machine is shown in Fig.1. For the testing system, axial tension or compression loads can be applied with an arbitrary stress ratio by using six independent actuators (two actuators alongxoryorzdirection).

Fig.1 Real tri-axial testing system in DUT
As shown in Fig.2, all specimens were loaded by the force control and displacement control along the tensile and compressive direction respectively during the tests. Two load cells at the bottom and on the left were kept static, and a proportional load was applied through the other two load cells on the right and top of the specimen. To minimize the friction effect, three layers of greased plastic membrane were used in order to decrease the end friction between the specimen surfaces and loading platens. Each load cell was connected to loading plate by a ball hinge, to ensure that the specimen was always loaded along two perpendicular directions. The epoxy resin was used to bond specimen with the steel platens along the tension direction to avoid separation during tests. Then the specimen was installed into the testing machine through a pulling rod which was connected to the specimen with bolts.
In order to obtain the stress-deformation curves, the deformations were measured by two external linear variable displacement transducers (LVDTs) along the whole length of the specimen in each direction of the specimen. Additionally, strain gauges were bonded on the free surface to measure the strains of specimens under the biaxial tension-compression loading condition.

Fig.2 Schematic diagram of biaxial tension-compression test
2 Test Results and Discussions
2.1 Failure modes
The crack patterns and failure modes for all specimens were recorded. According to the loading condition, all specimens could be classified into three categories: uniaxial tension, uniaxial compression, biaxial tension-compression, the failure phenomenon of each test was very different.
2.1.1Uniaxial tension test
In the uniaxial tension test, it can be observed that the distance between the failure plane and the surface of specimen was about 5 mm, as shown in Fig.3. The aggregate going through the failure plane broke due to the high strength of the cementitious matrix. A total of 8 uniaxial tension tests were conducted, and showed the same failure mode. The average tensile strength measured was about 5 MPa, slightly higher than that of ordinary concrete. The reason was that silica fume was a kind of active additive, which could effectively improve the strength of the strength of the cementitious matrix as well as the interfacial transition zone.
2.1.2Uniaxial compression test
As shown in Fig.4, under the uniaxial compression loading condition, the tensile strain was produced perpendicular to the direction of compression due to the Poisson effect. With the increase of the external loading, the tensile strain exceeded the ultimate tensile strain of HPC, two groups of cracks parallel to the loading direction occurred on the sides of the specimen, and the specimen finally broke into several column-shape parts. For this loading condition, 6 specimens were prepared and tested, and the average compressive strength was about 60 MPa. The main difference between HPC and ordinary concrete is the use of water reducing agent and silica fume.

Fig.5 Failure modes of biaxial tension-compression test specimens

Fig.3 Failure mode of HPC under uniaxial tension loading condition
It makes the pore diameter of hardened cement mortar much smaller and greatly reduces the volume of pore, which shows a significant impact on the concrete strength.
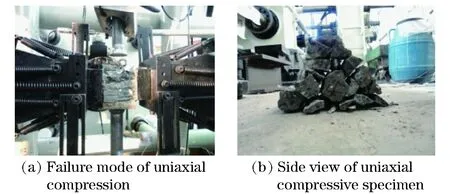
Fig.4 Failure mode of uniaxial compression test specimen
2.1.3Biaxial tension-compression test
It can be observed from Fig.5 that the failure modes of HPC cubes under the biaxial tensile-compressive stress state are related to the stress ratio (σ2/σ1). When the stress ratio was greater than -0.05, specimens failed by the concrete crushing failure; When the stress ratio was less than -0.05, specimens always failed by the tensile splitting failure.
When the stress ratio was less than -0.05, the specimens failed by the tensile splitting failure and the cracking plane was gradually close to the center of the specimen with the increase of stress ratio. When the stress ratio was -0.35, the cracking plane was parallel to the surface of the specimen and was 28 mm from the nearest side. With the increasing compressive stress, its effect on the failure of the specimens became significant, and could not be ignored. Under both compressive stress and tensile stress along two perpendicular directions, micro cracks appeared at the edge of the specimen. When the stress ratio reached -0.05, the compressive stress caused an obvious effect on the failure of the specimens, and a number of cracks perpendicular to the tensile force appeared on the specimen surface before a final failure was reached. The reason was that a series of micro cracks were caused under the relative high compressive stress in one direction, and the cracks grew into main cracks under the tensile stress along in the perpendicular direction. The specimens finally failed by the tensile splitting failure under the biaxial tensile-compressive stress state.
The specimens with the final concrete crushing showed obvious compressive failure characteristics during the test. Take the specimen with a stress ratio of -0.025 as an example. Firstly, the initial crack occurred, and developed gradually with an angle of about 30 degrees (as shown in Fig.5) under the combined action of tensile stress and compressive stress. The crack extended to the middle part of the specimen, and intersected with many fine cracks which were perpendicular to the pulling direction. Under the biaxial tensile-compressive stress state, these micro cracks and the initial crack grew rapidly, until the final crushing of concrete took place.
2.2 Ultimate strength


Fig.6 Strength envelope of biaxial tension-compression test

Tab.4 Normalized principal stresses under biaxial tension-compression loading condition
2.3 Stress-strain curves
The strains and deformations were measured for all specimens using electrical train gauges, and LVDTs on the free surfaces of directions.
In the uniaxial tension or uniaxial compression tests of concrete, the representative stress and strain data was recorded to draw the uniaxial tensile stress-strain curves and the uniaxial compressive stress-strain curves, as shown in Fig.7 and Fig.8.

Fig.7 Stress-strain curves of uniaxial tension test

Fig.8 Stress-strain curves of uniaxial compression test
Due to the fact that the force and displacement loading modes were applied along the tensile and compressive direction respectively, the descending branch of uniaxial tensile stress-strain curves couldn’t be gotten. The uniaxial tensile curves showed an obvious linear characteristic. There is little difference for the initial elastic modulus of each curve, and the average value was about 50 GPa, 25% higher than that of uniaxial compression tests. The average ultimate tensile strains were 87.5μεand the average ultimate tensile stress was 4.49 MPa, which were approximately 1/30 and 1/10 of that under the uniaxial compression loading condition respectively.
In the biaxial tension-compression test, theσ1-ε2curves and theσ1-ε1curves were shown in Fig.9 and Fig.10. As can be seen from Fig.9, the peak stress and peak strain gradually increased with the increase of the stress ratio. When the stress ratio was approaching -∞ (uniaxial tension), the peak stress was 4.21 MPa and the peak strain was 80.5 με; When the stress ratio reached -0.025, the peak stress reached 30 MPa, the peak strain was 548 με. As can be observed from Fig.10, the peak stress and peak strain gradually increased with the gradual increase of stress ratio. At the stress ratio of -1, the peak stress is 4.21 MPa and the peak strain was 216 με. At the stress ratio of 0 (uniaxial compression), the peak stress reached 58.4 MPa, and the peak strain was 2 330 με. The compressive stiffness and strength of specimens increased with the increasing stress ratio. Increasing the stress ratio means decreasing the tensile stress along the lateral direction when the compressive loading was applied along the vertical direction, and the compressive strength or stiffness keeps increasing with the stress ratio, as shown in Fig.9 and Fig.10.

Fig.9 σ1-ε2 curves in biaxial tension-compression test
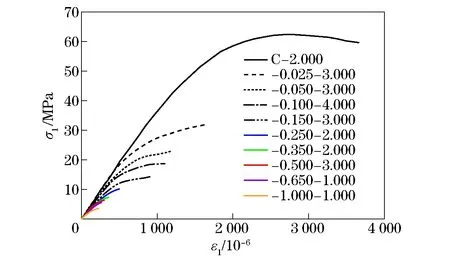
Fig.10 σ1-ε1 curves in biaxial tension-compression test
2.4 Failure criterion
2.4.1Classical biaxial tension-compression failure criterion
At present, the biaxial failure criterion of the ordinary concrete under the biaxial stress state was established by Kupper and Gerstle[4]in 1969, the strength envelope is shown in Fig.11. Kupper proposed the following failure criterion for biaxial tensile-compressive stress states as:
① Whenα=σ2/σ1≤0.304 8,
σ1≥ft
(1-a)
② When -0.304 8≤α=σ2/σ1≤0,
(1-b)
whereftis the uniaxial tensile strength of concrete, which is defined to be negative;σ1andσ2are the biaxial strengths of concrete. The tensile stress is defined to be positive, and the compressive stress is defined to be negative;α=σ2/σ1is a stress ratio.
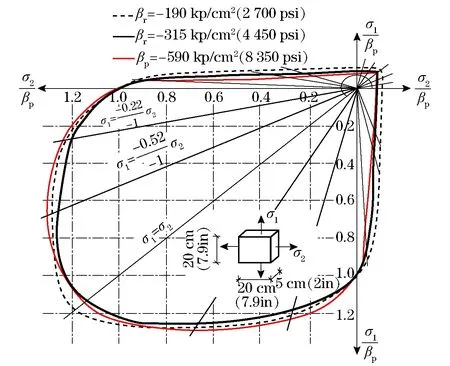
Fig.11 Strength envelope of ordinary concrete under biaxial stress state
The approximate biaxial strength envelope of concrete was established by Professor Guo[15], as shown in Fig.12. The failure criterion of concrete under the biaxial tension-compression is given by
① When -∞≤α=σ1/σ3≤-0.05 (BCsegment),
(2-a)
② When -0.05≤α=σ1/σ3≤0 (CDsegment),
(2-b)

Fig.12 Envelope of biaxial strength of ordinary concrete by Guo
2.4.2Verification of classical failure criterion

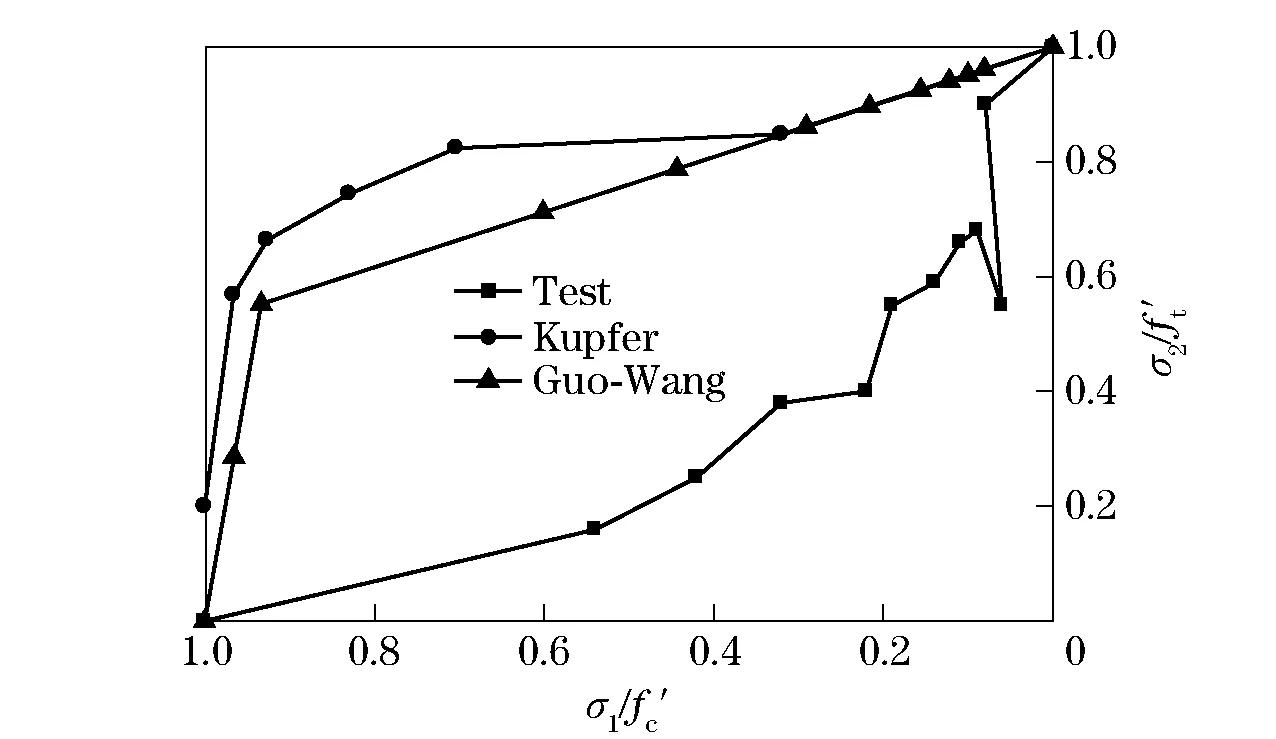
Fig.13 Comparison of the calculated results with the test results
As can be seen from Fig.13, the calculated results were very different from the test results either from the classical failure criterion of Kupfer or from the simplified failure criterion proposed by Guo-Wang.The conclusion can be made that the failure criterion of ordinary concrete is not suitable to HPC, so the biaxial tensile-compressive strength envelope of HPC should be re-established.
2.4.3Establishment of a novel failure criterion of HPC under the biaxial tensile-compressive strength
According to the test results, the test results were fitted, and the fitting line and formula are shown in Fig.14.
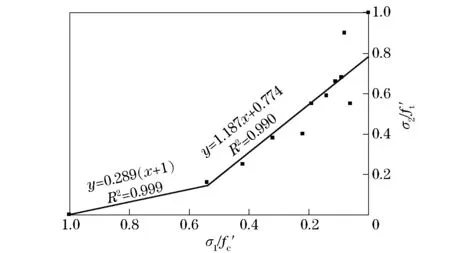
Fig.14 Fitting of the test results of HPC under biaxial tension-compression
As shown in Fig.14, the fitting curve is divided into two parts. For the segment of -0.025≤α≤0, the fitting straight line equation can be given by
(3-a)
Reconstructing the equation, we have
(3-b)
Then, we have
(3-c)
Similarly,
(4)
for the segment of -∞≤α≤-0.025, the fitting straight line equation can be given by
(5-a)
Reconstructing the equation, we have
(5-b)
Then, we have
(5-c)
Similarly,
(6)
The failure criterion of HPC under the biaxial tensile-compressive stress can be given by

(7-a)

(7-b)

Fig.15 Comparison of calculation results from the proposed failure criterion and test results

3 Conclusions
In this paper, the biaxial tension-compression tests of high performance concrete were conducted with a real tri-axial testing system. Based on the test results, the following conclusions can be drawn:
① The failure mode of HPC under the biaxial tensile-compressive stress state is related to stress ratioα=σ2/σ1. When the stress ratio was larger than -0.05, specimens failed by the compression crushing failure; and when the stress ratio was less than -0.05, specimens failed by the tensile splitting failure;
② Under the biaxial tension-compression stress state, the tensile strength of specimens decreased with the increasing stress ratio, while the compressive strength increased gradually, the feature of one axial stress decreases with the increasing of another axial stress;
③ The failure criterion of HPC is different from the ordinary concrete, and a novel failure criterion is proposed for HPC under the biaxial tensile-compressive stress state, which is verified with the test results.
 Journal of Beijing Institute of Technology2018年3期
- Journal of Beijing Institute of Technology的其它文章
- Simplified Method for Joint Calibration of 3D Ladar and Monocular Camera
- Force Control of Electro-Hydraulic Servo System Based on Load Velocity Compensation
- Name Relevance and Contact Opportunity-Based Routing Strategy for Mobile Content Sharing
- Identification of Driving Intention Based on EEG Signals
- High-Speed Noise-Based Random Bit Generator by Removing 1/f Noise with Differential Comparison
- Radiometric Calibration Chain Design Based on Uniform Collimated Laser Source
