Efficient three-dimensional high-resolution simulations of flow fields around cylinders
Hnxu Zheng , b , Jisong Wng , b , ∗
a School of Naval Architecture, Ocean and Civil Engineering, Shanghai Jiao Tong University, Shanghai 200240, China
bMOE Key Laboratory of Hydrodynamics, Shanghai Jiao Tong University, Shanghai 200240, China
Abstract Few works use the fully three-dimensional computational fluid dynamic method to simulate the flow fields around the marine pipes with large aspect ratios due to the huge computation cost. In the present work, an operator-splitting method is used to efficiently solve the three-dimensional Reynolds Average Navier–Stokes governing equations of the fluid flow around pipes by separating the problem as a combination of a two-dimensional problem in the horizontal plane and an one-dimensional problem in the vertical direction. A second order total variation diminishing finite volume method is used to solve the model. The precision of the present model is validated by comparing the present numerical results of two typical three-dimensional cases with the available experimental and numerical results. The simulation results with a commercial software are also included in the comparison and the present model shows a higher performance in terms of computational time.
Keywords: CFD; Cylinder; Cube; Operator-splitting; TVD; Three-dimensional.
1.Introduction
The long offshore marine riser structural responses under the practical ocean conditions have been numerically studied by many researchers as reflected in the reviews by Bearman[1] , Williamson [21] and Norberg [11] . The computational fluid dynamic (CFD) method has been considered as a superior method in the relevant flow field simulations that provide the fluid forces exerted on to the structure. However,due to the huge computation cost, it has not been widely used in the study of the marine pipes with large aspect ratios.Many works use the wake oscillating method [15] to approximately calculate drag and lift coefficients since it is simple and less computational resource consuming. In a recent work of Nishi and Doan [10] , the authors used this model to study the vortex-induced vibration (VIV) suppression mechanism of the damping devices. However, it is a simplified model and the turbulent flow traits are omitted. The parameters of the model rely on certain experimental data and may not be fit for the other practical cases. The discrete vortex method(DVM) is also usually used by the researchers [22] . It models the vortex motion in the wake of flow past bluff bodies,requires small calculation resources and provides less precise simulation results than the ordinary CFD methods.
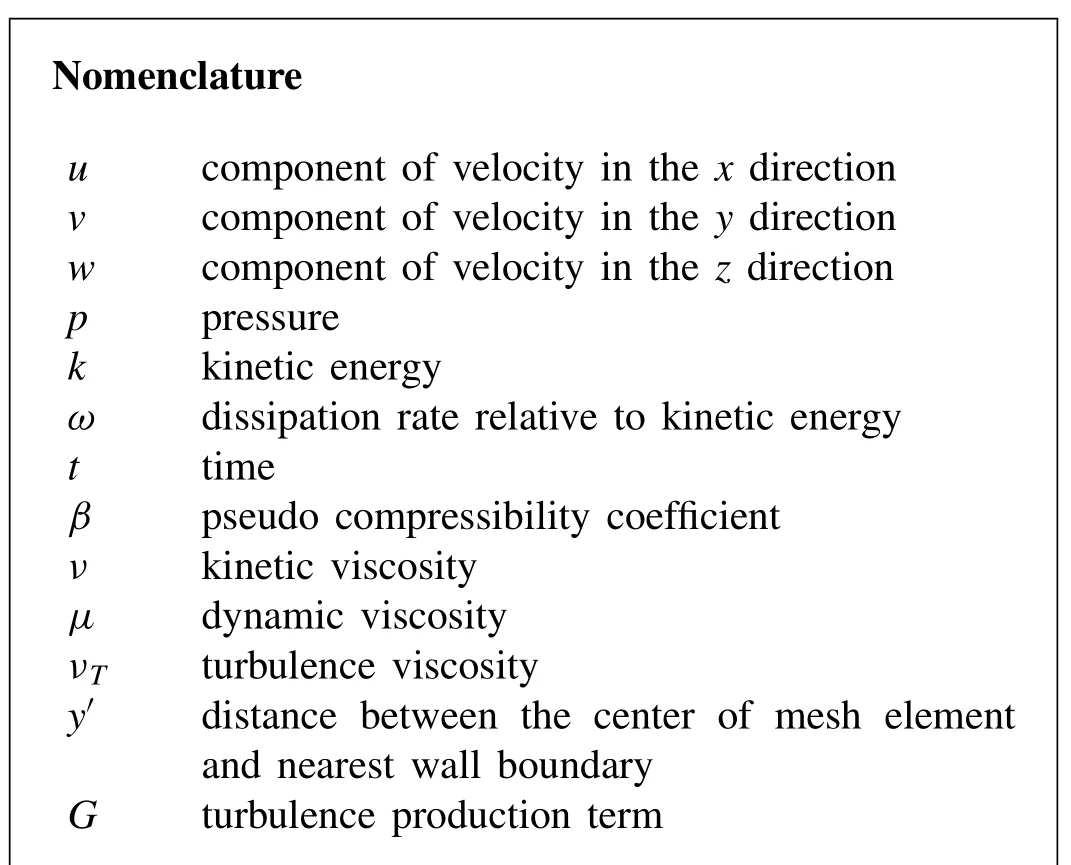
In the research works where the Navier–Stokes(N–S) equations are used as the governing equations of the fluid flow, the structures usually have confined aspect ratios withL/D< 100.Pontaza and Chen [12] used the large eddy simulation (LES)method to study the VIV of the circular cylinders undergoing two degrees of freedom and the cylinder had an aspect ratio ofL/D= 3. In the work of Pontaza et al. [13] the LES method is used to simulate the three-dimensional (3-D) flow past the smooth and the rough circular cylinders either bare or out fitted with helical strakes while the studied cylinders have an aspect ratio ofL/D= 9. Zhao et al. [23] used the 3-D N–S equations to study the VIV of an elastically mounted rigid circular cylinder in the steady current and the cylinder in the research had an aspect ratio ofL/D= 7. In the work that studies the structures with large aspect ratios, the twodimensional (2-D) strip method is usually used in order to reduce the size of the numerical solutions. A few fully 3-D research works have been done on the large aspect ratio structures by some scholars. Constantinides et al. [2] and Holmes et al. [4] used a fully 3-D numerical method to predict the VIV of a riser withL/D= 1407 while very coarse triangular fluid mesh was used to keep the size of the problem tractable.Huang et al. [5] used a chimera model combined with the LES and the Reynolds Average Navier–Stokes (RANS) to predict the 3-D VIV response for an 10 meter riser that has an aspect ratio ofL/D= 482in experiment. A resource consuming finite-analytic method is used to solve the model in this work. Wang et al. [18] used the RANS equations closed with thek−ωturbulence model to simulate a three dimensional VIV case for a 500-meters-long marine riser withL/D= 937 using a supercomputer while the computational cost is very huge and the software run for a very long time. From the previous studies, the huge computation cost has been found to be the major obstacle in using the fully 3-D CFD method to simulate the flow fields around the cylinders with large aspect ratios.
To effectively simulate the flow fields surrounding the practical marine structures with large aspect ratios, we seek to build a numerical model that consumes fewer computation resources while maintains a certain level of numerical precision. Since the precision and the computation cost of the RANS model lies between the LES and the DVM, it is selected in the present model. An operator-splitting method is also used to reduce the computation cost while it brings no additional numerical error to the simulation results of the cases with uniform cross-sections. The shear stress transport(SST) turbulence model [9] is used to close the RANS model and a total variation diminishing (TVD) finite volume method(FVM) is used to solve the model. The TVD-FVM method of Wang et al. [20] is effective for solving the governing equations of the fluid with structured fluid meshes. This numerical method is combined with the element velocity vector transform (EVVT) method [19] to solve the problems with curvilinear boundaries while no extra effort is needed to deal with the complex curvilinear coordinates. To validate the precision of the present model, the flow over a ground-mounted cylinder and cube is simulated and compared with the available experimental and numerical results. To examine the efficiency of the present numerical method, the case with the ground-mounted cube is simulated using a commercial software CFX and the numerical efficiency is compared with that of the present model.
The flow over a circular cylinder placed on a rigid floor has been a subject studied by many investigators. It is chosen as one of the cases in the present work because the 3-D effect in the flow field can be extremely apparent. The horseshoe vortex emerges at the front bottom of the cylinder due to the reverse of the downward flow on the upstream side of the cylinder. On the downstream side of the pipe, a kind of vortex shedding that is similar to the 2-D Karman vortex street emerges. The flow over a ground-mounted cube can be more complex due to the sharp edges and the flow over the top.The sharp edges make the flow separation easier to occur and the flow over the top will have profound effects on the vortex structures in the wake of the flow field.
The experimental research on the ground-mounted circular cylinder has been carried out by many researchers. In the present work, the experimental results of Dargahi [3] are used as the benchmark. Dargahi [3] provided a series of experimental results including the pressure distribution, the velocity distribution and the position of the primary horseshoe vortex. Several scholars numerically studied this case and their results are compared with the present numerical result.Tseng et al. [16] used a LES turbulent model (cell-averaged sub-grid scale turbulence model) and MacCormack’s explicit predictor-corrector scheme to simulate the 3-D turbulent flow field around the circular pier. Roulund et al. [14] used the RANS and the SST turbulence model to simulate the flow field around the circular cylinder while a HYBRID scheme that combines a first-order upwind difference scheme and a second-order central difference scheme was used to solve the model. In the numerical work of Zhao et al. [24] , the author also used the RANS closed with the SST turbulence model to simulate the fluid flow while a finite element method was used to solve the model.
Martinuzzi and Tropea [8] provided the classic experimental results for the flow past a ground-mounted cube and the experimental setup conditions are used in the present numerical simulation of this case. Several simulation results of this case using the other numerical models are compared with the present numerical result. Lakehal and Rodi [7] used a steady model to simulate the flow past a surface-mounted cube. The author used different variations of thek− εturbulence model to close the governing equations and a central difference FVM was used to solve the model. A simulation of this case is also performed with the commercial software CFX in order to validate the efficiency of the present code. The SST turbulence model is also used in this simulation and the model is solved with the second-order numerical scheme provided in the CFX software.
2.The hydrodynamic model and the operator-splitting process
The governing equations of the incompressible fluid flow in the present work are the unsteady Reynolds averaged Navier–Stokes (URANS) equations closed with the SST turbulence model. The conventional continuity equation is modified with the pseudo-compressibility method that is used in the work of Wang [17] . To express the model in a clear manner and to make it more convenient for the following procedures, the model is rewritten into the conservative mode:

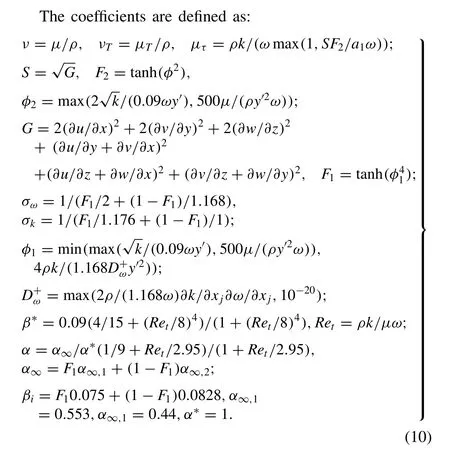
Since the geometric model is normal and simple along the cylinder axis, an operator-splitting method is used to reduce the computation cost in solving the governing equations.We do this by splitting the convection terms into the twodimensional part (including thexand theydirection) and the one-dimensional part (zdirection).
The part in the horizontal direction (i.e. thexandydirection) is written as follows:

while the part in the vertical direction (thezdirection) is:

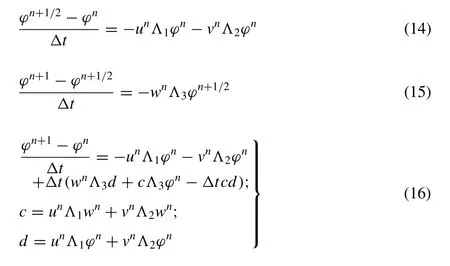
By splitting the 3-D governing equations and solving them separately, the computation efforts for the cases with a uniform cross-section can be reduced while the theoretical precision of the result is the same as that from solving the complete equations without splitting. The computation cost for the pure CFD case is reduced because no extra effort is needed for the solver to calculate the volume of every cubic fluid mesh element, the outer normal vector and the area of every element face. In the fluid-structure interaction cases, the calculation cost will be further reduced since the three geometric parameters need not to be upgraded every time step,while in a common 3-D solver they should be recalculated every time when the mesh nodes in the flow field change their positions. The precision conservation mechanism of the operator-splitting method is discussed below. For simplicity,only the flux terms are discussed and the iteration time differential term in the pseudo-compressibility method has been omitted. In Eq. (13) , the complete momentum, turbulent kinetic and dissipation equations are rewritten into the discrete form and the time differential operator is simply replaced by(ϕn+1− ϕn) / Δt(ϕ =u,v,w,k, ω) for presentation. Note that this simple differential scheme has a numerical error at the level ofo( Δt). Here, Λi,i= 1 , 2, 3 stands for the discrete numerical methods we use for solving the spatial differential terms.

Fig. 1. (a) The original 3-d mesh element faces and the corresponding outward unit normal vectors; (b) The transformed 3-d mesh element faces and the corresponding outward unit normal vectors.

Eqs. (14) ~(15) describe the split form of Eq. (13) . ϕn+1/2stands for the intermediate physical parameters produced during the calculation. Combining Eqs. (14) and (15) , we can get Eq. (16) that is similar to Eq. (13) . Comparing Eqs. (13) and(16) , the difference is found to be on the level ofo( Δt),which is the same as the numerical error of the simple discrete scheme in the presentation. Therefore, splitting the equation will not bring additional numerical error in the time domain during the calculation.
The mechanism behind the precision conservation of the operator-splitting in the spatial differential terms are explained in the following equations. The shape of the fluid mesh elements should possess two characters: First, the upper and the lower faces (s5 ands6 in Fig. 1 ) should always have the same shape and area. Second, the mesh nodes can only move within their original horizontal planes. Considering only the flux terms, by integrating Eq. (11) in the element Ωand using Green’s function, we can get:

Fig. 2. The projection of the surface 1 and the surface 3 in the xoy plane.
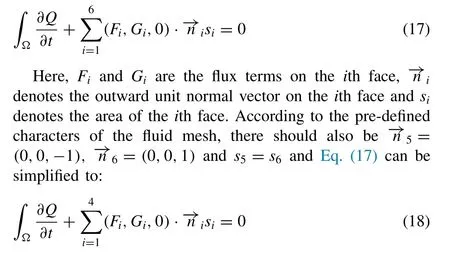
Therefore, the equations in the horizontal direction can be reduced into the two-dimensional form and no additional numerical error is produced.
By integrating Eq. (12) within the element Ωand considering only the flux terms, we have:

Take the mesh grid movement in Fig. 2 as an example, we have

Due to the pre-defined fluid mesh characters, the valuesare easy to calculate. The values ofHi(i=1 ~4) can be calculated using the same TVD-FVM method that is used to solve the two-dimensional part of the model.Since we have= (0, 0, −1) ,= (0, 0, 1) ands5 =s6 in every fluid mesh element, the values ofH5andH6can be calculated using the finite difference TVD method and no extra numerical error will be produced.
The TVD-FVM numerical method of Wang [17] is used to solve the governing equations of the fluid. To avoid using the complex curvilinear coordinates at the boundary, an elemental velocity vector transformation (EVVT) approach proposed by Wang [19] is used to treat the convective term so that the TVD numerical scheme can be put into effort using the main and satellite elements. A second order accuracy can be reached using this numerical method.

Fig. 3. The overview of the simulation area of the case with the groundmounted circular cylinder.
3.The simulation models
3.1. The ground mounted circular cylinder
The diameter of the circular cylinder in the present simulation is set as 1D. The simulation is performed within a 39D× 16D×hDdomain. Herehstands for the height of incoming fully developed open channel flow. For example, in the case that takes the experimental results of Dargahi [3] as the benchmark,his set as 1.34; in the case that follows the experiment of Roulund et al. [14] ,his set as 1. The distance from the circular cylinder center to the inlet boundary is 8Dand the distance from the pile center line to the outlet boundary is 31D. The boundary conditions are exhibited in Fig. 3 and they are defined as follows.
Inlet boundary: In order to control the boundary layer thickness at the location of the cylinder, a shear flow inlet profile that complies with the logarithmic law is applied at the inlet boundary. For each case, the shear flow inlet boundary data is achieved from the simulation of a fully developed channel flow that is built using the experimental inflow condition provided by Dargahi [3] and Roulund et al. [14] , respectively. It is deserve noting that the initial flow field data in the simulation domain are set same as the inlet boundary.
Outlet boundary: Neumann boundary condition( ∂ ϕ /∂=0, ϕ =p,u,v,w,k, ω).
Symmetry boundary: Neumann boundary condition.
Non-slip smooth wall condition: Enhanced wall treatment[9] .
Note that no surface effect is considered on the up-surface of the flow field.
3.2. The ground-mounted cube
Unlike the case with the circular cylinder, the cube is placed in a closed channel with a height twice as the height of the cube. Therefore, the flow over the top surface of the cube will also be simulated. Along with the influence of the sharp shape of the bluff body, the flow field in this case shows a much more complex character than that in the circular cylinder case.

Fig. 4. The overview of the simulation area of the case with the groundmounted cube.
The boundary conditions along with the scale of the simulated flow field are summarized in Fig. 4 . The boundary conditions here share the same definitions as in the circular cylinder case except for the inlet boundary since the upper and lower boundaries are both defined as the rigid wall in this case.
4.Results and discussion
4.1. Mesh and time step dependence study
The mesh and time step convergence study is performed first. Two-dimensional circular cylinder cases are performed in 4 groups with 4 meshes with increasing mesh nodes,while different time steps are used within each group. 200 nodes are set along the circumference of the cylinder and the minimum mesh size next to the cylinder surface in the radial direction is 0.0018D. The non-dimensional mesh size next to the cylinder surface is found to bey+= 3 , wherey+is defined asy+=uτy/ν. Here,uτis the friction velocity andyis the distance from the mesh node to the nearest wall. The time steps of 1 .e− 3s(C= 0. 30), 7 .e− 4s(C=0. 23) , 5 .e− 4s(C= 0. 16 ) and 2.e− 4s(C= 0. 07 ) are used in the simulations. Here,Cis the Courant number, defined asC=uΔt/ Δx,uis the incoming flow velocity, Δtis the time step and Δxis the minimum mesh size next to the wall.Little difference can be found in the simulation results using the same mesh and different time steps andC= 0. 16 is used in the three-dimensional simulation cases in the present work. The results from the simulations with different meshes are presented in Table 1 . Here,Cdis the time averaged drag force coefficient andClis the amplitude of the lift force coef-ficient, whileStis the Strouhal number. The maximum difference between the simulation results from Mesh 1 and Mesh 2 is 3.8%, while the differences in the result values between Mesh 2 and Mesh 3 and between Mesh 3 and Mesh 4 are 0.9% and 1.7%, respectively. No obvious discrepancies can be found in the simulation results from the different meshes and the parameters of Mesh 3, including they+and the mesh size increasing ratio in the radial direction, are used in the following simulations.

Fig. 5. (a) The normalized pressure coefficient on the ground along the stream-wise central line; (b) The normalized pressure coefficient on the upstream surface of the cylinder across the water depth.

Table 1 Mesh dependence test results.
4.2. Results with the ground-mounted circular cylinder
4.2.1.Pressurecoefficient
Fig. 5 compares the pressure coefficients from the experimental results of Dargahi [3] , the present simulation results and the simulation results of the other researchers [14,16,24] .Tseng et al. [16] used a LES model and a MacCormack explicit predictor-corrector scheme to perform the simulation while Roulund et al. [14] used a steady statek−ωturbulence model and a HYBRID numerical scheme. Zhao et al.[24] also used thek−ωturbulent model in the simulation.Fig. 5 (a) plots the normalized bed pressure along the liney/D= 0on the floor while Fig. 5 (b) plots the normalized stagnation pressure on the upstream edge of the cylinder surface across the water depth.
In Fig. 5 (a), the present simulation results show a good agreement with the experimental data. The major discrepancy between the numerical results can be observed within the region of −0. 8 <x/D< −0. 68 , where the horseshoe vortex evolves as has been suggested in the study of Dargahi [3] .The plateau of the pressure coefficient in this region was claimed by the author to be the consequence of the smoothing effect of the horseshoe vortex. The plateau can be captured by all the numerical models while the position and pressure coefficient magnitude of the plateau are different among the simulation results of Roulund et al. [14] , Zhao et al. [24] and the present work. The model of Tseng et al. [16] provided a relative poor prediction of both the plateau position and the coefficient magnitude. In Fig. 5 (b), all the data show a large curvature atz/δ= 0. 1 . Compared with the experimental data and the other numerical results, the present numerical model can precisely predict the pressure coefficients across the water depth.
4.2.2.Velocityprofile
Figs. 6 and 7 plot the time-averaged experimental and numerical velocity data in both thexand thezdirections at different water depth levels above the rigid ground.Three groups of data are compared here: the experimental result of Roulund et al. [14] , the numerical result of Roulund et al. [14] and the numerical result from the present model.
Fig. 6 compares the velocity profile in thexdirection.The current numerical work correctly predicts the trends of the velocity profiles and the numerical results better fits the experimental data at the higherz/ δlevels of the flow field.The discrepancies at the lowerz/ δlevel may due to the discrepancy between the different inlet boundary data since the inlet boundary data in the present simulation comes from a channel flow simulation that may be different from the experimental data of Roulund et al. [14] . In the horseshoe vortex area( −1 . 0 <x/D< 0. 6 ), the present model predicts a larger curvature of the velocity profile than the model of Roulund et al. [14] . The present model also predicts smaller downstream velocities, which better agrees with the experiment result.
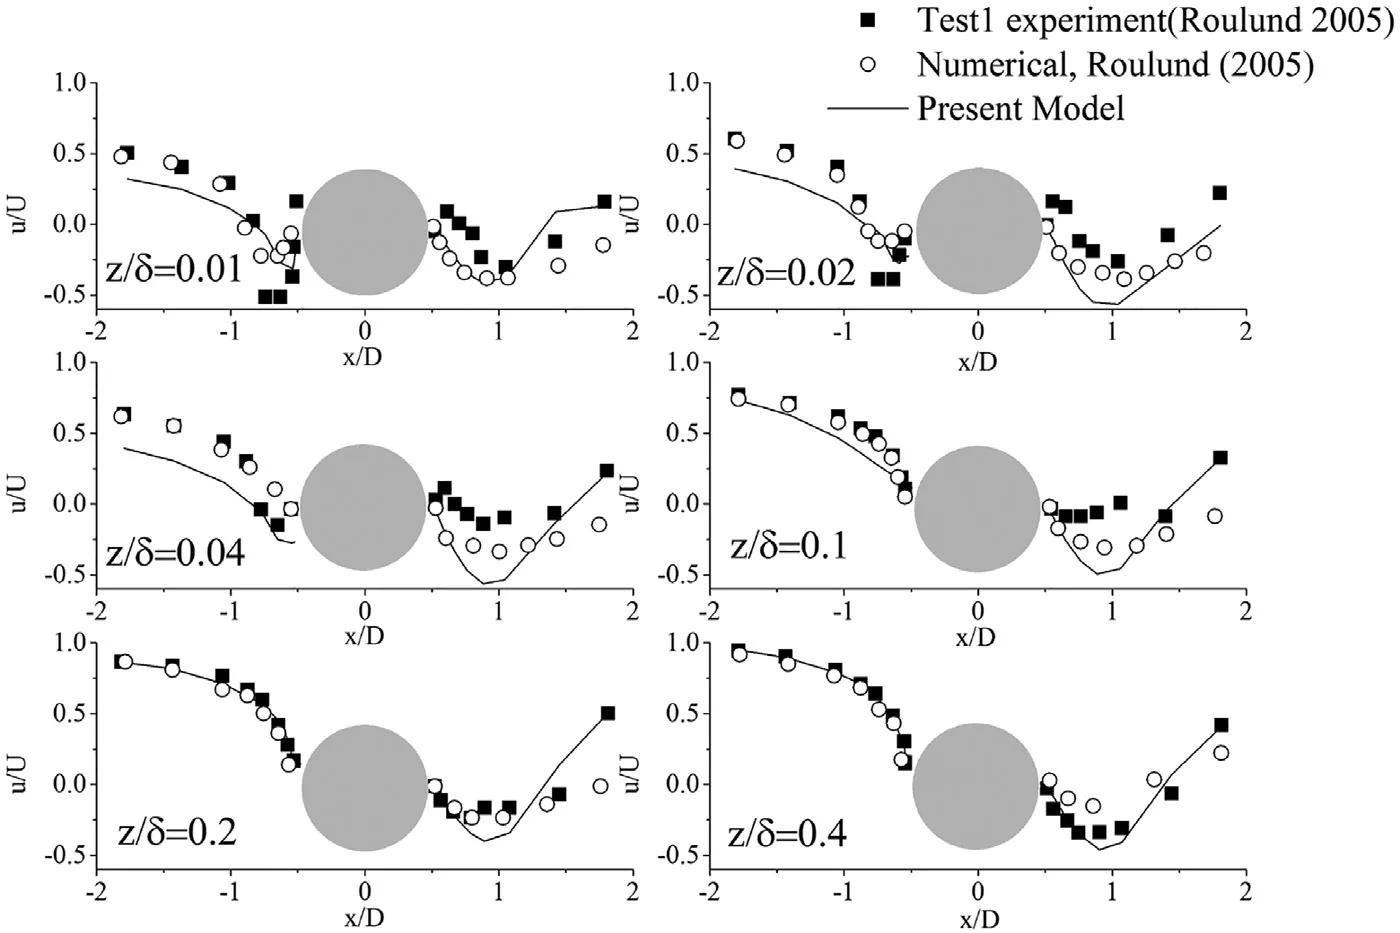
Fig. 6. Normalized x -direction velocity profile in the plane y / D = 0 at different water depths.

Fig. 7. Normalized z -direction velocity profile in the plane y = 0 at different water depths.
Fig. 7 shows that both the two numerical models underpredict the velocities in thezdirection in the near bottom region (z= 0. 01 δ,z= 0. 02δ) on the upstream side of the cylinder when compared with the experimental data. This has been discussed by Khosronejad et al. [6] that the bluff pile shape facing the upstream may cause the under-predict of the scour depth and smaller down-flow velocity. However, the numerical results with the present model predicts a larger down-flow velocity on the upstream side of the bluff body than predicted by the model of Roulund et al. [14] atz= 0. 04δandz= 0. 1 δ where the horseshoe vortex is prominent, which, is closer to the experimental result. Both the numerical results reach better agreement with the experimental data on the upstream face of the cylinder than on the downstream face of the cylinder.The reason may be attributed to the free surface effect in the experiment and the dummy ’lap’ applied on the top-surface of the simulated areas.
4.2.3.Vorticityfield
The streamlines are presented both horizontally and vertically in Fig. 8 . Fig. 8 (a) presents the streamlines on a vertically sliced plane of the 3-D flow field aty/D= 0. A clear down-flow and reverse flow can be observed at the front side of the cylinder bottom, representing the existence of the horseshoe vortex. The corresponding vortex structure in the horizontal plane at the rigid floor can be observed in Fig. 8 (b) where the scale of the reverse flow area is the same as that in Fig. 8 (a). As can be seen, the reverse flow will flow past the bilateral sides of the cylinder bottom and form the lee-wake at the down-stream side of the pile,making the wake different from the Karman Vortex Street.The flow characters shown in the stream traces matches well with that shown by the pressure coefficient and the velocity field.

Fig. 8. (a) The streamlines in the plane of y / D = 0; (b) The stream lines in the plane of z/ δ= 0.015.
To show the vortex structures in a more straight-forward manner, the Q-criterion is applied to describe the vorticities in the 3-D flow field. The Q-criterion is defined as follows.

Qdescribes the turbulence intensity in the flow field. In Fig. 9 , the iso-surfaces ofQin the flow field is plotted at different instan
ts over one period of the vortex shedding in the wake and the surfaces are plotted withQ′= 0. 27 .Q′is the normalized value ofQusingwhere the diameter of the cylinder is used as the reference length and the bulk inflow velocity is used as the reference velocity.As is shown in Fig. 9 , the 3-D view of the horseshoe vortex structure is prominent at the front bottom of the cylinder, as well as the periodic 3-D vortex structures in the lee-wake of the flow field.
4.3. Results with the ground-mounted cube
The experimental results of Martinuzzi and Tropea [8] have been cited as the benchmark by many researches that study the flow around the wall-mounted cube and the present simulation will be carried out under the same experimental setup condition. The inflow boundary condition is set with the data from a fully developed closed channel flow simulation that has a bulk velocity that ensures the same Re as in the experiment of Martinuzzi and Tropea [8] .
Lakehal and Rodi [7] used thek− εand a TLK turbulence model to simulate the case in this experiment and the report emphasized on the velocity field data validation and the flow field visualization. In order to validate the efficiency of the present numerical model in simulating the 3-D flow fields,a simulation is performed using CFX, which is a commercial CFD software. This simulation is carried out using the same flow field mesh as in the simulation with the present numerical model and the time step lengths are also set as the same. The two codes are run for the same time steps and the real time consumed by each code is compared. The present numerical results are compared with that from the work of Lakehal and Rodi [7] , the CFX simulation and the experimental results of Martinuzzi and Tropea [8] .
4.3.1.Velocityprofile
The velocity profiles in the planey/H= 0are compared at different locations in Fig. 10 . It is necessary to introduce the TLK model used by Lakehal and Rodi [7] . The TLK model utilizes the standardk−εturbulence model in the areas out of the viscous sub-layer while a modified mixing length model is applied within the viscous sub-layer. The diffusion fluxes are approximated using the central difference scheme and the convection fluxes are calculated with a hybrid linear-parabolic approximation.
The present numerical model tends to under-predict the velocity near the wall boundary, which can be seen in the velocity profile atx/H= −1 . 5 . The present model also predicts a stronger velocity gradient near the upper and lower boundary of the channel, giving a sharper shape of the velocity profile than the experimental result of Martinuzzi and Tropea [8] and the simulation result by Lakehal and Rodi [7] . In the areas closer to the bluff body, the present simulation results can reach a good agreement with the experimental data, which is shown atx/H= 0. 0andx/H= 0. 5 .x/H= 0. 0locates above the top face of the cube and thek−εmodel predicts no reverse flow at this location. Major discrepancies between the numerical results occur at the locations further off the downstream side of the cube, i.e.x/H= 2. 0andx/H= 3 . 5 .All of the numerical models predict larger reverse flow re-gions in the lee-wake while the present model can give a better approximation to the experimental result when compared with the numerical results of Lakehal and Rodi [7] and the simulation result from the CFX.
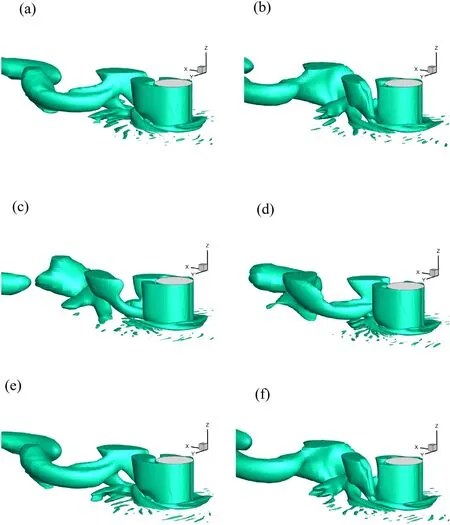
Fig. 9. The instant vorticity fields over one period of vortex shedding behind the ground-mounted circular cylinder with Q’ = 0.27.
4.3.2.Vortexstructure
Fig. 11 compares the streamlines in the plane ofy/H= 0.The experimental data shows a reverse flow area in the wake of the bluff body that ranges within 0.5 <x/H< 2.0. Thek− ε model of Lakehal and Rodi [7] predicts the reverse flow to emerge within the area of 0.5 <x/H< 2.5. However, no reverse flow can be seen on the top of the cube in this numerical result as can be observed in the experimental result. This conforms to the velocity profile shown in Fig. 10 . The TLK model Lakehal and Rodi [7] correctly captures the reverse flow over the top of the cube but predicts a larger reverse flow area in the region of 0.5 <x/H< 3.0 behind the cube.The CFX simulation also predicts a reverse flow area in the region of 0.5 <x/H< 3.0 while the reverse flow on the top of the cube is also prominent. The present model can better predict the reverse flow region than the TLK model and the CFXin the region of 0.5 <x/H< 2.5 and the reverse flow on the top of the cube can also be correctly captured. This conforms with the superior performance of the present model in predicting the velocity profile in Fig. 10 . The size of the horseshoe vortex and the major reverse flow in the wake from the simulation results of the present model, the CFX, thek− εmodel and theTLKmodel of Lakehal and Rodi [7] are compared with the values from the experiment in Table 2 . The sizes of the two vortex structures are defined in Fig. 12 where the stream traces in the plane ofz/H= 0. 005 are plotted. The normalized size of the horseshoe vortex (LH/H) is defined as the distance between pointAat which ∂v/∂y− ∂u/∂x= 0. 0 on the liney/H= 0. 0in this plane and pointBwhere the liney/H= 0. 0intersects with the front edge of the cube.The normalized size of the reverse flow in the wake (LR/H)is defined as the distance between the intersection pointCand pointDwhere the value of ∂v/∂y− ∂u/∂xalso equals 0.0 on the liney/H= 0. 0. The comparison suggests that the present numerical model can more precisely predict the sizes of the vortex structures in the flow field.
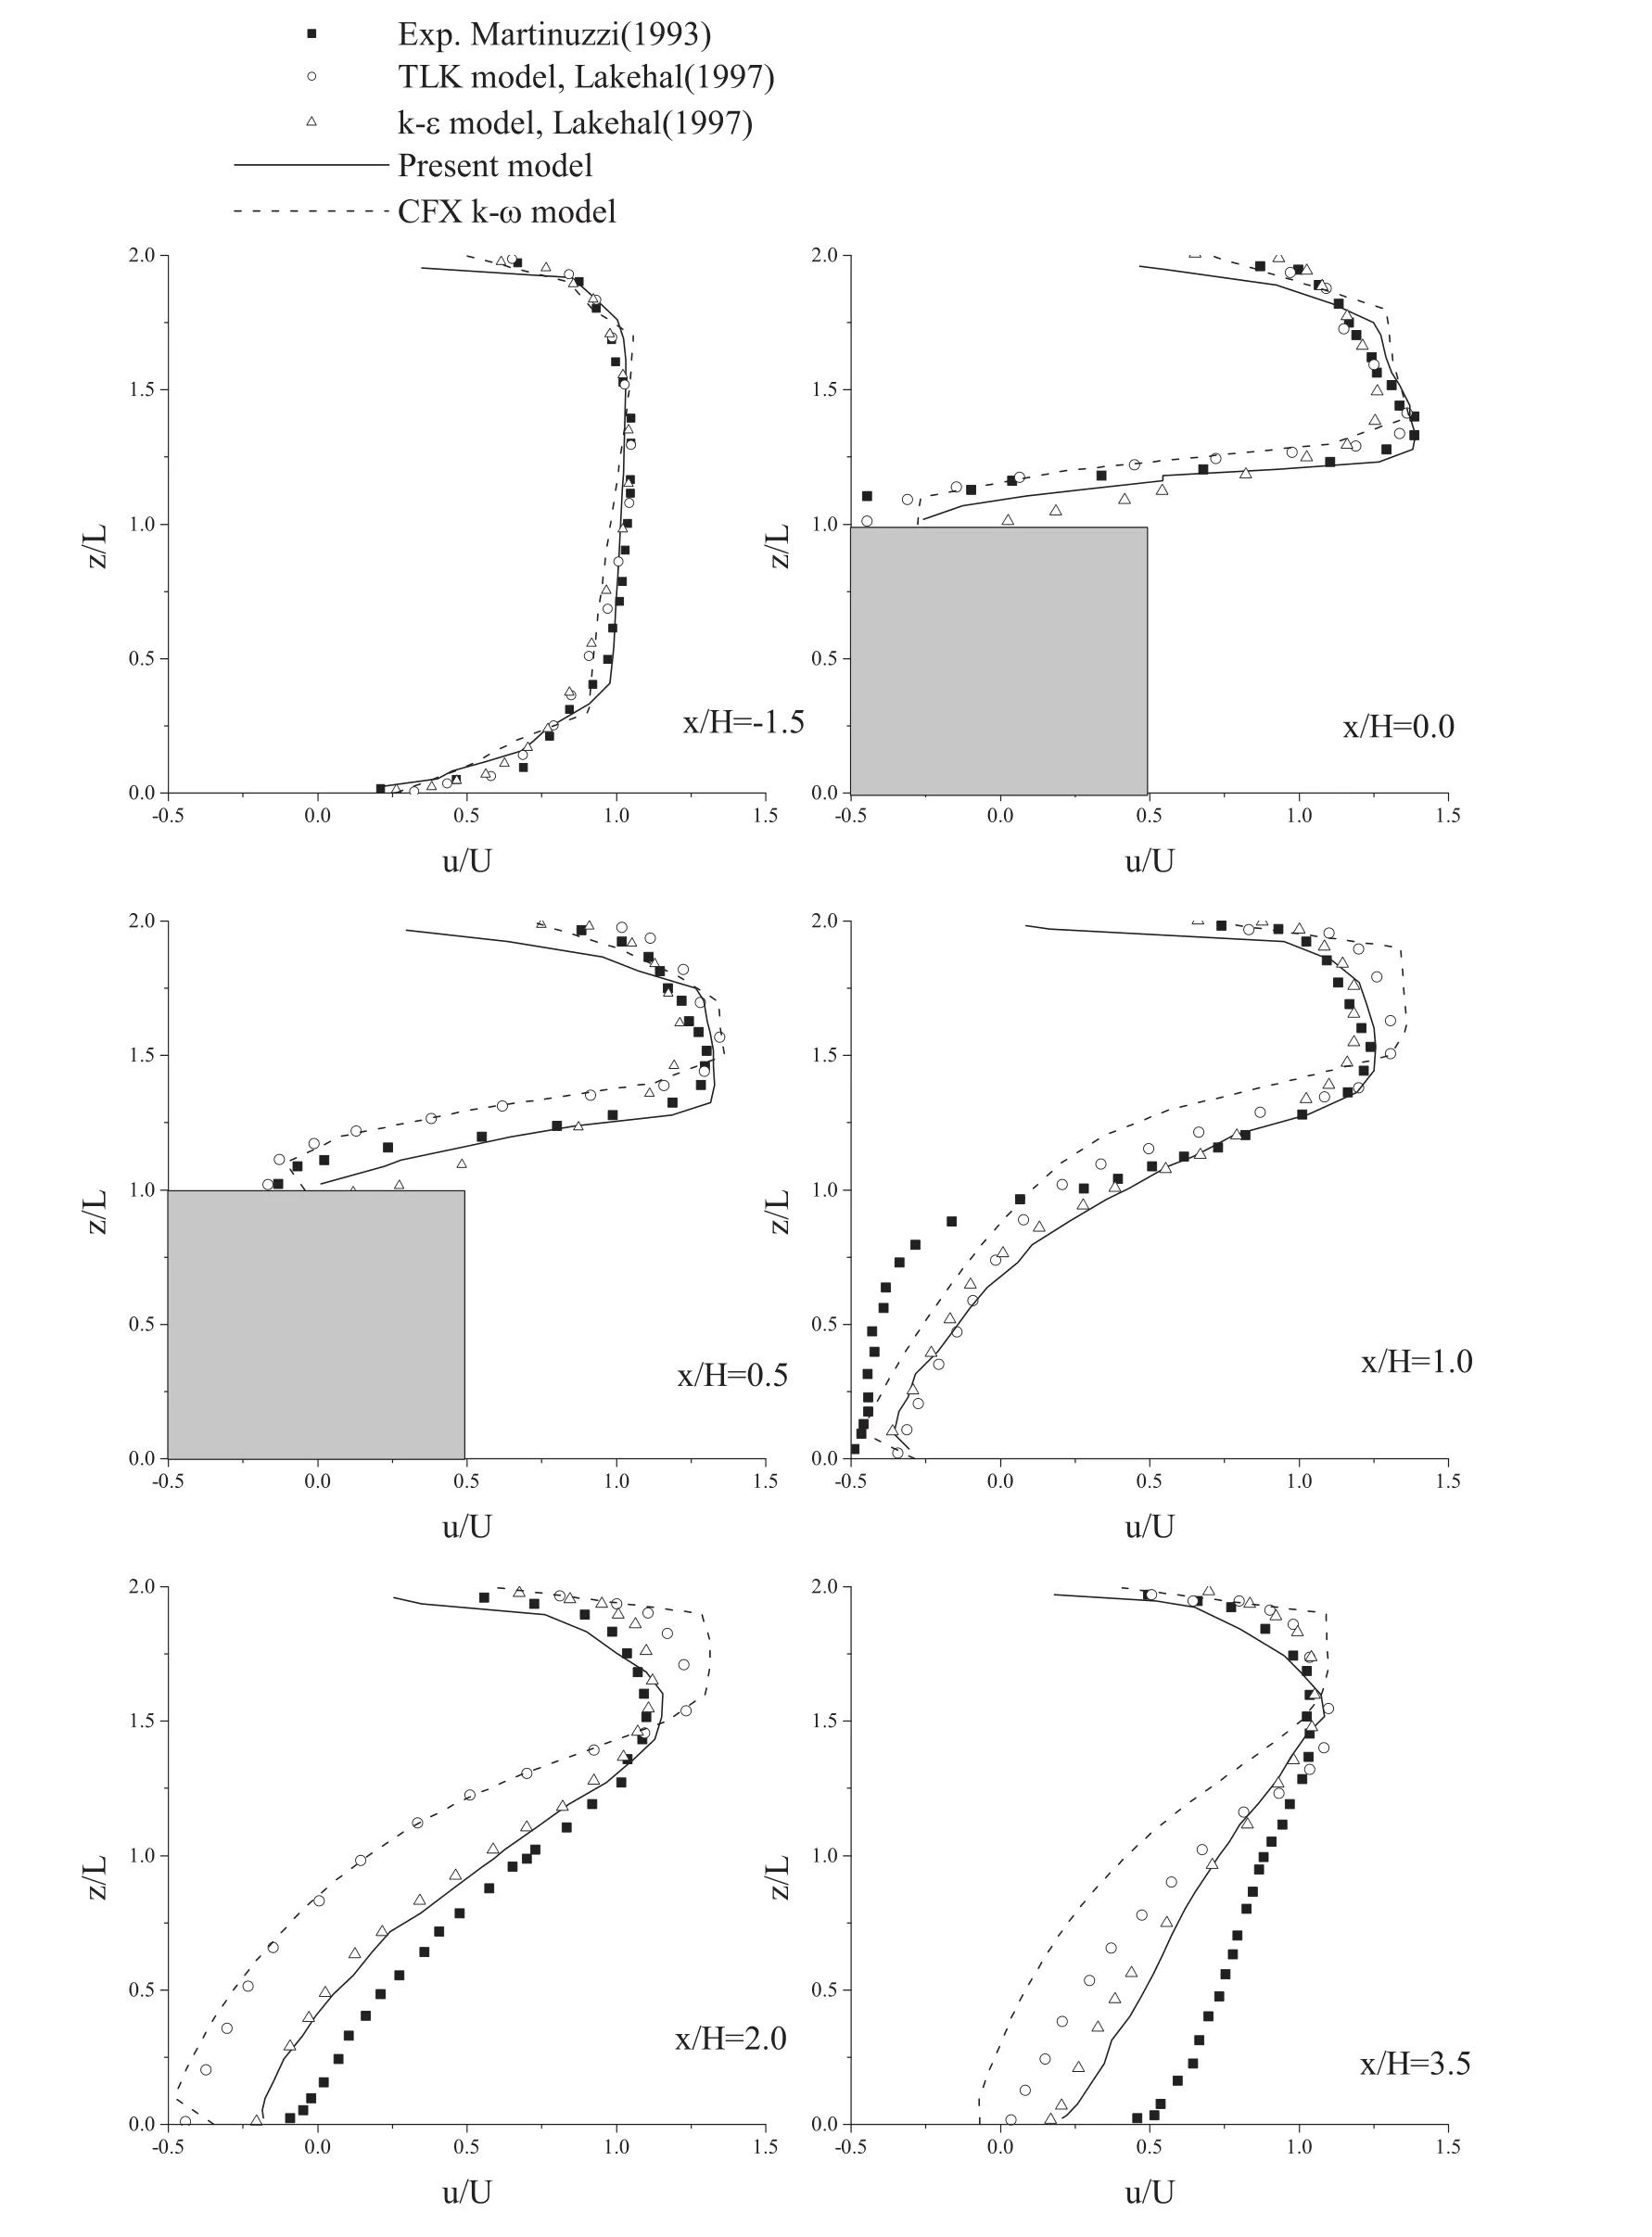
Fig. 10. Velocity profile in the symmetry plane.

Fig. 11. Streamlines in the plane y/H = 0: (a) the experimental result by Martinuzzi and Tropea [8] ; (b) the numerical result using k- εturbulence model by Lakehal and Rodi [7] ; (c) the numerical result using TLK turbulence model by Lakehal and Rodi [7] ; (d) the numerical result with k- ω turbulence model using CFX; (e) numerical result using the present model.
Fig. 13 plots an overview of the vortex structures in the vicinity of the cube with the 3-D stream traces while Fig. 14 plots the vortex structures with the Q-criterion. The iso-surfaces in Fig. 14 are plotted withQ= 0. 27 , which is the same value as in the circular cylinder case. In both Figs. 13 and 14 , a horseshoe vortex can be observed in the front bottom area of the cube. The stream traces indicates that the flow past the front corner will develop into the tornadolike vortex structures flowing past the bilateral surfaces of the cube. Another tornado-like vortex structure will emerge in the wake of the flow and it joins with the large reverse flow in the wake and forms an arc-like vortex structure, which can be seen more clearly in the iso-surfaces in Fig. 14 . At the top of the cube, the reverse flow from the wake will form a vortex structure as well.

Fig. 12. Definition of the vortex structure sizes in the ground-mounted cube case.

Fig. 13. 3-D stream traces in the vicinity of the ground-mounted cube.
4.3.3.Efficiencyofthepresentcode
The simulation results for the ground-mounted cube case suggest that the present model can better simulate such 3-D flow fields than the CFX software. The simulations are performed using the same fluid mesh, the same time step length and the same calculation environment. Both the simulation cases use 24 threads on a work station during the calculation and they are run for the same time steps. The CFX software is run for 3 h and 42 min while the present model is run for 2 h and 28 min to finish the simulation. The present numerical model can reduce the time needed for the flow field simulation by 33%. One reason for the discrepancy is that the commercial softwares usually do extra work to ensure the common use of the code while the present code only solves the cases with the fluid mesh that shares the same topology and no extra effort is needed to ensure the common usage of the code. Another reason is the computation cost reduction brought by the operator-splitting method. Table 2 compares the numerical results of the present model and CFX with the experimental results of Martinuzzi and Tropea [8] . Both the numerical simulations can correctly predict the size of the horseshoe vortex while the present model more precisely predicts the size of the large reverse flow region in the wake.Since the time cost of the present model is also smaller than that of CFX, it is safe to say that the present model can more effectively simulate such cases than the CFX.
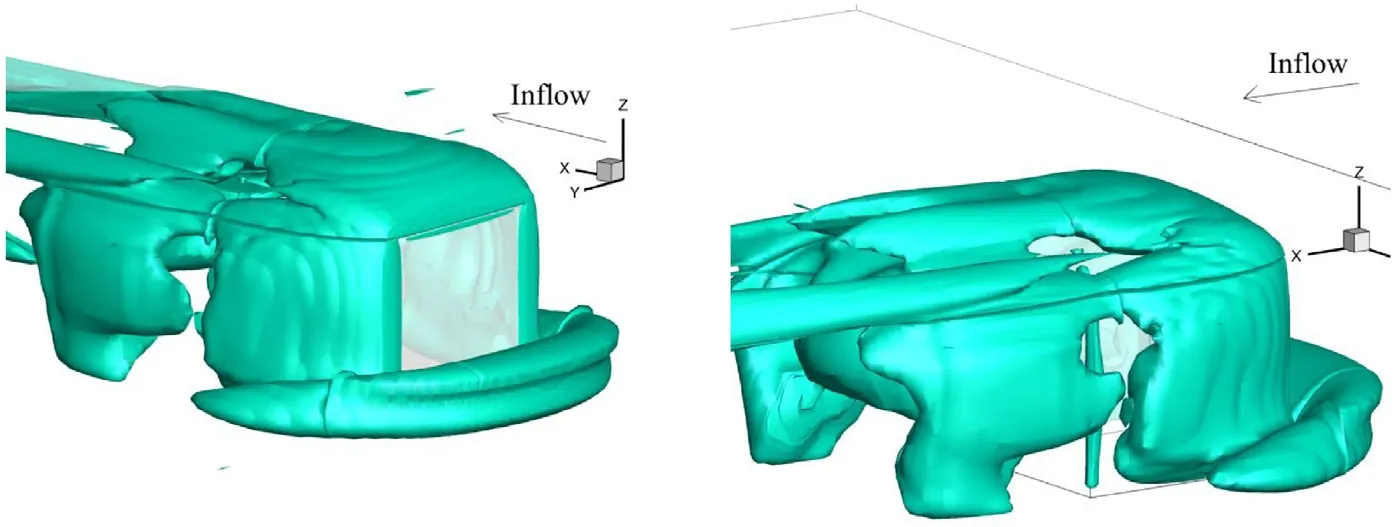
Fig. 14. The vortex structures in the vicinity of the ground-mounted cube plotted using the iso-surface with Q’ = 0.27.
Over all, the present model can provide satisfactory 3-D flow field simulations. Within the RANS model framework,the SST turbulence model solved with the TVD numerical method can correctly reflect the 3-D characters in the complex flow fields and the operator-splitting method can effectively reduce the computation cost. For these reasons, the present model is more competitive in effectively simulating the 3-D flow fields that contains a uniform cross-section. The effective reduction of the computation enables the the present code to efficiently simulate the flow fields for the structures with large aspect-ratios.
5.Conclusion
1. A 3-D hydrodynamic model based on the Navier-Stokes equations closed with the SST turbulent model that is solved with an operator splitting method and a TVD-FVM numerical method is put forward in the present work. The numerical model is specially built to effectively simulate the 3-D flow field around the structures that have large aspect ratios.
2. The precision conservation and the computation cost reduction of the operator splitting method is theoretically verified. The precision of the present model is validated by comparing the simulation results of two typical 3-D CFD cases with the classic experimental results and typical numerical results. In both the cases, the present numerical results better fit with the experimental data and the 3-D characters of the flow fields can be correctly captured. The computation cost reduction of the present model is validated by comparing the time cost of the present code with that of the commercial software CFX for simulating a same case. The comparison suggest that the present model can faster simulate the studied case and the simulation results better fit the experimental data.
3. Although the present model has been proved to be able to effectively simulate the 3-D CFD cases, the operatorsplitting method in this model is designed to simulate the fluid-structure interaction (FSI) problems. The computation cost of the present model can be further reduced in the FSI simulations when compared with the common 3-D numerical models since the moving fluid mesh nodes require more computation cost for solving the mesh element information while this process is much easier for the present model. In the future work, the present numerical model will be expanded to solve the FSI problems of the structures with large aspect ratios.
Acknowledgements
The authors are grateful to the financial support from the National Natural Science Foundation of China (Grant No.11372188 , 51490674 ), and the National Basic Research Program of China (973 Program) (Grant No. 2015CB25 1203).
 Journal of Ocean Engineering and Science2018年3期
- Journal of Ocean Engineering and Science的其它文章
- The influence of Thomson effect and inclined loads in an electro-magneto-thermoelastic solid with voids under green–Naghdi theories
- Oblique closed form solutions of some important fractional evolution equations via the modified Kudryashov method arising in physical problems
- Numerical study of self-adjoint singularly perturbed two-point boundary value problems using collocation method with error estimation
- Development and validation of a coastal ocean forecasting system for Puerto Rico and the U.S. virgin islands
- On application of three-dimensional linearized potential-flow model for shallow-water planing
- RANSE-based simulation and analysis of scale effects on open-water performance of the PPTC-II benchmark propeller
