RANSE-based simulation and analysis of scale effects on open-water performance of the PPTC-II benchmark propeller
Xiao-Qian Dong, Wei Li, Chen-Jun Yang , Francis Noblesse
Collaborative Innovation Center for Advanced Ship and Deep-Sea Exploration (CISSE), State Key Laboratory of Ocean Engineering (SKLOE), Shanghai Jiao Tong University, Shanghai 200240, China
Abstract This paper presents our numerical study of the scale effects on a tip-rake propeller, the PPTC-II, based on the RANS simulations using software FLUENT 6.3. The low Re option in SST k–ω model is adopted at model scale, together with fine prism grids to resolve the viscous sub-layer. At full scale, standard wall function is adopted. The scale-effect corrections yielded by our RANS simulations are compared with those obtained from the ITTC method. To explain the CFD results, an analysis of sectional forces is performed. To investigate how the tip rake influences propeller scale effects, the geometry of PPTC-II is modified by removing the tip rake only, and the RANS-predicted scale effects for the modified propeller, PPTC-II-m, are compared with those for the PPTC-II. The study indicates that the scale effect on propeller thrust can be as important as that on the torque; somehow the RANS- and ITTC-based predictions for full-scale efficiency agree quite well;the tip-rake reduces tip loading and tip vortex strength, and brings about large differences in the scale effects as compared with the propeller without tip-rake.)
Keywords: Propeller; Tip rake; Open water; Scale effect; RANSE.
1.Introduction
Theoretically, the scale effects on propeller open water performance need to be corrected for when predicting the powering performance of a ship. The empirical formulae in the 1978 ITTC Performance Prediction Method [1] (referred to as the ITTC method hereinafter) have been widely used for the correction. In the ITTC method the amounts of correction to model-scale thrust and torque coefficients depend on the model- and full-scale section drag coefficients at 0.75R, the chord and pitch ratios at the same radius, and the number of blades, whereRdenotes propeller tip radius. Apparently,the corrections would be the same for two propellers which differ in the skew and rake only. Special tip geometries, such as the tip endplates and tip-rake, are not accounted for in the ITTC method as well. For more accurate prediction of the full scale performance, it is necessary to know how and to what extent the geometric parameters not considered in the ITTC method would influence the results of scale effect corrections. To elucidate the problem and update the present ITTC method for correcting propeller scale effects when possible, the Propulsion Committees of the 27th and 28th ITTC initiated a computational campaign in each term of service using the PPTC, a conventional highly skewed propeller, and the PPTC-II, an unconventional propeller with the tip-rake,respectively. The two test cases were provided by SVA Potsdam, and the data are available to the public at the company’s website.

Fig. 1. The computational domain.

Fig. 2. Geometry of the sub-domain enclosing the back and face of adjacent blades.
In fact, viscous flow CFD simulation has been almost the only approach for the research of propeller scale effects since the last century [2] . The extensive laminar flow region at the Reynolds number of 2–3 ×10⁵is an issue which necessitates the use of very fine prism grid layers to resolve the viscous sub-layer and the lowReturbulence model at model scale [3,4] . It was found that the scale effects on propeller thrust and efficiency are underestimated by the ITTC method when compared with the RANS results, especially for highly skewed propellers [4] . Alternative extrapolation formulae for propeller open water performance were proposed via analysis of RANS simulation results [5] , where the thrust loading,skew, and the changes in magnitude and direction of section force were taken into account in addition to the geometric parameters considered in the ITTC formulae. The comparison for one test case shows that the CFD-based formulae predicts the increments in thrust and efficiency from modelto full-scale are larger than those predicted by the ITTC method.
Propellers with special tips may present new challenges to the ITTC method for predicting propeller scale effects. It was found through CFD simulations that the scale effects on the Kappel and CLT propellers are larger than those on conventional propellers [6] . More recently, the RANS approach was employed in selecting optimal endplates of the CLT propeller[7] . Besides, the RANS tool was also utilized in the scale effect researches for ducted propellers [8] and the rudder bulb[9] .
This paper presents our numerical study of the scale effects on a tip-rake propeller, the PPTC-II, based on the RANS simulations using software FLUENT 6.3. The lowReoption in SSTk–ω model is adopted in model scale, together with fine prism grids to resolve the viscous sub-layer. At full scale,standard wall function is adopted. The scale-effect corrections yielded by our RANS simulations are compared with those obtained from the ITTC method. To explain the CFD results, an analysis of sectional forces is performed. To investigate how the tip rake influences propeller scale effects,the geometry of PPTC-II is modified by removing the tip rake only, and the RANS-predicted scale effects for the modified propeller, PPTC-II-m, are compared with those for the PPTC-II.
2.Numerical modeling approach
2.1. Governing equations
The flow around the propeller working in open water is simulated by solving the RANS equations together with the SSTk–ω model for turbulence closure. The continuity and momentum transport equations for an incompressible fluid are written as

Fig. 3. Zoom-up view of blade-surface prism layer grids.
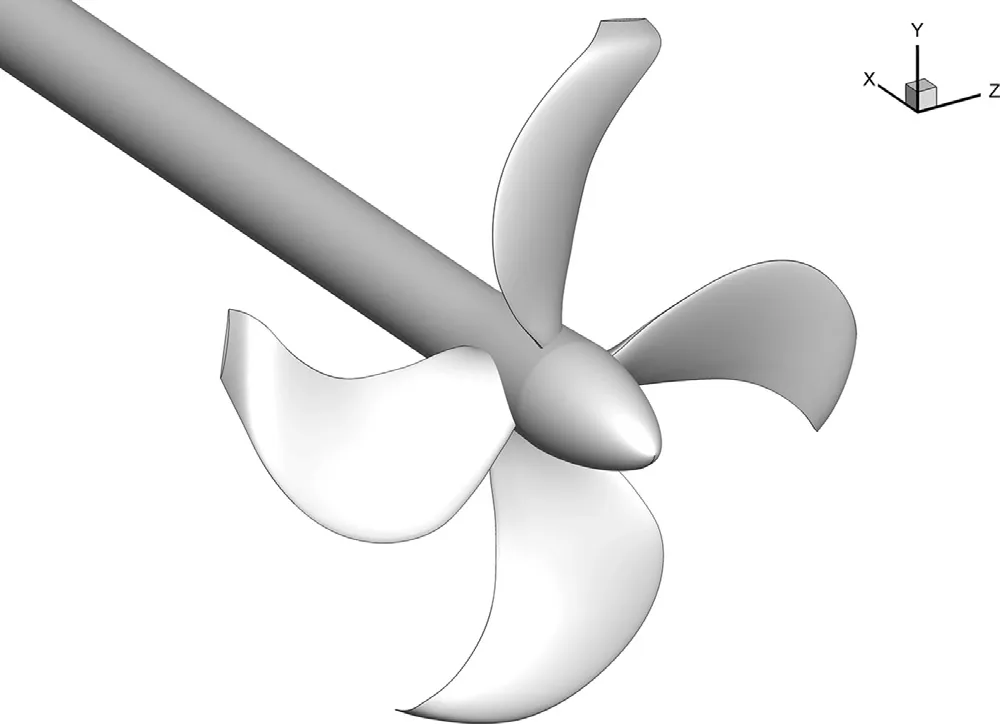
Fig. 4. Geometric model of propeller PPTC-II.

Table 1 Geometric particulars and operating conditions of propeller PPTC-II at model- and full-scale.


whereuianduj(i,j= 1, 2, 3) are the velocity components,pis the static pressure, μis the dynamic viscosity of water,δijis the Kronecker delta, and −is the Reynolds stress.The transport equations of the SSTk–ω model are written as wherekis the turbulence kinetic energy, ω is the specific dissipation rate,GkandGωdenote the generation ofkand ω,respectively, Γkand Γωdenote the effective diffusivity ofkand ω, respectively,YkandYωdenote the dissipation ofkand ω due to turbulence,Dωis the cross-diffusion term,YkandYωare user-defined source terms.
2.2. Computational model and setup

Fig. 5. RANSE-predicted open water performances of PPTC-II at model- and full-scale.

Fig. 6. Comparison RANS- and ITTC-predicted scale effects on the open water performance of PPTC-II.

Fig. 8. Comparison of the pressure component of section normal forces for PPTC-II.
The governing equations are solved numerically by means of FLUENT 6.3, a CFD software package based on the finite volume method. Since flow in open water is assumed to be steady and periodic for all blades in the coordinate system fixed to the propeller, a single blade passage suffices for the simulation. As illustrated in Fig. 1 , the computational domain is a portion of the cylinder which is coaxial with the propeller shaft. It is bounded by a pair of periodic surfaces which pass through the shaft axis and make an angle of 360/Zdegrees, whereZis the number of blades. The inlet and outlet of the domain are 5Dupstream and 10Ddownstream of the propeller, whereDis the propeller diameter. The radial size of the domain is 10D. As shown in Fig. 2 , the periodic boundary surfaces pass through the leading and trailing edges of adjacent blades, hence the back and face of the adjacent blades, instead of the same blade, become boundaries of the domain. By doing so, prism layer grids of high quality can be generated easily on blade surfaces, as shown in Fig. 3 . Using the SSTk–ω model for turbulence closure, the boundary layer flow is resolved down to the viscous sub-layer at model scale, while the wall function is adopted at full scale. The wall distance averaged over blade surfaces,y+, ranges 0.64–1.12 at model scale, and 32–62 at full scale. All the boundary surfaces are discretized via triangular grids, while the space outside the prism layers is discretized via tetrahedral cells. To reduce numerical uncertainties, blade surface grids are geometrically similar at both scales, only the thicknesses of the prism layers are adjusted. The total number of cells is about 4.38 million at both scales.
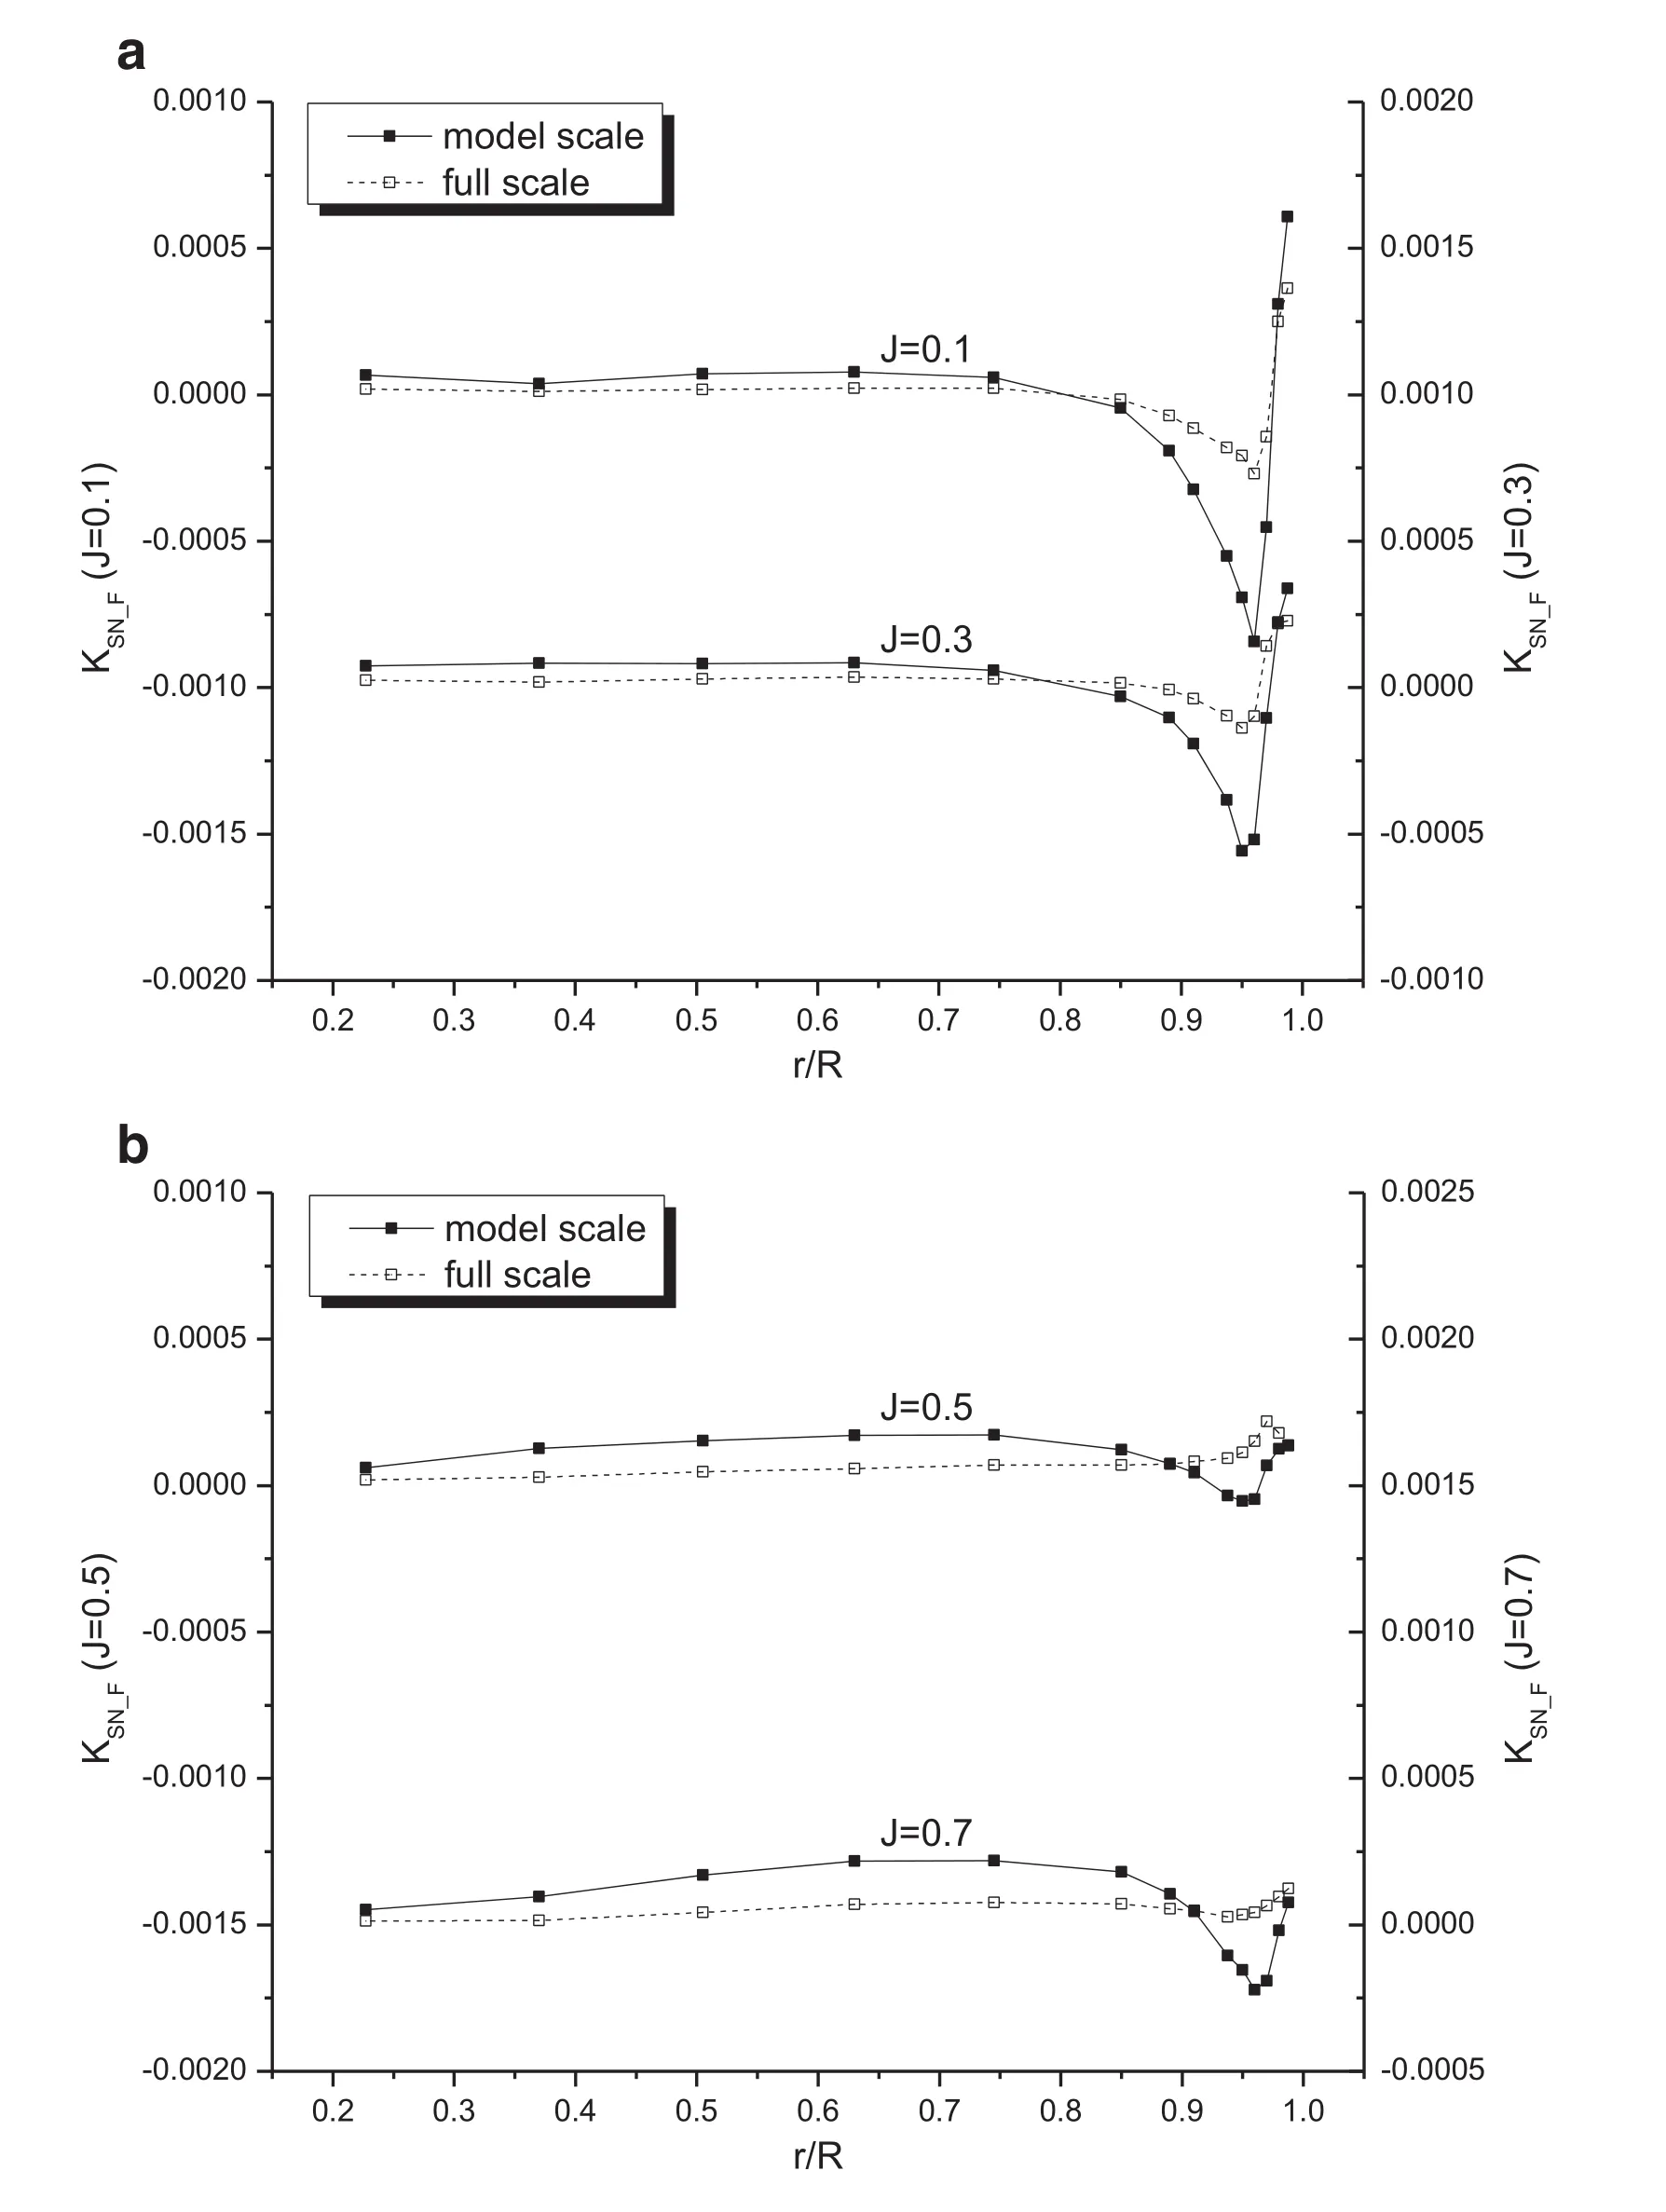
Fig. 9. Comparison of the frictional component of section normal forces for PPTC-II.

Fig. 11. Comparison of the pressure component of section chordwise forces for PPTC-II.
The blade, hub, and shaft surfaces are set as stationary noslip walls in the rotating frame. As shown in Fig. 1 , the inlet and far boundary are set as velocity inlets, while the outlet as the pressure outlet. For a fixed rotation speed of the propeller,the inlet velocity is specified according to the desired value ofJ, the advance coefficient.
The convection terms in all the governing equations are discretized with 2nd-order upwind schemes. The SIMPLE scheme is employed for velocity-pressure coupling.
3.Results and discussions
As shown in Fig. 4 , the PPTC-II is a four-bladed propeller with a large tip rake. Its geometric data are provided by SVA Potsdam and available in the public domain. The geometric particulars as well as operating conditions of propeller PPTCII at model- and full-scale are listed in Table 1 .

Fig. 12. Comparison of the frictional component of section chordwise forces for PPTC-II.
3.1. Scale effects on open water performance
Fig. 5 compares the model- and full-scale open water performances of the PPTC-II predicted by CFD, as well as the model-scale EFD data by SVA Potsdam. Except forJ= 0.1 andJ= 0.9, the CFD results agree well with EFD data.As is well known, the full-scale efficiency is higher than the model-scale one. However, the increase in full-scale efficiency is largely due to the increase in thrust atJ= 0.1–0.5; atJ= 0.7, it is due to the increase in thrust and the decrease in torque, and the latter becomes more important as blade loading decreases.

Fig. 13. Relation of the axial and circumferential forces to the normal and chordwise forces of a blade section.
The ITTC-1978 method is also employed to predict the full-scale performance of PPTC-II by using the RANS results at model-scale. Fig. 6 compares the RANS- and ITTC-predicted scale effects on the open water performance. According to the ITTC method, the increase in full-scale efficiency is mainly due to the decrease in torque. On the contrary, the RANS results indicate that, at full scale, the thrust increases by 2–3% (see Fig. 6 (a)), however, the torque changes little except forJ= 0.7 (see Fig. 6 (b)). Amazingly,the increases in full-scale efficiency predicted in both methods differ by less than 0.5% (see Fig. 6 (c)).
3.2. Analysis of sectional forces
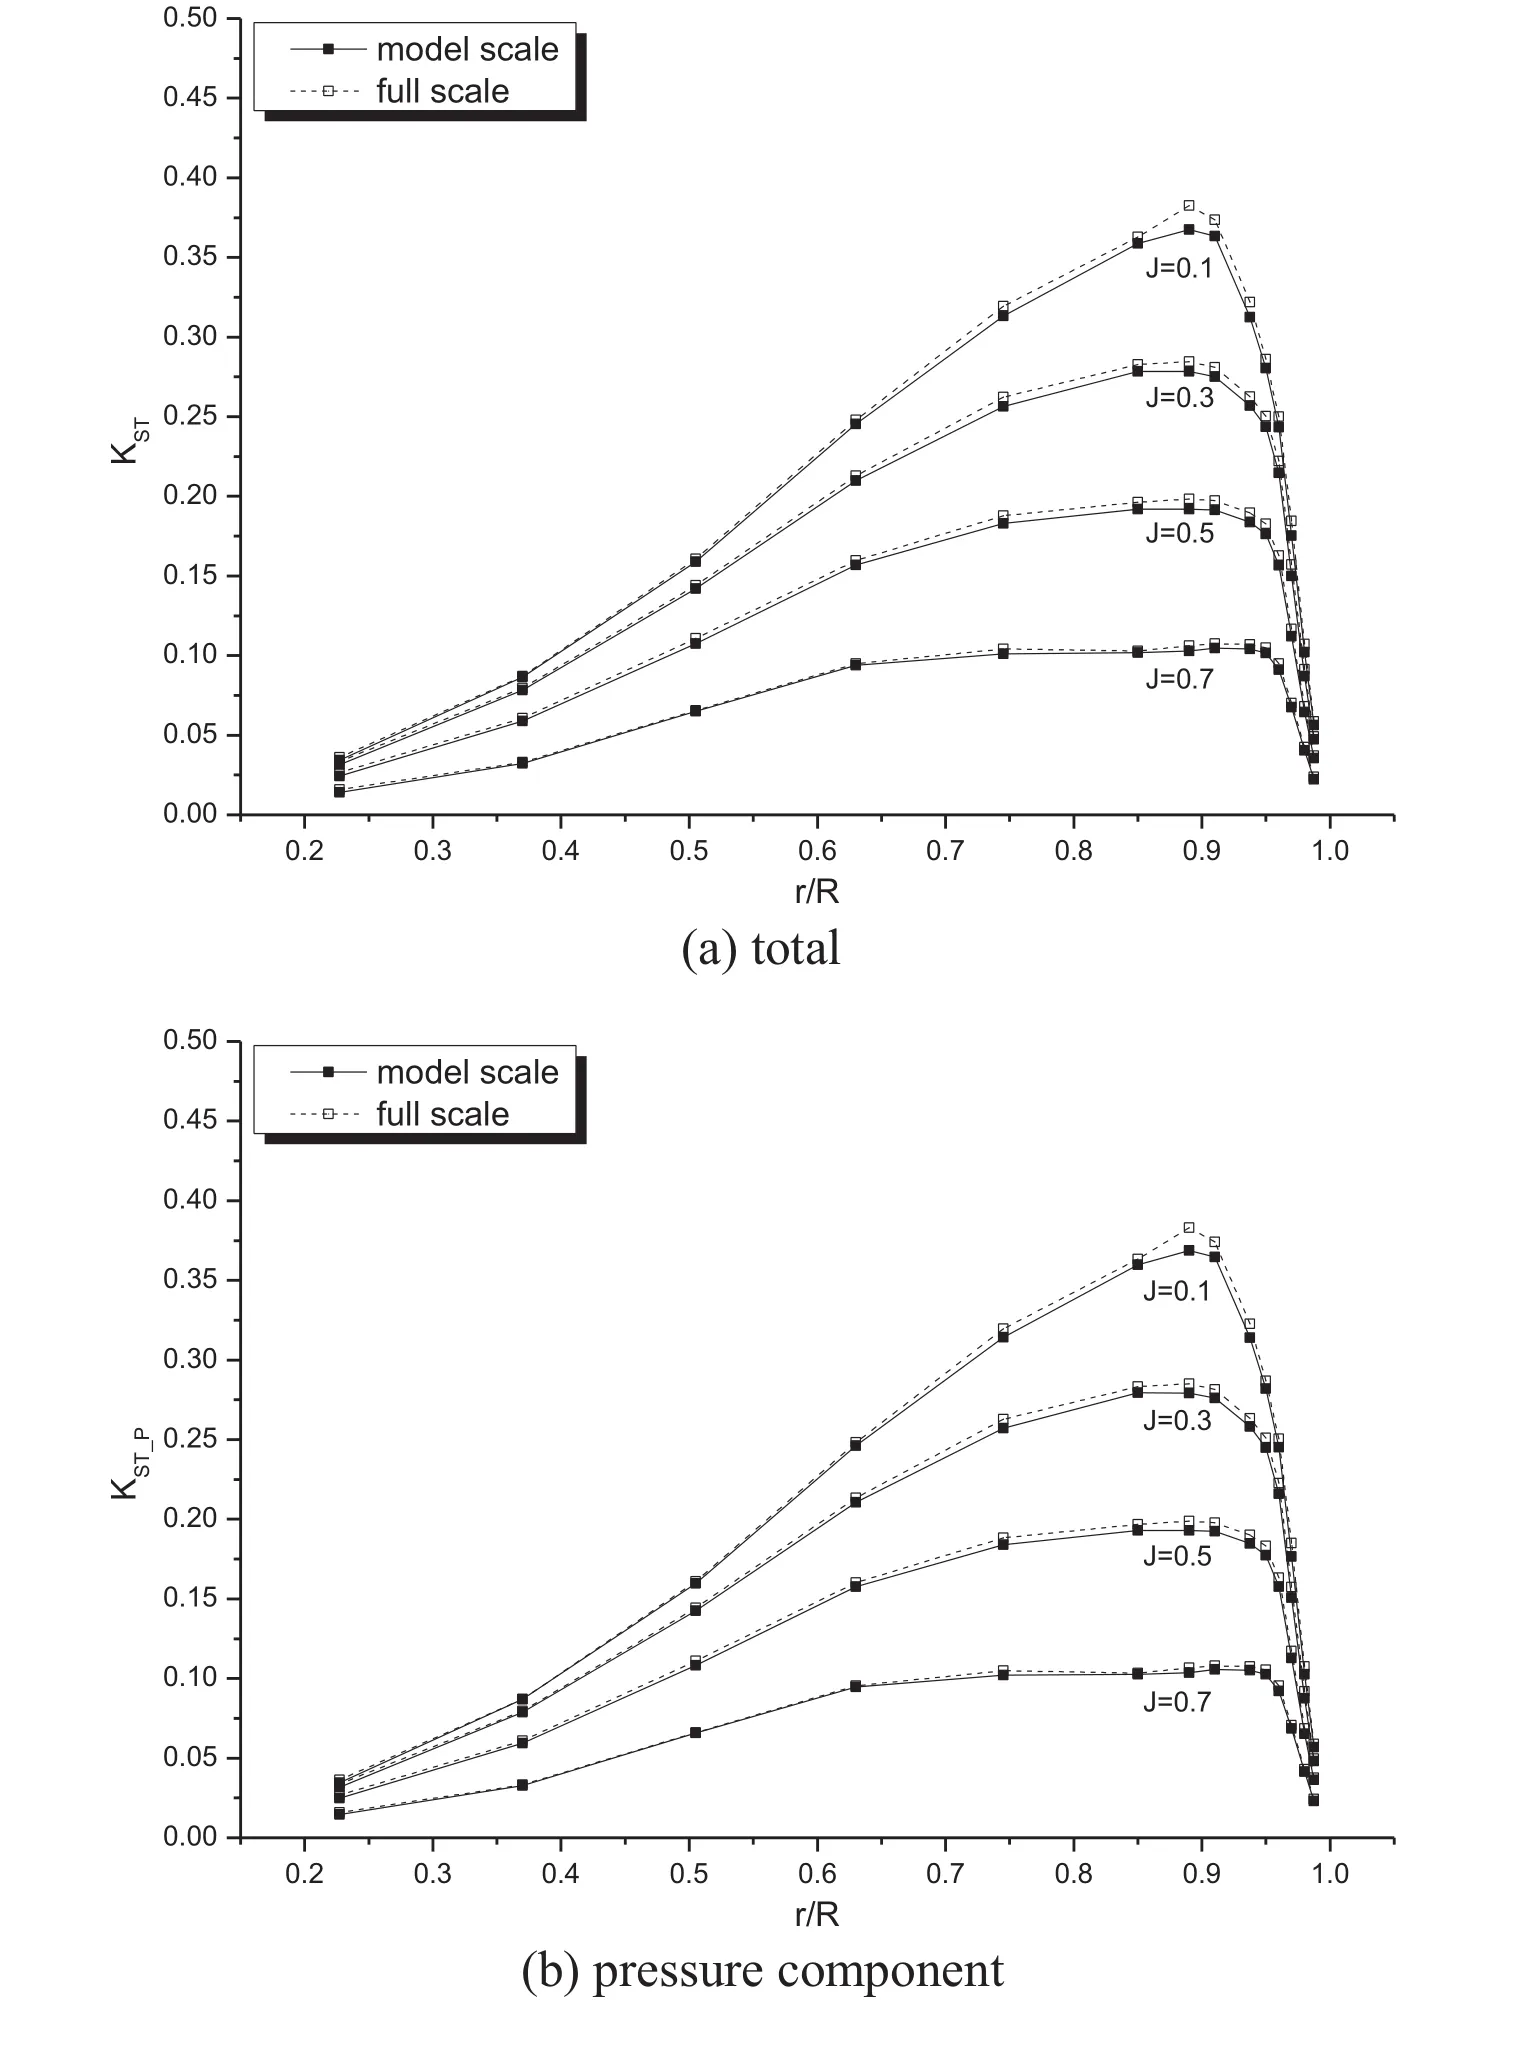
Fig. 14. Comparison of section axial (thrust direction) forces for PPTC-II.
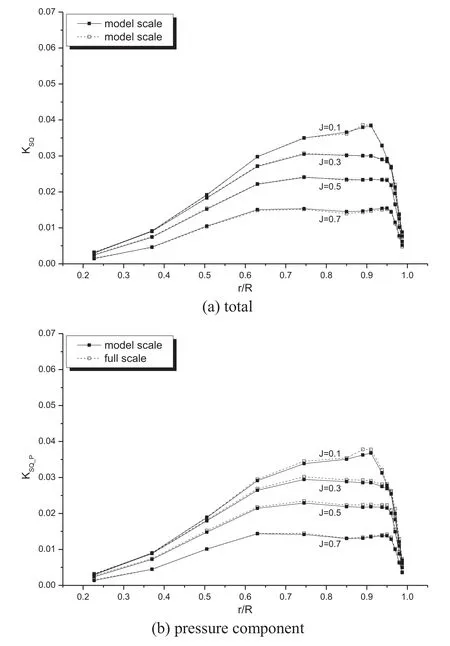
Fig. 15. Comparison of section circumferential (torque direction) forces for PPTC-II.
To find out whether the present CFD results can be explained from the physics of flow, and if there are other factors which influence the scale effects in addition to the drag coefficient, an analysis of hydrodynamic forces is conducted on a sectional basis for propeller PPTC-II. The pressure and frictional forces on a blade section are projected onto directions normal and tangential to the nose-tail line and named as section normal and chordwise forces, respectively.Figs. 7 –9 compare the model- and full-scale normal force coefficients,KSN,KSN_P, andKSN_F, where the subscriptsPandFdenote pressure and frictional forces, respectively. Similarly,the chordwise force coefficients are denoted byKSC,KSC_P,andKSC_F, respectively, and the results at model- and fullscale are compared in Figs. 10 –12 . All the sectional forces are non-dimensionalized byn2D3, wherenandDare the rate of revolution and the diameter of the propeller, respectively,and ρis the density of water.

Fig. 16. Geometric model of propeller PPTC-II-m.
As seen in Fig. 7 , the section normal forces increase at full scale mainly at outer radii over the range of loading conditions investigated. Looking further at Figs. 8 and 9 , it is obvious that the increase in normal force is primarily due to the pressure component. It is inferred that the section angle of attack becomes larger at full scale due to reduced differences in the displacement thicknesses of boundary layers on the back and face.
Fig. 10 shows that the section chordwise forces decrease at full scale from root to tip over the range of loading conditions investigated. It is clear from Figs. 11 and 12 that this result is almost solely due to the decrease in the frictional force.
A further discussion can be made on how the changes in section normal and chordwise forces due to the scale effect influence those in propeller thrust and torque. As illustrated in Fig. 13 , the axial (thrust direction) and circumferential (torque direction) force coefficients of a blade section are expressed as

where φis the geometric pitch angle of the blade section.
According to the results shown in Figs. 7 –12 , the scale effects onKSN_FandKSC_Pcan be neglected. Then

where Δdenotes the difference of full- and model-scale values. Since ΔKSN_P> 0 and ΔKSC_F< 0, it is clear that ΔKST> 0, as shown in Fig. 14 ; however, the sign of ΔKSQdepends on the magnitudes of ΔKSN_Pand ΔKSC_F, as well as the pitch angle. But the contribution of ΔKSN_Palways cancel out that of ΔKSC_Fto some extent, as shown in Fig. 15 .Thus the analysis explains the reasons for the scale effects on propeller thrust and torque shown in Fig. 5 .
The present CFD results and analysis indicate that it might be necessary to take into account the scale effect on the thickness of blade surface boundary layer. Then the predicted scale effect can be equally important for both thrust and torque, or even primarily for the thrust.
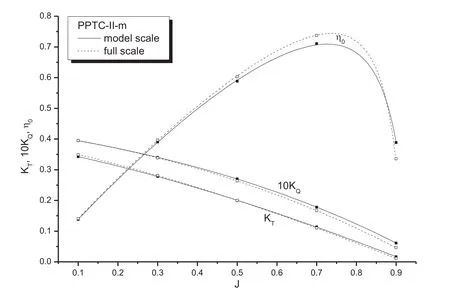
Fig. 17. RANSE-predicted open water performances of PPTC-II-m at model- and full-scale.

Fig. 18. Comparison of RANS-predicted scale effects on the open water performances of PPTC-II and PPTC-II-m.
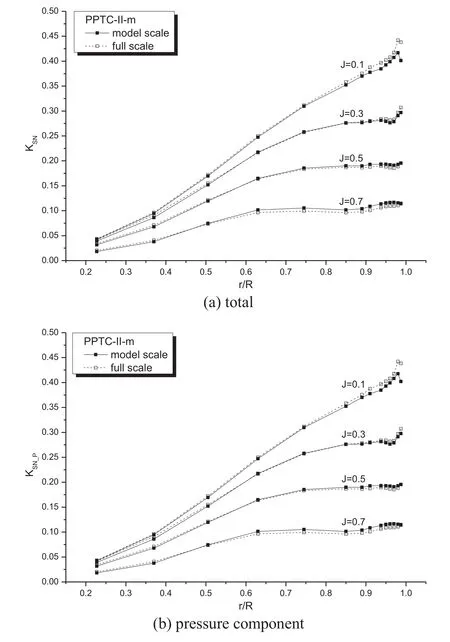
Fig. 19. Section normal forces for PPTC-II-m.
3.3. Influence of tip-rake on scale effects
The PPTC-II is a propeller with the tip rake that is meant to load the tip (hence increase the efficiency) without creating strong tip vortices. It would be interesting to make a comparison of the scale effects on propellers with and without the tip rake. Therefore, the blade geometry of PPTC-II is modified by removing the tip rake, but keeping all the other geometric parameters untouched. The new propeller is named as PPTC-II-m, and the RANS simulations are carried out for it by using identical modeling approach and operating conditions to those for the PPTC-II. Fig. 16 shows the geometric model of the PPTC-II-m.

Fig. 20. Section chordwise forces for PPTC-II-m.
Fig. 17 compares the open water performances yielded by RANS simulations for the PPTC-II-m at model- and fullscale, which are quite close to those for the PPTC-II except for extremely high/light loading conditions (J= 0.1 andJ= 0.9).
Fig. 18 compares the scale effects on propeller thrust,torque, and efficiency for the PPTC-II and PPTC-II-m based on RANS simulation results. As seen in Fig. 18 (a) and (b), in light loading conditions (J= 0.5 andJ= 0.7), there are large differences between PPTC-II and PPTC-II-m in the scale effects on propeller thrust and torque. Fig. 18 (c) shows that the scale effect on propeller efficiency is generally larger for PPTC-II than for PPTC-II-m by 0.5–1%.
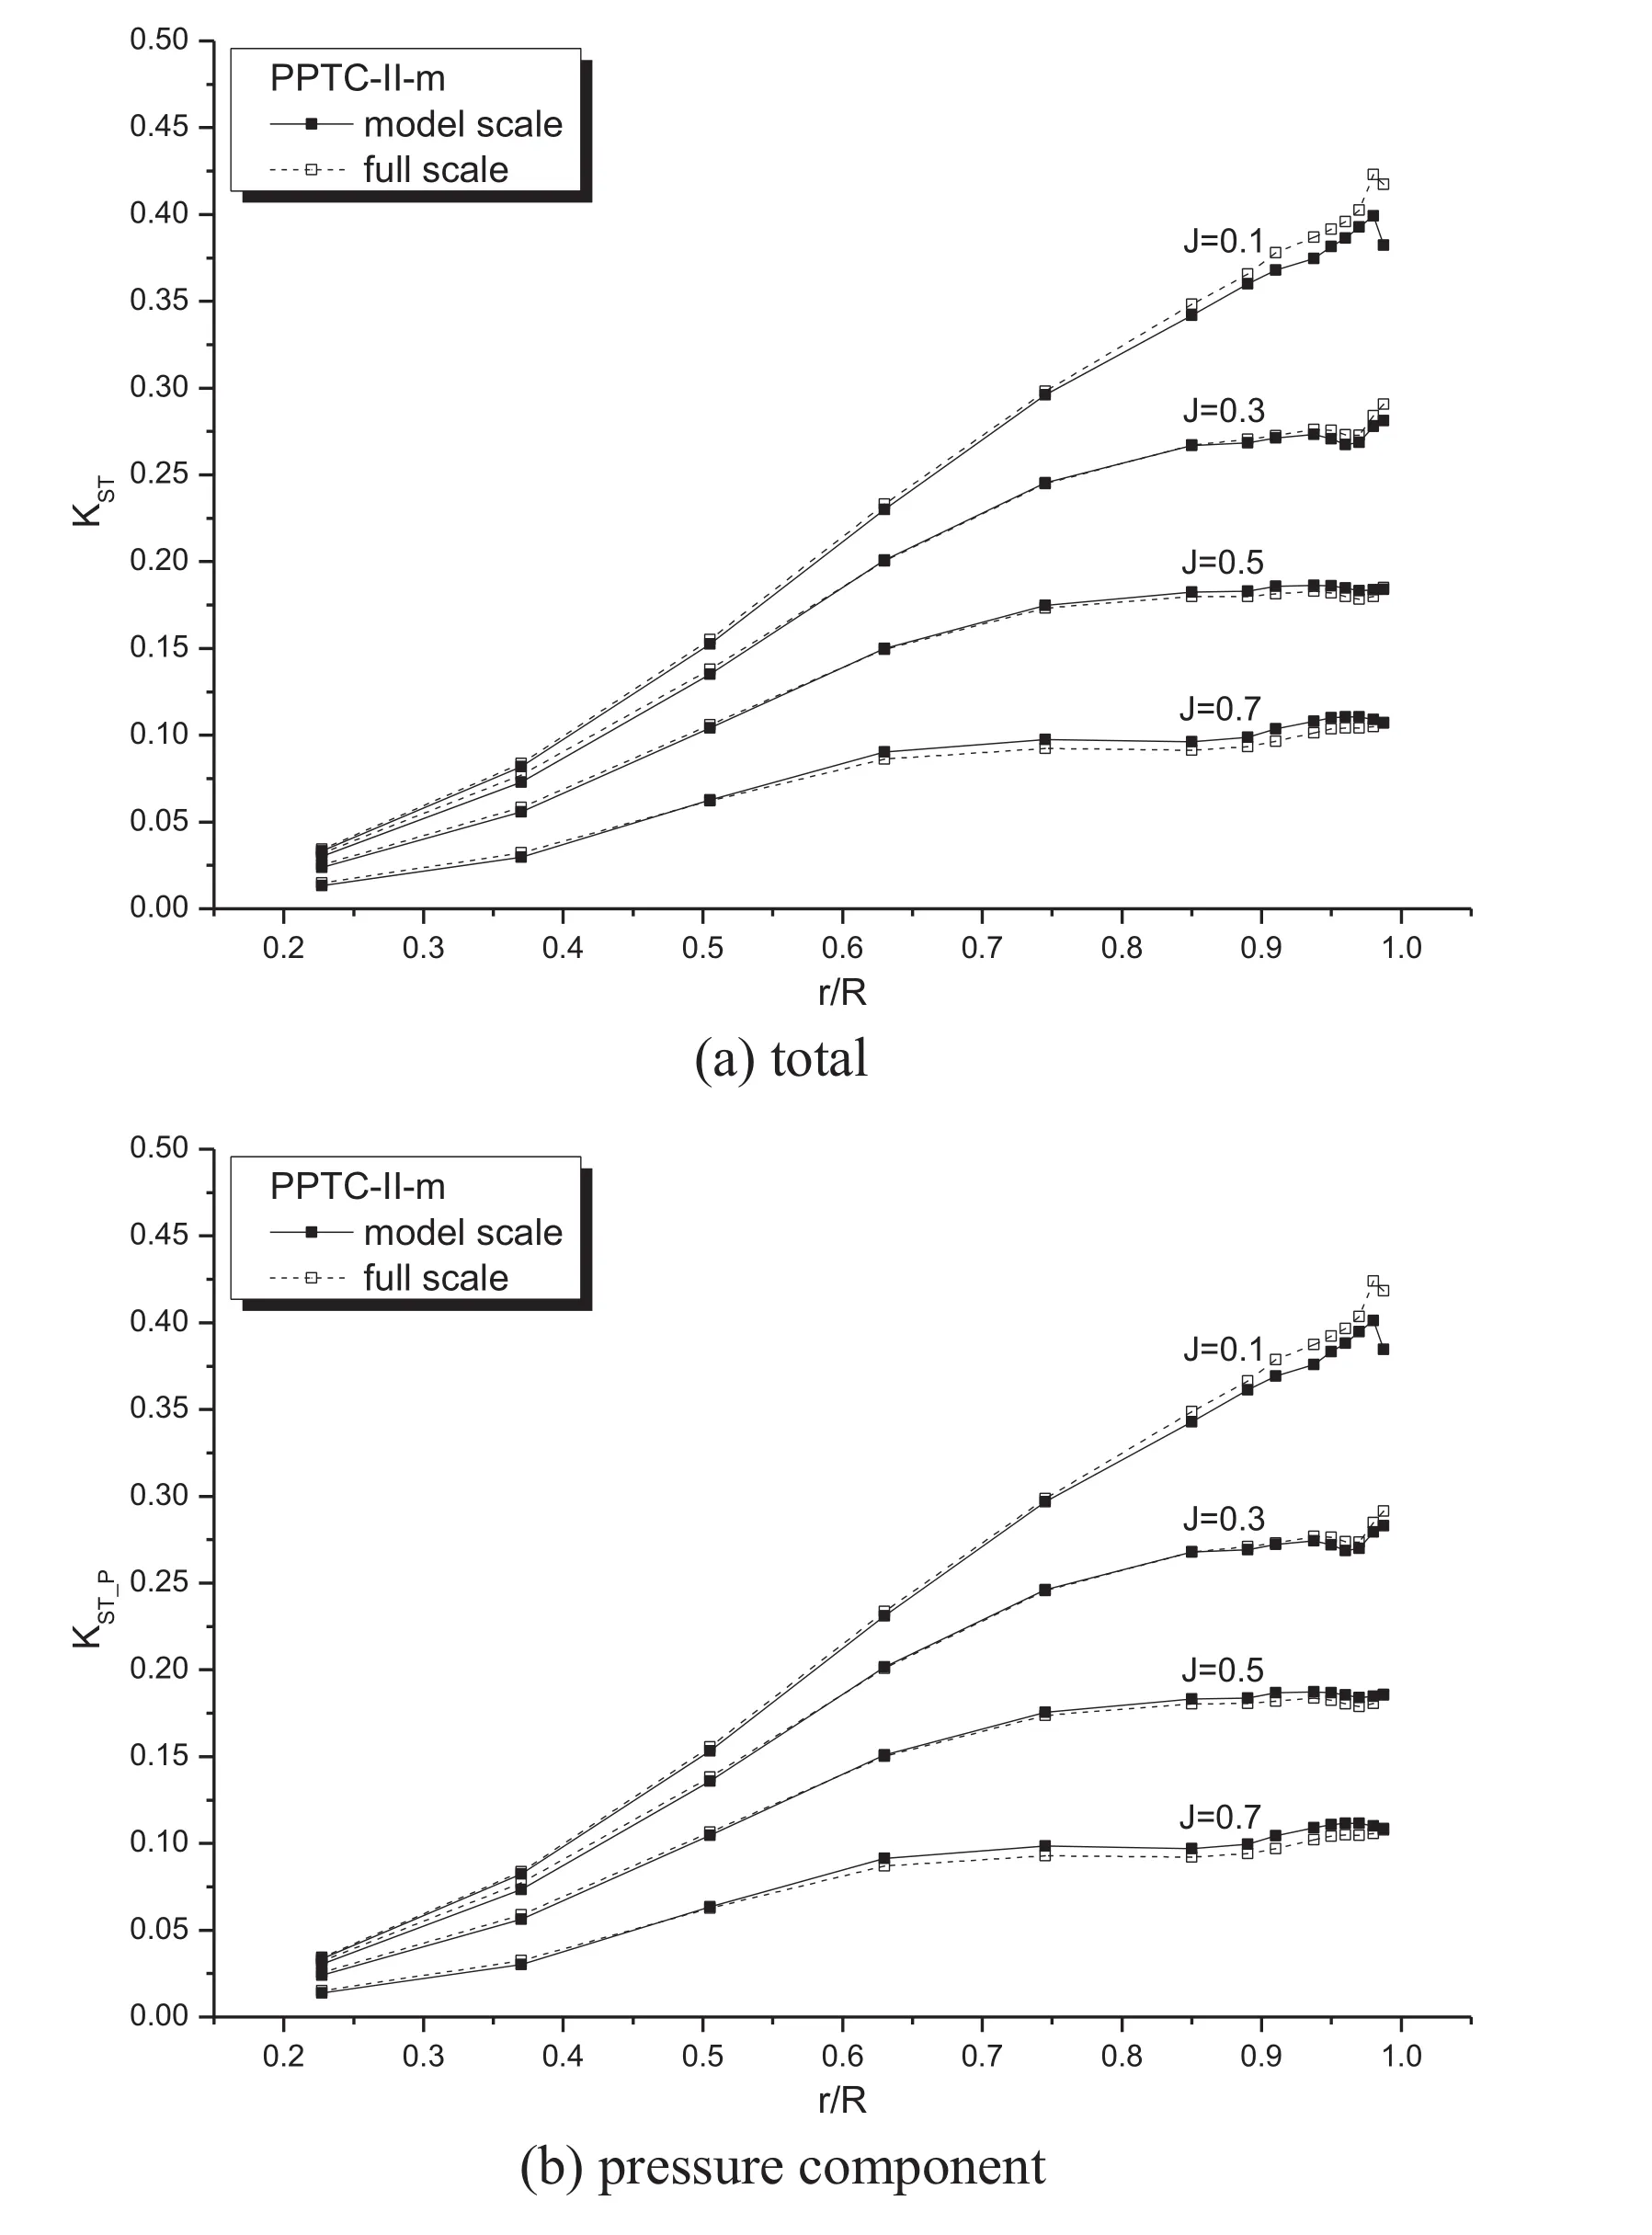
Fig. 21. Comparison of section axial (thrust direction) forces for PPTC-II-m.
Figs. 19 and 20 show the results of sectional force analysis for propeller PPTC-II-m. By comparing Fig. 19 (a) and (b) it is obvious that the frictional force contributes little to the section normal force, which is the same as for the PPTCII. However, as shown in Fig. 19 (b), ΔKSN_Pdecreases from positive to negative value asJincreases. Fig. 20 (a) and (b)indicate that, the frictional force is not the only contributor to the decrease of chordwise force at full scale, especially close to the tip, which is different from the results for PPTCII (see Figs. 10 and 11 ), but it is still the main contributor.So we can use the same method (formula ( 4 )) to analyze the scale effects on axial and circumferential forces. The decrease of ΔKSN_Presults in ΔKSTand ΔKSQdecreasing positive to negative value asJincreases, as shown in Figs. 21 and 22 ,which explains the results atJ= 0.5 andJ= 0.7 for PPTCII-m in Fig. 18 (a) and (b).

Fig. 22. Comparison of section circumferential (torque direction) forces for PPTC-II-m.

Fig. 23. RANS-simulated pressure fields in the cross section 0.005 D downstream of the trailing edge of tip. PPTC-II, J = 0.7.
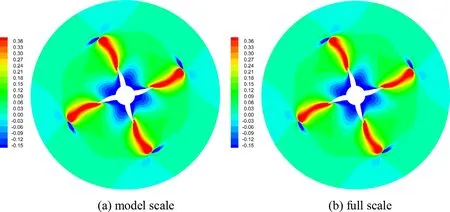
Fig. 24. RANS-simulated pressure fields in the cross section 0.005 D downstream of the trailing edge of tip. PPTC-II-m, J = 0.7.
Besides, as shown in Figs. 19 and 20 , the monotonic increase in section normal force as well as the sharp increase in section chordwise force close to the tip are both different from the case of PPTC-II. The tip rake actually reduces the loading close to the tip, especially when the angle of attack is small. By comparing Figs. 23 and 24 , the pressure fields in the cross sections immediately downstream of the tip trailing edge, it is clear that the tip vortices of PPTC-II are much weaker (due to reduced tip loading) than those of PPTC-II-m.
Finally, the scale effects predicted by the ITTC method are compared with those by RANS simulations in Fig. 25 .Similar to the comparison made for the PPTC-II in Fig. 6 ,the differences between ITTC and RANS results are large forKT, but relatively small forKQ. The ITTC-predicted increases in the full-scale efficiency of PPTC-II-m are still quite close to the RANS predictions, but are all higher than the latter.
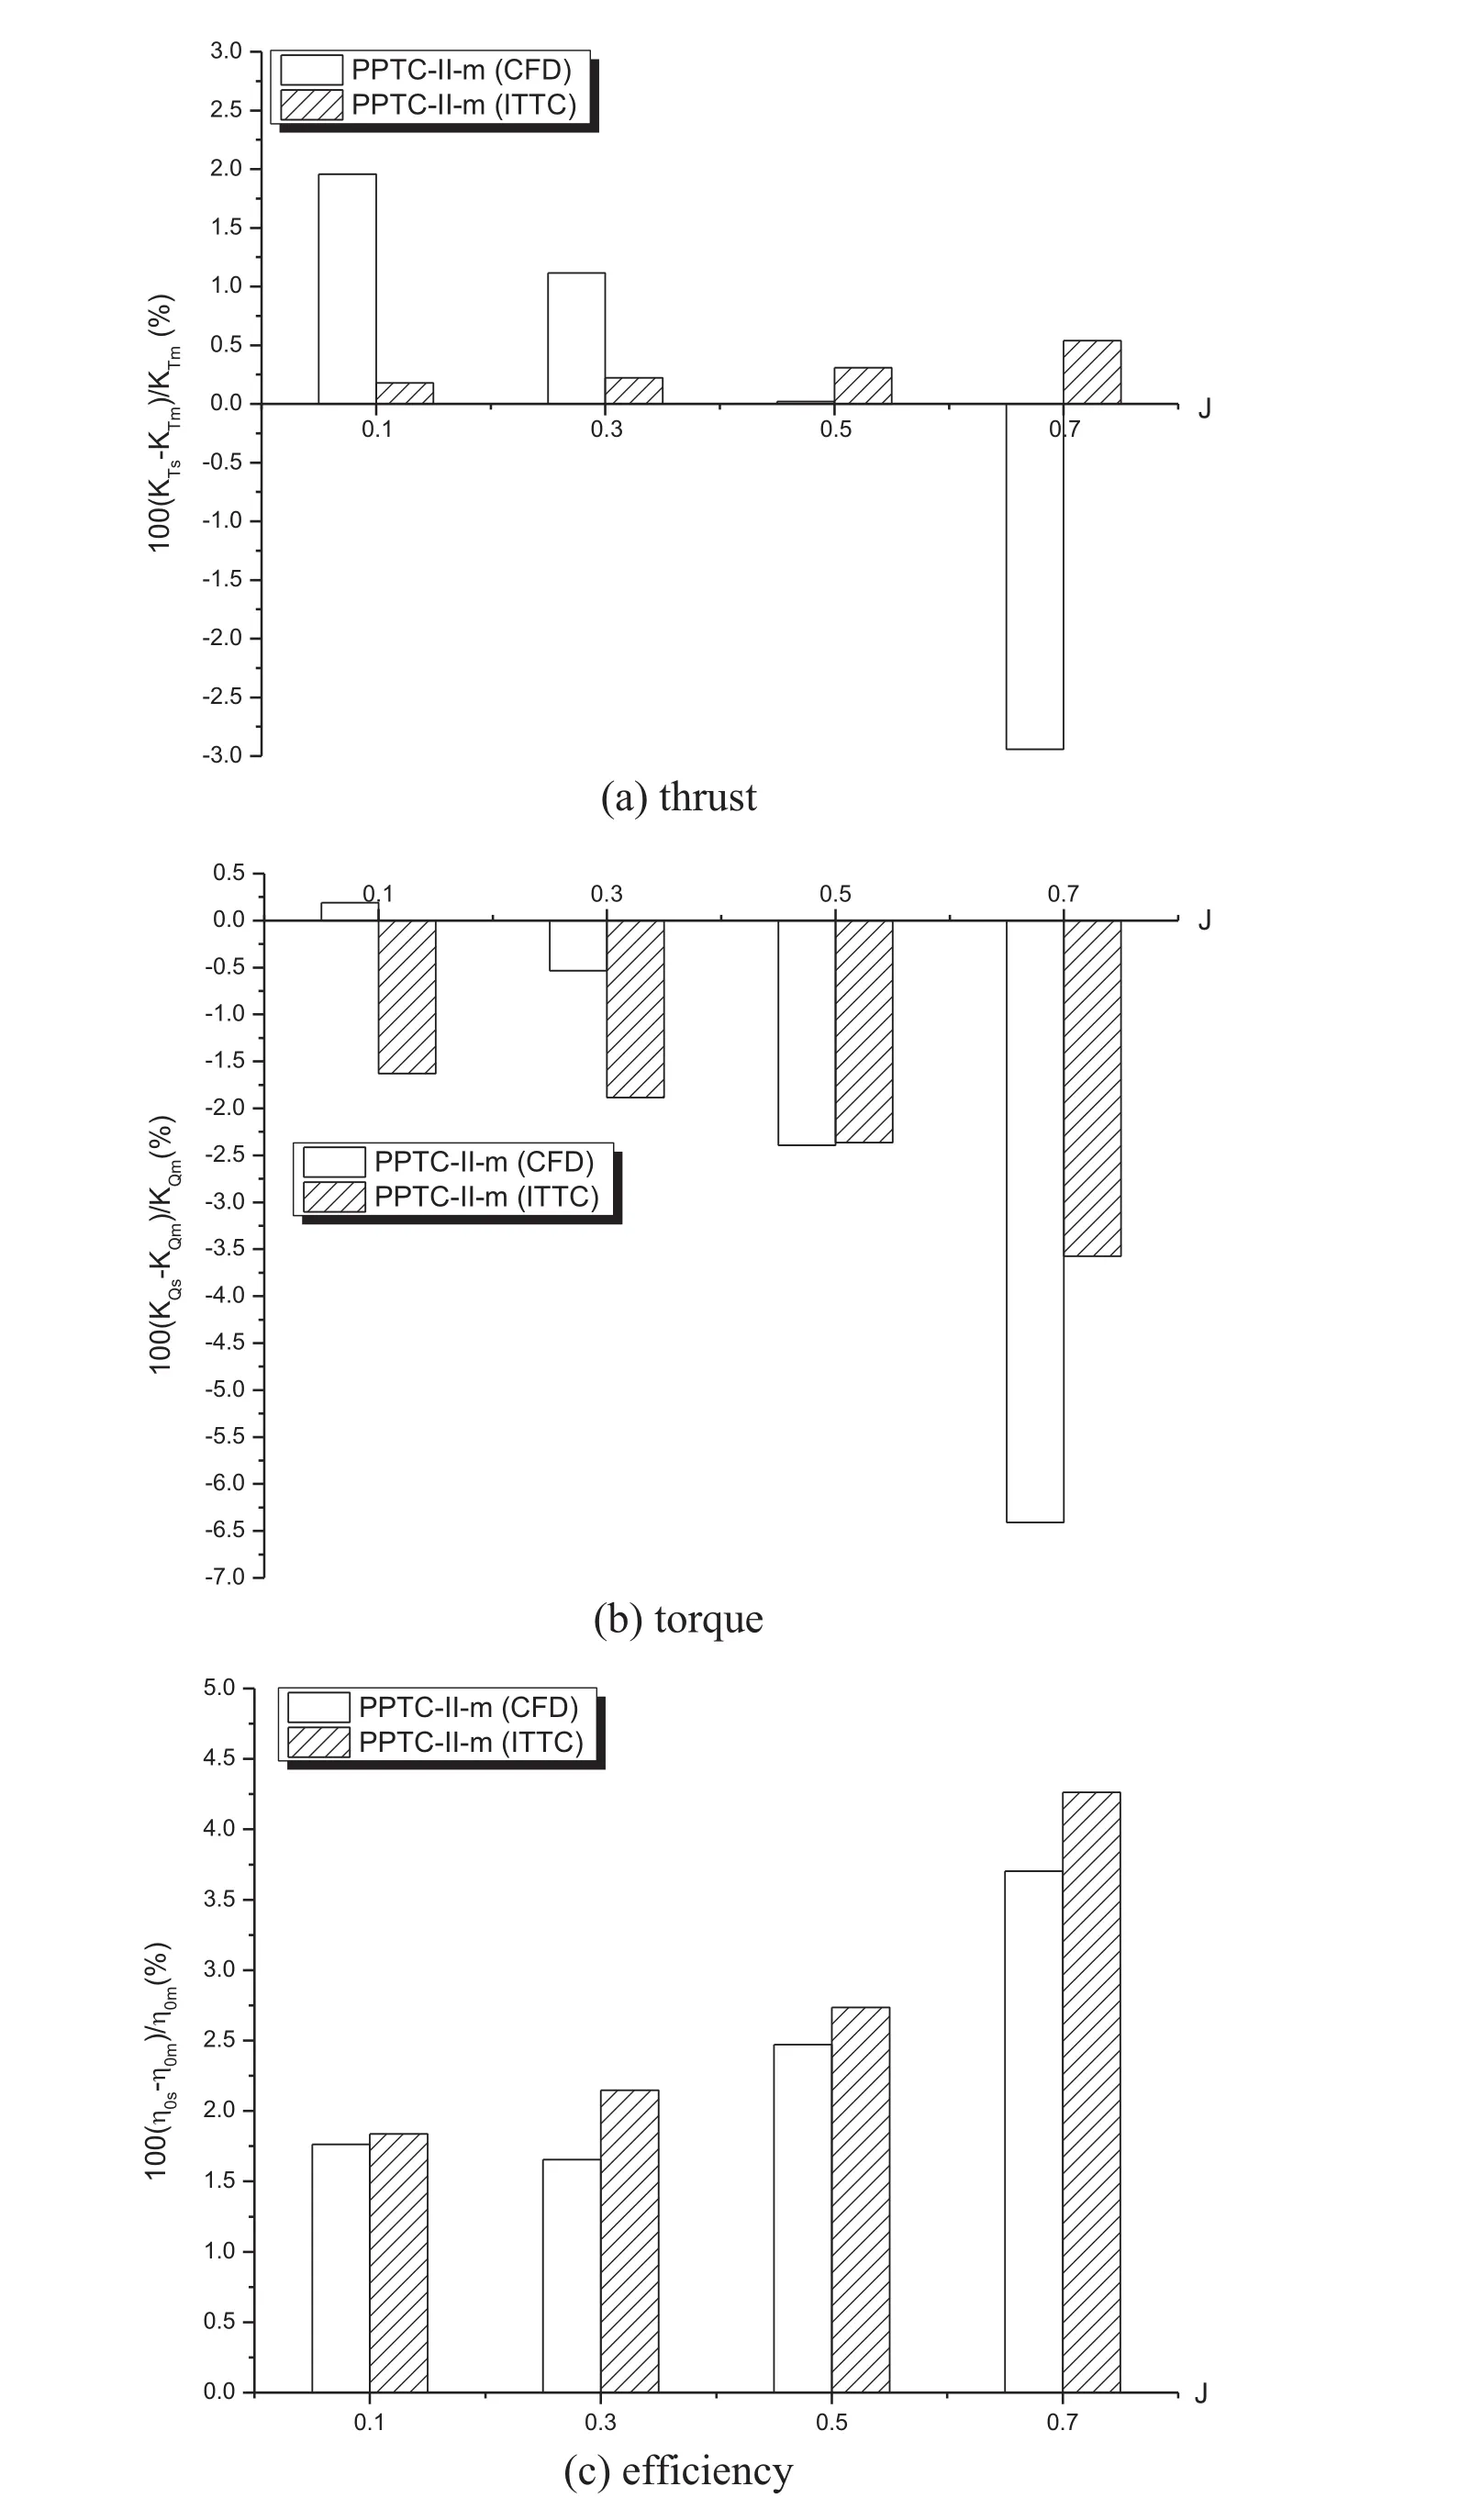
Fig. 25. Comparison of RANS- and ITTC-predicted scale effects on the open water performance of PPTC-II-m.
4.Conclusions
Based on the RANS simulations, the scale effects on propeller open water performance have been numerically studied for PPTC-II, an ITTC benchmark propeller, and PPTC-II-m,a modified version of the PPTC-II by removing the tip rake.By analyzing the RANS-based blade section forces, and comparing the scale effects predicted by RANS with those by the ITTC-1978 method, the following conclusions are drawn,
(1) The scale effect on propeller thrust can be as important as that on the torque, which seems to be the result of reduced boundary layer thickness on full-scale blade surfaces. On the contrary, the scale effect correction forKTis one magnitude smaller than that forKQaccording to the ITTC method.
(2) Although the corrections forKTandKQby the ITTC method differ largely from those by the RANS method,the corrections for η0by the two methods agree quite well at least in the cases of PPTC-II and PPTC-II-m.Further investigations are necessary to find out if this is just a coincidence.
(3) The tip rake serves to reduce the hydrodynamic loading close to the tip. At small angle of attack where the propeller is designed to work, large differences in the scale effects onKTandKQare identified with and without the tip rake, but not on η0. To account for the tip rake and predict the scale effects onKTandKQmore accurately, the existing ITTC method might need to be updated.
 Journal of Ocean Engineering and Science2018年3期
- Journal of Ocean Engineering and Science的其它文章
- An integral panel method for the hydrodynamic analysis of hybrid contra-rotating shaft pod propulsors
- Efficient three-dimensional high-resolution simulations of flow fields around cylinders
- On application of three-dimensional linearized potential-flow model for shallow-water planing
- Development and validation of a coastal ocean forecasting system for Puerto Rico and the U.S. virgin islands
- Numerical study of self-adjoint singularly perturbed two-point boundary value problems using collocation method with error estimation
- Oblique closed form solutions of some important fractional evolution equations via the modified Kudryashov method arising in physical problems
