
Cultivated-land change in Mu Us Sandy Land of China before and after the first-stage grain-for-green policy
2018-09-07 06:46NaLiChangZhenYanJiaLiXieJianXiaMa
Na Li , ChangZhen Yan, JiaLi Xie, JianXia Ma
Northwest Institute of Eco-Environment and Resources, Chinese Academy of Sciences, Lanzhou, Gansu 730000, China
ABSTRACT Mu Us Sandy Land (MUSL) of China, as a typical eco-fragile and farming-pastoral transitional region, shows great vulnerability to disturbances from cultivation activity. In this region, the conflict between cultivation activity and environmental protection has not attracted great importance until the implementation of China's Grain-for-Green Policy (CGGP) since 2000. Here, using Landsat5 TM/Landsat7 ETM+ images from 1990, 2000, and 2010, we monitor the cultivation activity and land-use/cover changes (LUCC) resulting from cultivation activity in the MUSL region. Based on the data from images, we developed a series of databases of cultivated activity-induced LUCC and use them to discuss comparatively the spatio-temporal evolution trends of cultivation activity before and after CGGP implementation. These results provide evidence for managers to evaluate the implementation effectiveness of governmental policy and the influence of cultivation activity on the ecological environment of the MUSL region.
Keywords: Mu Us Sandy Land; China's grain-for-green policy; cultivated land; land-use/cover change; landsat
1 Introduction
As one of four major sandy lands of China, Mu Us Sandy Land (MUSL) is an important ecological barrier of northern China and belongs to a typical farming-pastoral transitional zone (Feng et al., 2013;Liang and Yang, 2016). During the past decades, due to shortage of grain and lack of other economic opportunities, farmers in the MUSL region had to convert numerous tracts covered with vegetation such as forest, shrub, and steppe into cultivated land (Hao and Wu, 2006). With cultivated land being one of the dominant land uses, there is no question that these land use/cover changes (LUCC) resulting from cultivation activity could be returned to the natural vegetation by gratifying increases of local grain and income.These changes can also induce environmental damage and loss of ecosystem equilibrium due to the fact that, in this region, the ecological environment shows serious vulnerability to (even small) disturbances from cultivation (Deng et al., 2006; Yan et al., 2009)and mining (Li et al., 2015). In this region, the contradiction between human activity and environmental protection has not gained great importance until the initiation of China's Western Development Strategy(CWDS). Considering that the increase of farmers' income and environmental protection are two of the most important components of CWDS, the well-known China's Grain-for-Green Policy (CGGP) is designed along with CWDS initiation, to shift low-yield cultivated lands back to the natural vegetation, e.g., forest,shrub, and/or steppe (Feng et al., 2005; Wang et al.,2007; Zhou et al., 2009; Rodríguez et al., 2016). The first CGGP implementation stage started in 3 provinces (Sichuan, Shaanxi and Gansu) as pilots in 1999, extended rapidly to 17 provinces in 2000 cover-ing the entire region of MUSL, and ended in 2013.Comparative analysis of the evolution of cultivation activity and LUCC due to human activity before and after the first-stage CGGP implementation is vital for local managers to evaluate the influence of this specific human activity on the ecological environment and the implementation effectiveness of CGGP in such a typical eco-fragile region.
Remote sensing (RS) images obtained over long periods provide unique opportunities to monitor the spatio-temporal LUCC in a broad region (Seto et al.,2002; Atzberger, 2013; Anees et al., 2014; Robert et al., 2015; Liang and Yang, 2016; Wang et al., 2016).Previous research has focused on ecological environmental problems in the MUSL region based on the RS technique (Luk, 1983; Wu and Ci, 2002; Runnström,2003; Hao and Wu, 2006; Li et al., 2015). For example, Runnström (2003) studied the degradation of the dry semiarid ecosystems in MUSL from 1978 to 1996 by monitoring the variabilities of grassland biomass production and reclamation activity. Subsequently, Hao et al. (2006) studied the effects of LUCC on desertification in the MUSL region between 1985 and 2000 and found that the conversion of grassland/forestland to cultivated land accelerated desertification development. Recently, Li et al. (2015) estimated the spatio-temporal evolution of mining activity in the MUSL region during the implementation periods of CWDS (2000-2013) by monitoring LUCC resulting from mining activity. However, there lacks a systematic study on the evolution of cultivation activity and LUCC due to this activity before and after the first-stage CGGP, which ended in 2013.
In the present work, we acquired Landsat5 TM/Landsat7 ETM+ images from three dates (1990,2000, 2010) covering symmetrically two 10-year periods, before (1990-2000) and after (2000-2010) CGGP implementation. Based on these images, we studied the spatio-temporal evolution of cultivation activity and LUCC due to this specific human activity in the MUSL region during the periods between these years (1990-2010).
2 Study area
The MUSL region is located in Northwest China,between 37°27'N-40°22'N and 106°20'E-111°30'E with a total area of 48,300 km2(Figure 1). As described in Li et al. (2015), the study area includes all of Ejin Horo and Uxin, the southwestern part of Jungar Banner, and eastern parts of Otog and Otog Qian(belonging to Inner Mongolia Autonomous Region);the northeastern part of Yanchi (belonging to Ningxia Hui Autonomous Region); the northwestern part of the sandy area in Yuyang District and Shenmu County, the northern part of the sandy area in Dingbian, Jingbian, and Hengshan (belonging to Shanxi Province) (Figure 1). Information on typical land use/cover types were extracted from Landsat7 ETM+images for 2000. Most of the study area is occupied by semi-mobile and semi-fixed sand dunes, along with fixed sand dunes widely distributed in this area(Yan et al., 2005; Zhang et al., 2015). The ecosystem of the study area is fragile, such that a small disturbance from unreasonable human activity will cause rapid emergence and development of desertification,and thus impact local sustainable socioeconomic development.
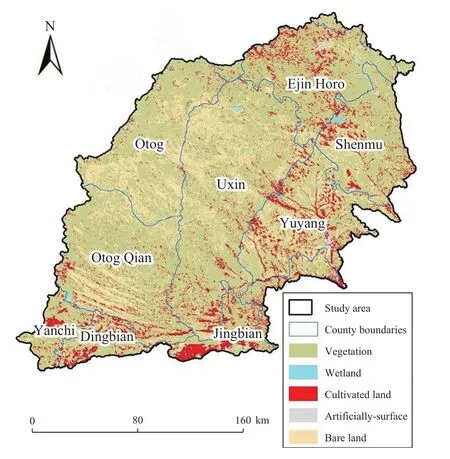
Figure 1 Location and typical land use/cover type distributions in the MUSL region(interpretation data from 2000)
3 Materials and methods
3.1 Data source and classification system
RS data applied in this work to derive the dynamic evolution of cultivation activity and LUCC due specific human activity included Landsat5 TM(1990's and 2010's data) and Landsat7 ETM+ (2000's data) with a 30-m spatial resolution (Table 1). All images were acquired betweeb June and September in the study years, when vegetation in the MUSL region generally achieve their maximum extent. For each study year, 6 images were used to cover the entire MUSL region. Considering that it is difficult to obtain cloud-free images that covered the entire study area within a given year, some images from 1991,1999, and 2009 were selected to replace unsuitable(bad track or cloudy) images from 1990, 2000, and 2010, respectively. In addition to remote sensing images, some ancillary materials such as regional land desertification, vegetation and land-cover maps, and field survery reports were used to assist the following interpretation process.
In Table 2, we present the classification system of land use/cover type used in the present work. The classification system accords to a modified version published in Li et al. (2015). Five land-use/cover types, e.g., vegetation, cultivated land, wetland, artificially surface, and bare land, are defined by considering detailed imaging spectral characteristics.
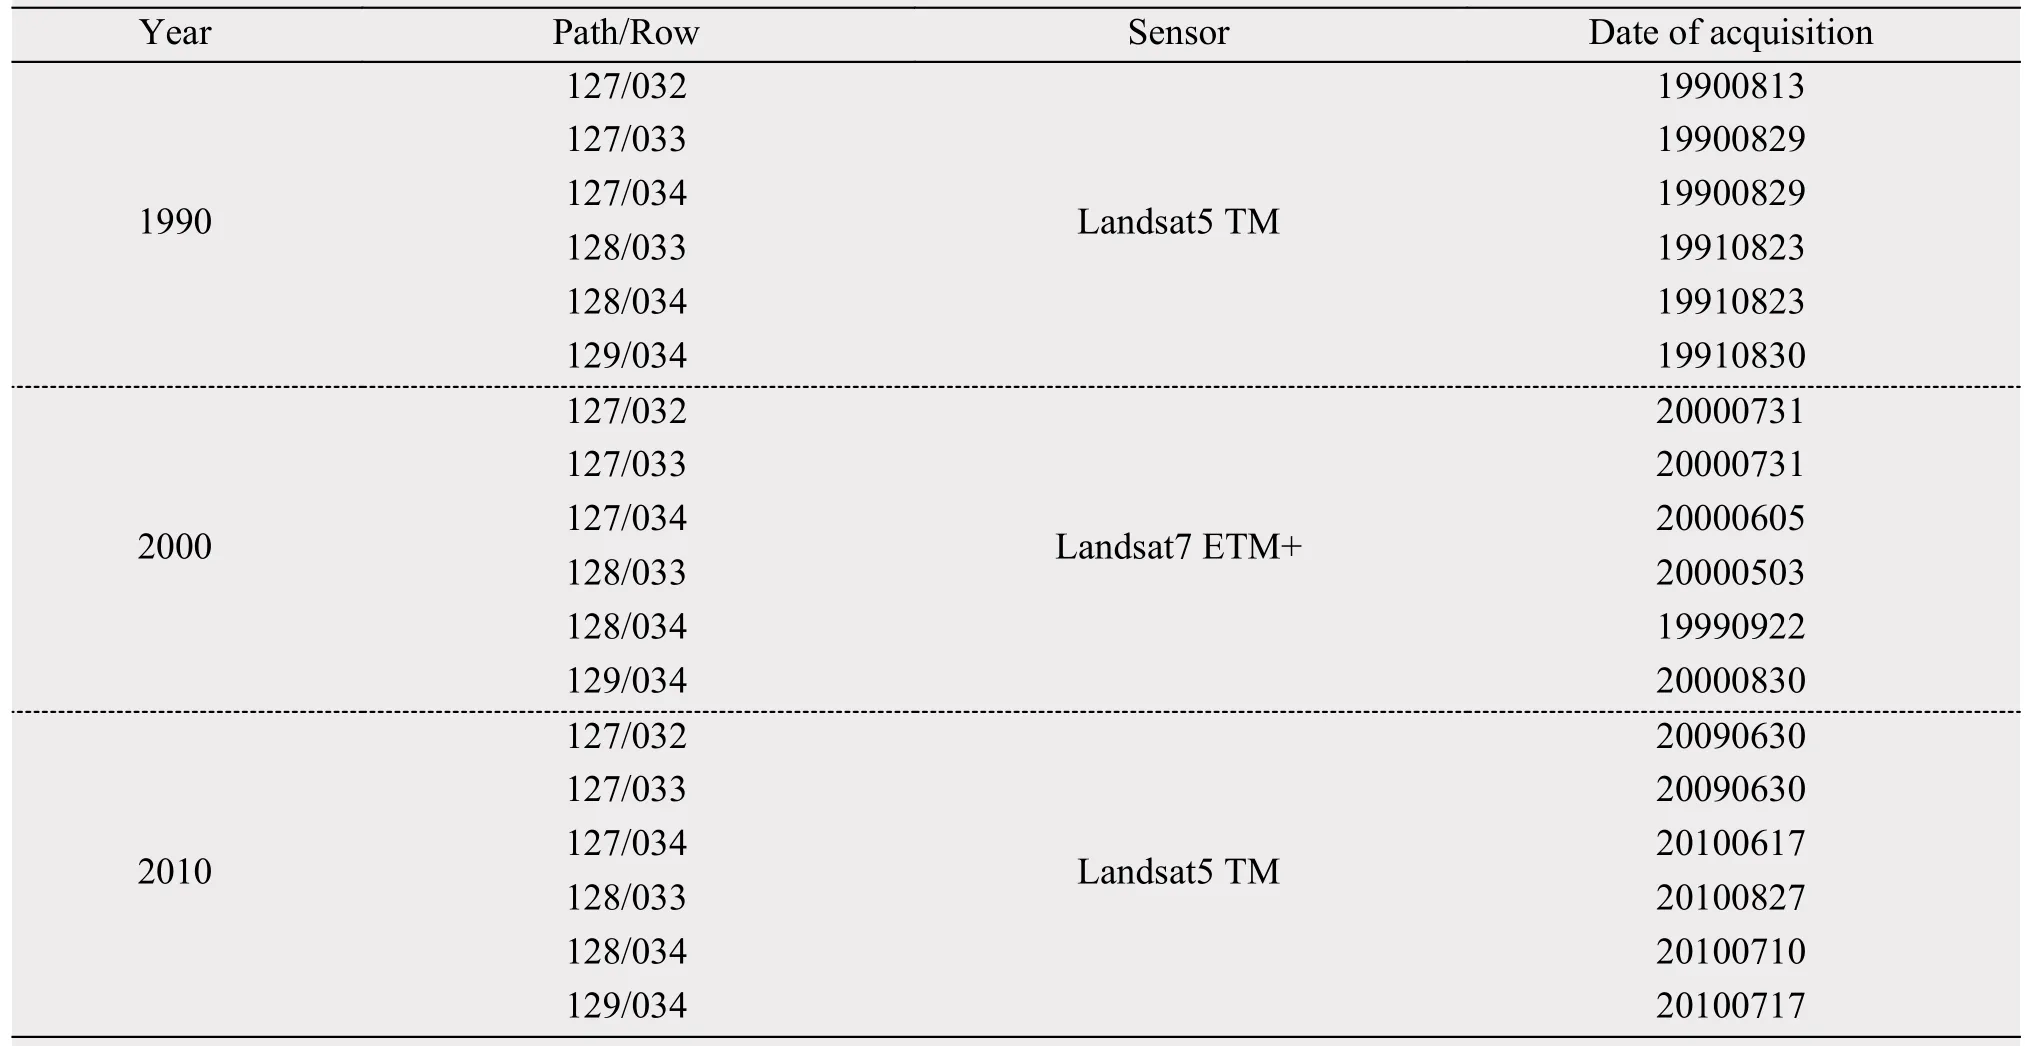
Table 1 Landsat satellite images to monitor cultivated-land change in the study area

Table 2 The classification system of land use/cover type used in the present study
3.2 Image processing and interpretation
The methods of image processing and interpretation have been described elsewhere (Li et al., 2015).All images represent composites of spectral data from bands 4, 3, and 2 and were used to create false-color RGB images. Although visual interpretation for the images is labour-intensive and time-consuming, the interpretation accuracy is higher than that of image classification based on the image-processing software because of low spatial and spectral resolution of these Landsat images. Databases of cultivated activity-induced LUCC are obtained at a spatial scale of 1:100,000 using version 7.01 of the Modular GIS Environment (MGE) software.
In interpretation processes, we adopted the following mapping principles to increase interpretation quality: (1) defining the minimum map patch as 6×6 pixels; (2) using one pixel to locate each map patch on the screen with a resolution of 30 m for these images; (3) recognition accuracy required to be higher than 95%. Finaly, we obtained a classification accuracy of greater than 95% in each year based on a comparison with field data.
After interpretation and digitization of thematic maps were completed, the maps were given to quality inspectors who were experts in the studies and the classification. These inspectors assessed the mapping accuracy according to their knowledge. The maps were reinterpreted and rechecked if the mapping ac-curacy failed the mapping principles. Some images acquired from Google Earth were also used as ancillary material to confirm the results of our interpretation.
4 Results
Spatial distribution of cultivated land in the MUSL region for 1990, 2000, and 2010 are presented in Figure 2. It was found that most cultivated lands are distributed in the eastern and southern MUSL region (inner administrative zone of Ejin Horo banner,Uxin banner, Yuyang District, Shenmu, Dingbian,Jingbian and Yanchi counties). Monitored results as a database, including total areas of cultivated land in the three study years and their change during the two 10-year periods, 1990-2000 and 2000-2010, are summarized in the bottom line of Table 3. One can see that, in 1990, the total area of cultivated land in the MUSL region occupied 4,179.0 km2(approximately 8.7% exists within the total study area). In the first 10-year period (1990-2000), the total area of cultivated land is relatively stable, from 4,179.0 to 4,180.7 km2. After the initiation of CGGP (the second 10-year period), cultivation activity obviously changed, i.e.,the total area of cultivated land decreased by 98.7 km2from 2000 to 2010, representing a 2.4% reduction in total area and an average decreasing rate of 9.9 km2per year.
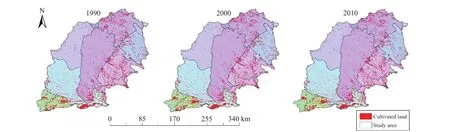
Figure 2 Spatial and temporal distribution of cultivated land in the study area
As mentioned above, the study area was spatially delineated into three separate parts; Inner Mongolia Autonomous Region, Shaanxi Province, and Ningxia Hui Autonomous Region, hereafter called Part 1, Part 2 and Part 3, respectively. Analyzing the differential distribution of cultivated land according to the three administrative divisions can help us to understand more clearly the spatio-temporal of cultivation activity in this study area. The differential data associated with the three parts are also presented in Table 3. During the first 10-year period, for Part 2 and Part 3, the total areas of cultivated land increased from 2,142.0 to 2,161.0 km2(19.0 km2, 0.9% of the total area A2 related to 1990) in the former and from 196.3 to 204.5 km2(8.2 km2, 4.2% of the total area A2 related to 1990) in the later. However, for Part 1, the total area of cultivated land decreased from 1,840.7 to 1,815.2 km2(-25.5 km2, 1.4% of the total area A2 related to 1990). Noteworthy is that, after the initiation of CGGP, all three parts presented the same evolution behavior, i.e., the total area of cultivated land related to each administrative unit decreased by 1.4%(25.0 km2), 2.5% (54.7 km2), and 9.3% (19.1 km2) of the total area A3 related to 2000, respectively.
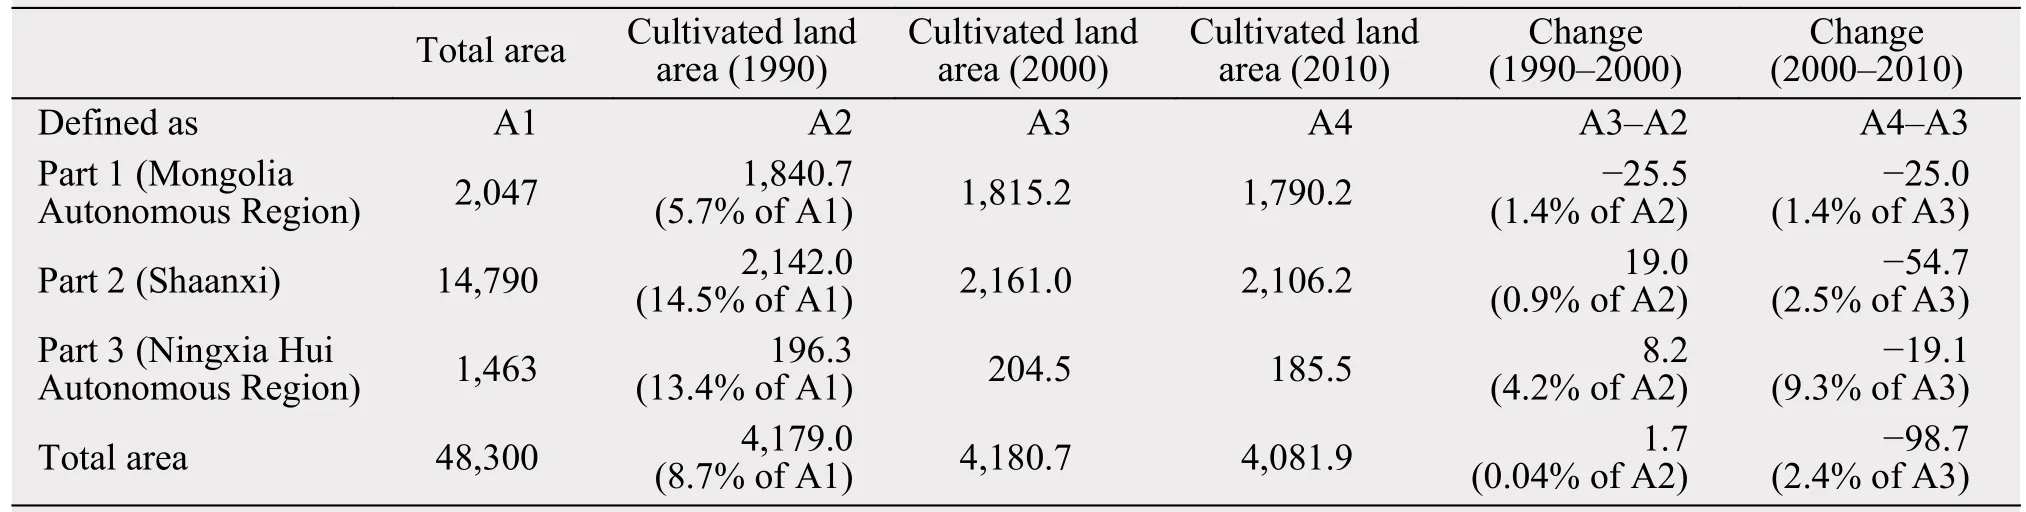
Table 3 Total and differential area data for cultivated lands and their changes in this MUSL region (area unit: km2)
In such an eco-fragile region, each land-cover type plays an important task in protecting ecosystem equilibrium and resisting external disturbance. It should be more significant to extract LUCC due to the evolution of cultivated land. Tables 4-6, as a series of databases of cultivated activity-induced LUCC,present the differential transformation data of land use/cover types from or to cultivated land, belonging to Part 1 (Inner Mongolia Autonomous Region), Part 2(Shaanxi Province), and Part 3 (Ningxia Hui Autonomous Region), respectively. Here, we define a ratio,equal to the area change of each land-use/cover type due to cultivation activity divided by the total area changes of cultivated land in a corresponding period,as a quantitative parameter presented in Tables 4-6.To some extent, the ratio could be considered as an indicator for the contribution degree of a given land use/cover type in the evolution of cultivation activity.
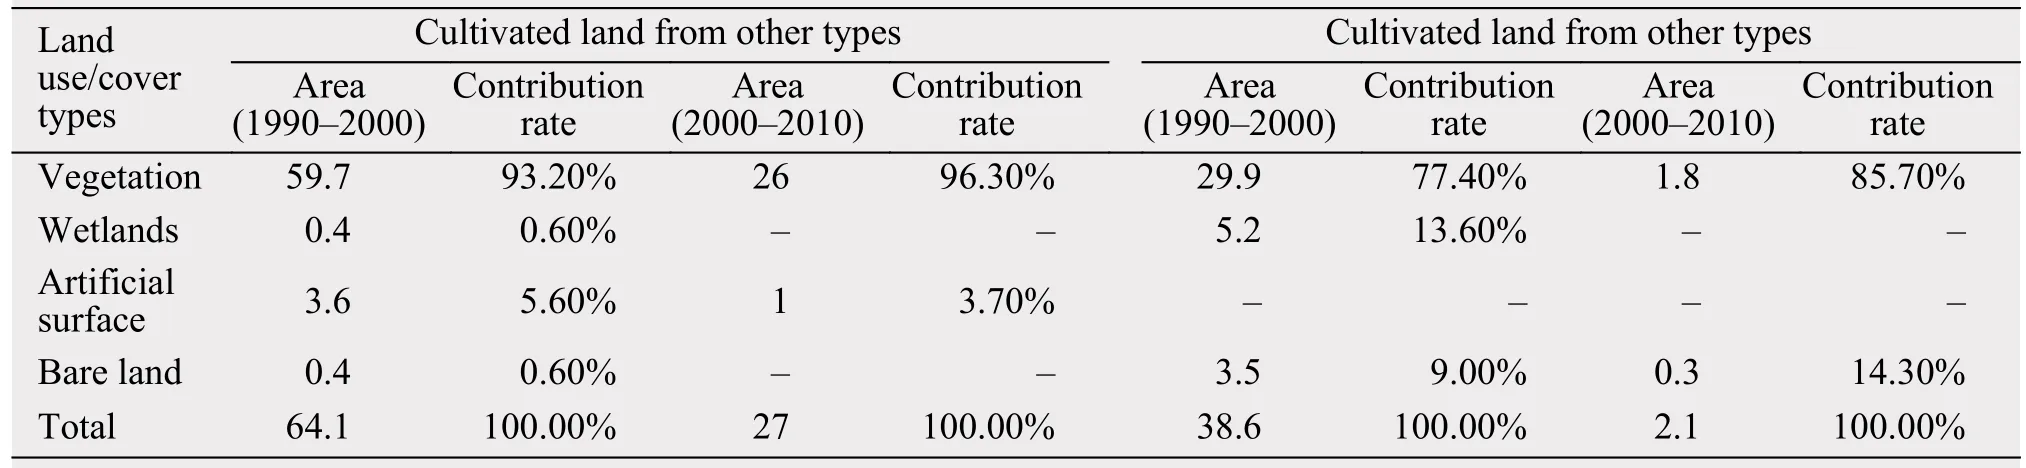
Table 4 The transfer matrix of cultivated land from/to the other four land-use/cover types related to Part 1 in 1990-2000 and 2000-2010 (area unit: km2)

Table 5 The transfer matrix of cultivated land from/to the other four land-use/cover types related to Part 2 in 1990-2000 and 2000-2010 (area unit: km2)
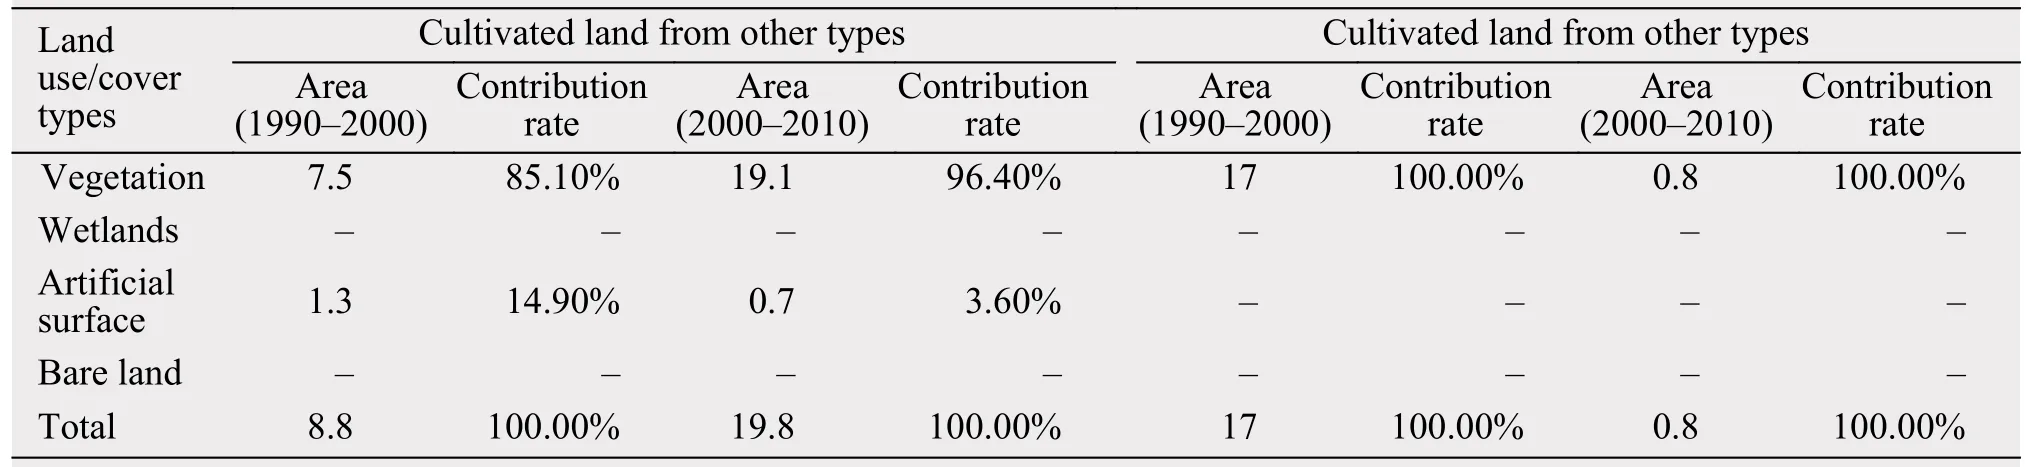
Table 6 The transfer matrix of the cultivated land from/to the other four land-use/cover types related to Part 3 in 1990-2000 and 2000-2010 (area unit: km2)
For the results presented in Tables 4-6, one can see that, for all three parts, there are three common trends in the conversion from cultivated land into other land-use/cover types: (1) the conversion process continued during the whole study period; (2) the largest contribution in the conversion was found to be vegetation type; (3) compared with the case of 1990-2000, the contribution rate of the vegetation type in each part after CGGP initiation (2000-2010)presents a visible increasing trend, from 93.2% to 96.3%, 68.2% to 71.8%, and 85.1% to 96.4%, respectively. In the reverse process, there are two common trends for all three parts: (1) before CGGP initiation, there is a rapid expansion of cultivated activity because many tracts from the other land-use/cover types (38.6, 38.0, and 17.0 km2, respectively) were converted into new cultivated land, and the vegetation type plays an important role in the reverse process because of its large contribution rate of 77.4%,69.6%, and 100.0%, respectively; (2) after CGGP initiation, the expansion of cultivation activity was reduced dramatically from 38.6 to 2.1, 38.0 to 9.1, and 17.0 to 0.8 km2, respectively.
5 Discussion
In the study area, the difference of dynamic evolution of cultivation activity between the periods of 1990-2000 and 2000-2010 should be attributed to the implementation of CGGP planning adopted for the western region of China, tested since 1999 in Gansu,Shaanxi and Sichuan provinces, extended rapidly to 17 provinces in 2000 covering the entire MUSL region (Feng et al., 2005). Under the premise of ensuring stable economic growth, shifting low-yield cultivated lands to vegetation type (e.g., forest, grass,steppe, and shrub) is a strategic component of CGGP.This planning will induce reasonable cultivation activity in the MUSL region, requiring increased effort in converting some low-yield cultivated land back into natural vegetation types. This should also limit the expansion of cultivation activity which is usually related to the cost of destroying original vegetation such as forest, shrub, and steppe. Our results show that, after CGGP initiation (2000-2010), the contribution rates of vegetation type in the conversion from cultivated land into the other land-use/cover types increased, and the reclamation of new cultivated land were reduced dramatically, especially in Part 1 (from 38.6 to 2.1 km2) and Part 3 (17.0 to 0.8 km2). These results imply that cultivation activity in the entire MUSL region does tend to be more reasonable after CGGP.
Partial rationality for cultivation activity in the MUSL region during the period of 2000-2010 has been confirmed by comparative analysis of dynamic evolution of cultivation activity before and after CGGP. One should note that, during 2000-2010 and in the Part 2 (belonging to the Shaanxi Province), artificial surface plays an important role in contributing to the conversion from cultivated land into other land cover types (15.1 km2, 23.9%); the reclamation of new cultivated land, unlike Part 1 and Part 2, was not dramatically reduced (9.1 km2increase of new cultivated land). In such an eco-fragile region, if vital vegetation cover is not effectively restored during the reclamation process of cultivated land, or suffers from continuous destruction due to reclamation of new cultivated land, wind erosion accelerates and mobile sand dunes will form, and further aeolian desertification will develop. From the present data, one cannot effectively evaluate the influence to the ecological process resulting from cultivation activity. But, it should draw the attention of local managers to improve the implementation effectiveness of existing policies and (or) to establish new policies which are more sustainable to the socioeconomic development of the MULS region.
6 Conclusions
Cultivation land monitored in the MUSL region during the two periods of 1990-2000 and 2000-2010 provides an example for the use of remote sensing to comparatively analyze the evolution of cultivation activity and the land-use/cover changes (LUCC) resulting from such a specific human activity before/after the first-stage the China's Grain-for-Green Policy(CGGP). Our data shows that the process of returning cultivated land to grassland continued during the entire study period and the largest contribution in the process is vegetation type; comparative analysis found that the contribution rate of vegetation type after CGGP (2000-2010) presents a visible increasing trend. In the reverse process, our data shows that before CGGP, there is a rapid expansion of cultivated activity and vegetation, as the crucial original land-cover types for such a typical eco-fragile region was the main dominant type attributed to its expansion; after CGGP, the expansion of cultivation activity was obviously reduced. These results indicate that cultivation activity in the entire MUSL region tends to be more reasonable after CGGP initiation.
Detailed analysis of the cultivation-induced LUCC related to Shaanxi Province shows that, after CGGP, a considerable part of the cultivated land was converted into artificial surfaces but not vital vegetation type; furthermore, some land covered with vital vegetation was still reclaimed into new cultivated land. Monitored results provide reference data for local managers in evaluating the implementation effectiveness of CGGP and the effect of cultivation activity on the local ecological environment.
Acknowledgments:
This research was funded by the China National Key Basic Research Programme (2013CB429901), the National Natural Science Foundation of China(General Programme: 41171400), Youth Innovation Promotion Association, CAS (2016158) and the National Key Research and Development Program of China (2016YFC0503706).
 Sciences in Cold and Arid Regions2018年4期
- Sciences in Cold and Arid Regions的其它文章
- Comparative foliar anatomy of three Khaya species(Meliaceae) used in Nigeria as antisickling agent
- Industrialization model of enterprises participating in ecological management and suggestions: A case study of the Hobq Model in Inner Mongolia
- Biodiversity, productivity, and temporal stability in a natural grassland ecosystem of China
- Analysis of water vapour flux between alpine wetlands underlying surface and atmosphere in the source region of the Yellow River
- Change in summer daily precipitation and its relation with air temperature in Northwest China during 1957-2016
- Seasonal dynamics of N:P ratio stoichiometry and Ca fraction for four dominant plants in the Alxa Desert