
Biodiversity, productivity, and temporal stability in a natural grassland ecosystem of China
2018-09-07 06:46:28BingLiuWenZhiZhaoYangYangMengChanLiu
Bing Liu , WenZhi Zhao, YangYang Meng, Chan Liu
Linze Inland River Basin Research Station, Key Laboratory of Ecohydrology of Inland River Basin, Northwest Institute of Eco-Environment and Resources, Chinese Academy of Sciences, Lanzhou, Gansu 730000, China
ABSTRACT Understanding the effect of biodiversity on ecosystem function is critical to promoting the sustainability of ecosystems and species conservation in natural ecosystems. We observed species composition, species richness and aboveground biomass,and simulated the competitive assemblages in a natural grassland ecosystem of China, aiming to test some assumptions and predictions about biodiversity-stability relationships. Our results show that aboveground productivity and temporal stability increased significantly with increasing species richness, and via a combination of overyielding, species asynchrony, and portfolio effects. Species interactions resulted in overyielding caused by trait-independent complementarity, and were not offset by a negative dominance effect and trait-dependent complementarity effect. Therefore, the mechanisms underlying the biodiversity effect shifted from the selection effect to the complementarity effect as diversity increased, and both effects were coexisted but the complementarity effect represent a mechanism that facilitates long term species coexistence in a natural grassland ecosystem of China.
Keywords: biodiversity; productivity; temporal stability; overyielding effect; species interactions; complementarity effect;selection effect
1 Introduction
Loss of biodiversity is a worldwide result in reduction of ecosystem productivity and impairing the function of ecosystem services (Tilman et al., 1996,2001, 2006; Hector et al., 1999; McCann, 2000; De Mazancourt et al., 2013), however, its consequences on an ecosystem level remain largely unknown in natural environments. Although diversity promotes ecosystem processes and increases the temporal stability of productivity under experimental conditions(Tilman et al., 2006; Isbell et al., 2009; Hector et al.,2010; De Mazancourt et al., 2013; Hautier et al.,2014; Jucker et al., 2014), the underlying mechanisms that control ecosystem stability which is regulated and maintained by plant biodiversity and species composition remain contentious (Butler, 2011).Also, the diversity-productivity hypothesis has currently achieved the status of a paradigm on experiments with planted ecosystems, but it is difficult to interpret the mechanisms and test whether and how biodiversity contributes to stabilising productivity in natural ecosystems around the world. Thus, a better understanding of the effect of biodiversity on ecosystem function is critical to promoting the long-term sustainability of ecosystems and species conservation in natural ecosystems.
The global biodiversity crisis has motivated new theories and experiments that explore the relationships between biodiversity, productivity, and stability(Worm and Duffy, 2003), so that these relationships have become central issues in ecology (Loreau and Hector, 2001; Tilman et al., 2006; Hooper et al.,2012; Gamfeldt et al., 2013; Loreau and de Mazancourt, 2013; Jucker et al., 2014; Morin et al., 2014).Some evidence indicate the existence of a full range(i.e., positive, negative, and neutral) of qualitatively different diversity-biomass stability relationships(Ives and Carpenter, 2007; Gonzalez and Loreau,2009; Fowler et al., 2012). Conversely, the variation in productivity plays a fundamental role in driving the variation in biodiversity (Chase, 2010). Consequently,biodiversity may stabilise the overall ecosystem while simultaneously destabilising individual species richness (Tilman, 1999; Tilman et al., 2006; Hector et al.,2010; Haddad et al., 2011; Loreau and de Mazancourt, 2013), with few exceptions (Valone and Schutzenhofer, 2007; Van Ruijven and Berendse,2007; Isbell et al., 2009). Recent studies have shown that temporal stability increased with plant richness,but not plant evenness (Isbell et al., 2009). Nevertheless, the biodiversity-stability relationships that excluded the influence of species evenness have not yet been directly tested to examine whether the theory developed in experimental ecosystems also applies to ecosystems in natural conditions.
There is some theoretical evidence that species interactions can promote biodiversity, productivity and temporal stability (Lehman and Tilman, 2000; Tilman et al., 2006; Van Ruijven and Berendse, 2007), and the net biodiversity effect of species interactions has mainly focused on the relative contributions of the whole community (complementarity effect), and the separate effects of dominant species (selection effect)(Loreau and Hector, 2001; Tilman et al., 2001; Fargione et al., 2007). However, the interpretation of species interactions remains controversial, because two mechanisms may operate in combination of selection and complementarity effects (Huston et al., 2000;Loreau and Hector, 2001). Recently, Fox (2005) proposed a "tripartite partition" in the net biodiversity effect on production that could solve these difficulties.However, the different components of the tripartite partition can simultaneously influence the net biodiversity effect in most biodiversity experiments (Loreau and Hector, 2001; Bruno et al., 2005). The difficulty lies in distinguishing complementarity from the selection effect, to evaluate the contributions of each component to the net biodiversity effect and to explain the mechanisms of species interactions under natural ecosystem. Ecosystem conservation will require identification of the most important mechanisms to understand the effect of diversity on productivity and to predict the conditions required for the maintenance of changing biodiversity in ecosystems.
To fill the research gap on biodiversity-stability relationships in natural ecosystems, we observed species composition, species richness and aboveground biomass, and simulated the competitive assemblages in a natural grassland ecosystem of China, aiming to test some assumptions and predictions about biodiversity-stability relationships. Our specific objectives were (1) to identify the mechanisms by which biodiversity influences temporal stability; (2) to quantify how species interactions influence the biodiversity, productivity, and stability of the ecosystem;(3) to partition biodiversity effects into three components based on dominance and complementarity effects; and (4) to investigate how interactions among species produce differences in the tripartite components of the biodiversity effect.
2 Materials and methods
2.1 Field experiment
The study area is located in an ecotone between prairie and desert steppe, in the Ningxia Hui Autonomous Region of northern China, between 37°40'N and 38°10'N and between 106°30'E and 107°41'E. The region has been described in detail in Liu et al. (2015). The experiment was conducted in a natural grassland during the growing seasons of 2013 and 2014. We selected plant communities with the numbers of species from one to twenty in a semiarid desert steppe of China, to examine species interactions that influence biodiversity, productivity and temporal stability. The study site has a homogeneous topography and soil type, and the individual density of plants was also relatively uniform. We established a total of 720 plots (1m×1m) including 65 indigenous species. Plots were assigned to have 1, 2, 5, 10, 15, or 20 of plant species based on the species composition growing in the plot; we manipulated the species composition and number to produce different numbers of species in different plots, by removing all undesired species from each plot at monthly intervals during the growing season. For the mixtures, we established 360 plots at five levels of species richness, comprising 10 random samples using 36 species at each level; and for the monocultures, we established 460 plots, with 10 replicates for each of the 46 species. All plots have a similar plant density of 200 individuals per m2, but there were different individual density in every species within the plots as we only tested the hypothesis of biodiversity-stability relationships based on species richness. We determined the species number and plant functional group, and aboveground biomass at each plot. The 65 species were classified into three groups: annual herbs (22), perennial herbs (35) and subshrubs (8). For the six species richness treatments,total aboveground biomass for each plot was meas-ured by harvesting all plant material at ground level after the vegetation had reached its peak standing biomass, which occurred generally in early September in both experimental years. Plants were mowed within each plot in early September, and the samples were then oven-dried (70 °C, 48 h) to determine the dry weight.
2.2 Data analysis
2.2.1 Effect of biodiversity on temporal stability
Temporal stability (S) was quantified as the reciprocal of the coefficient of variation, using the ratio of the mean value of total aboveground plot biomass (μ)to its temporal standard deviation (σ) (Lehman and Tilman, 2000; Van Ruijven and Berendse, 2007).

Portfolio effects are especially important when stability is mainly influenced by population fluctuations of the dominant species. To test for the portfolio effect, we analysed the temporal variance (σ2) and mean (μ) of species biomass according to a power-function relationship between the two parameters (Van Ruijven and Berendse, 2007; Roscher et al., 2011):
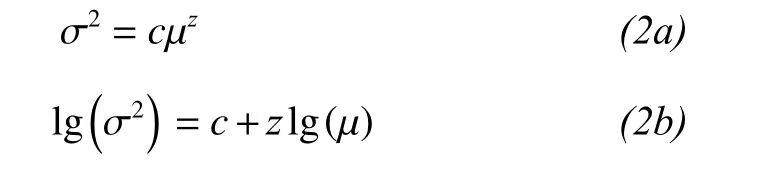
where c is a regression constant and z is a scaling coefficient.
2.2.2 Mechanisms by which biodiversity influences temporal stability
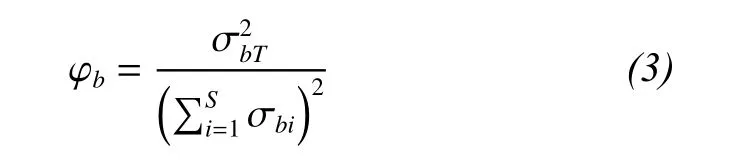
A measure of community-wide species synchrony can be used to directly compare the asynchrony of species fluctuations (Loreau and de Mazancourt,2008). Community-wide synchrony in species biomass (φb) can be quantified as:
2.2.3 Species interactions that influence biodiversity, productivity and temporal stability
To predict the effects of species interactions, Loreau and Hector (2001) separated the net biodiversity effect (ΔY) into two components through measuring the difference between observed and expected yields of a mixture under the null hypothesis: the complementarity effect () and the selection effect(Ncov[ΔRY, M], where cov represents the covariance)for each species mixture:

where N is the number of species,is the average deviation between the observed (RYO) and expected(RYE) relative yields of all species in the mixture,is the average mass of all monocultures.
We considered the effect of the tripartite partition of species interactions, which separates the net biodiversity effect into three components: The first term on the right-hand side of the equation (trait-independent complementarity, TIC) represents the complementarity effect, and the sum of the two covariance terms (trait-dependent complementarity and the dominance effect, TDC and DE) is the selection effect(Loreau and Hector, 2001; Fox, 2005; Long et al.,2007). The tripartite partition can be written as:
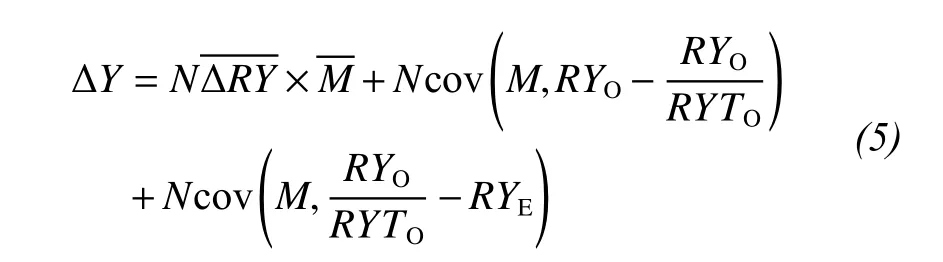
where RYOof a species is calculated by dividing its mass in a mixture by its mass in a monoculture. RYEof a species is the proportion of the total mass in a mixture accounted for by a species based on its expected yield in a monoculture. RYTOequals the sum of RYOfor all species in the mixture.
2.2.4 Simulations of species interactions in the tripartite partition
We carried out simulations using the method of Long et al. (2007) to ascertain the contributions of species richness to total production in mixed-species assemblages. We simulated competitive assemblages based on the relationships between the yield of a species in a monoculture and its yield in a mixture, including neutral (non-transgressive overyielding),dominant (transgressive overyielding), and trade-off communities (underyielding) (Fridley, 2001; Rees et al., 2001; Grime, 2002). Based on the method of Long et al. (2007), the yield of species in a mixture was calculated in neutral (YN), dominant (YD), and trade-off(YT) communities as follows:
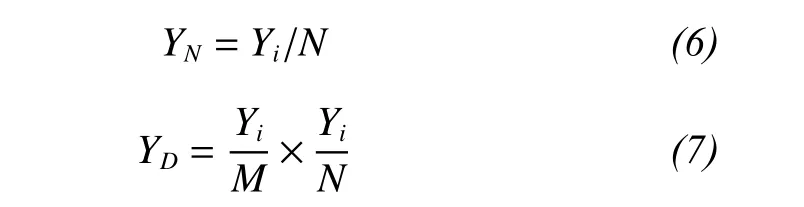

where Yiis the yield of species i in a monoculture, N is a random number in the interval N ± 0.2N (where N represents the total number of species) in a monoculture, andis the average mass of all species that were grown in monocultures.
Initially, we created different levels of species richness, by defining the yield of a species in a monoculture as a random value between the minimum and maximum measured yields. This let us investigate how species interactions produced differences in the total community biomass, and how those differences were reflected in the components of the tripartite biodiversity effect (TIC, TDC, and DE). We also separately determined the monoculture and mixture yields by controlling a diversity gradient with 10 replicates (plots) for each community at five levels of diversity (2, 5, 10, 15, or 20 species). We performed these simulations to provide three estimates of the components of TIC, TDC, and DE in each of the five levels of species richness. Data were divided into many groups by stratified random sampling, so that the species in one level of species richness were not duplicated in another level; this made the species compositions in each level statistically independent.
3 Results
3.1 Effects of biodiversity on productivity and temporal stability
Aboveground productivity increased significantly as species richness increased (Figure 1a, Table 1,F5,120= 97.38, P = 0.001). Aboveground productivity of the mixtures (mean ± SE: 96.66 ± 3.90 g/m2) increased to more than four times those in the monocultures (17.30 ± 2.36 g/m2), so there is strong evidence for the overyielding effect. Productivity in response to increasing species richness differed greatly among the functional groups (Table 1, F2,98= 7.57, P = 0.019).The main effects of species richness, species ID, and their interaction effects for aboveground productivity of perennial herbs (Perennial herb × SR, Species ID ×Perennial herb) were all significant (P <0.0001;Table 1). However, subshrubs and their interaction terms did not significantly explain any additional variation in aboveground productivity (Table 1, P >0.05).

Figure 1 Relationships between species richness and (a) aboveground productivity, (b) temporal stability, and(c) community-wide synchrony. Means for a parameter (± SEM) labelled with different letters differ significantly (Tukey's HSD; ***, P <0.001; **, P <0.01; *, P <0.05)
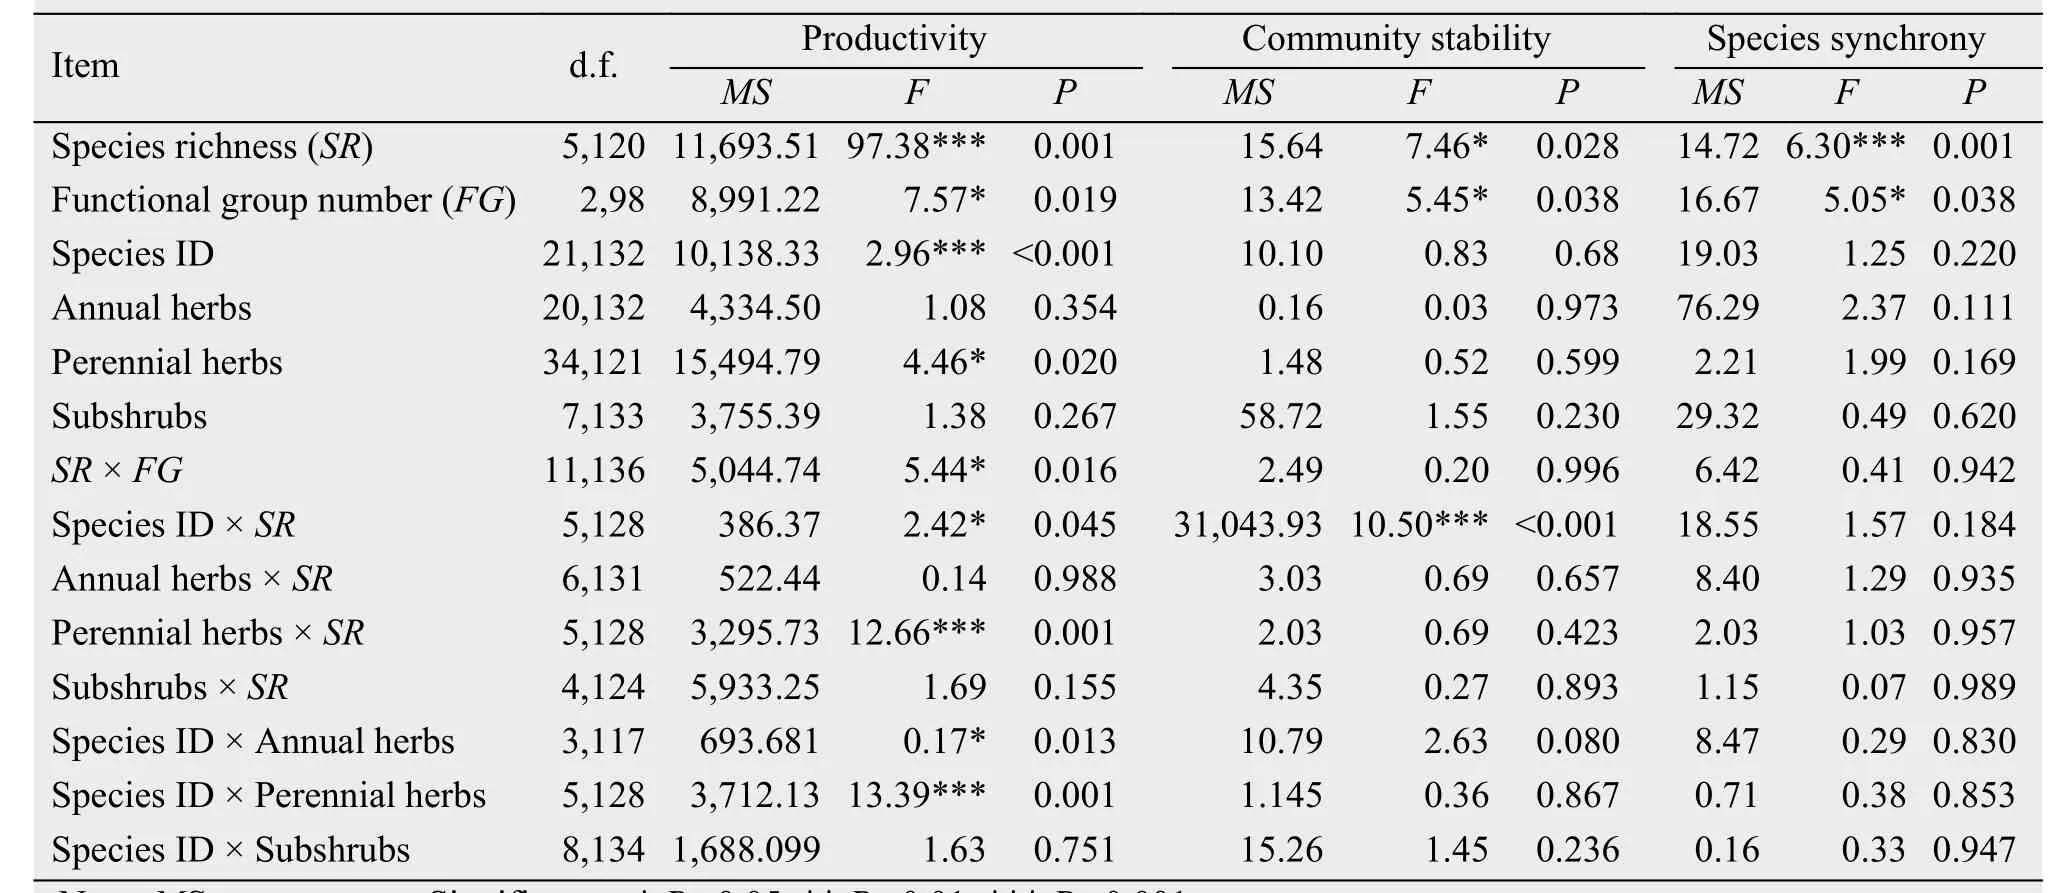
Table 1 Summary of the statistical results for productivity, community stability, and species synchrony,as well as their interactions with the key species variables
Similarly, the temporal stability of the ecosystem increased with an increasing number of species(Figure 1b, R2= 0.64, P <0.001), and the difference was significant (F5,120= 7.46, P = 0.028), which is dependent on the perennial herbs, with the significant interactions of Perennial herbs × SR (F5,128= 12.66,P = 0.001), and Species ID × Perennial herbs (F5,128=13.39, P = 0.001). Temporal stability of the species mixtures was more than twice that of the monocultures(mixtures = 5.87 ± 0.52 mean ± SE; monocultures =2.27 ± 0.29; F1,232= 5.96, P = 0.015). We therefore found evidence that overyielding increased temporal stability. Although the differences among the functional groups were significant (F2,98= 5.45, P = 0.038),there were no significant differences within each functional group and the interaction terms with stability were not significant for SR, FG, and Species ID.
3.2 Mechanisms by which biodiversity influences productivity and temporal stability
Community-wide synchrony decreased significantly with increasing species richness (Figure 1c, R2=0.45, P <0.0001). Species synchrony was significantly negatively dependent on species richness(Table 1, F5,120= 6.30, P = 0.001) and functional group number (Table 1, F2,98= 5.05, P = 0.038), but there was no significant species richness × functional group number interaction (Table 1, F11,136= 0.41, P =0.942). In addition, temporal stability decreased with increasing species synchrony for all numbers of species in the mixture (Figure 2, R2= 0.65 to 0.81,P <0.0001).
We found that the logarithm of the variance in biomass increased linearly with increases in the logarithm of the mean biomass for the different species mixtures (Figure 2, R2= 0.75 to 0.91, P <0.0001). The z value calculated across all species was z = 1.40, and up to 7.26 for 20 species. This is evidence that the portfolio effect increased temporal stability. Therefore, biodiversity increased temporal stability via a combination of overyielding, species asynchrony, and portfolio effects.
3.3 Species interactions that influence biodiversity,productivity, and temporal stability
Species interactions that resulted in overyielding(ΔY = 10.70 ± 0.92, F4,207= 67.86, P <0.001) significantly promoted biodiversity, productivity, and temporal stability. With increasing species richness, RYT(Figure 3a, F = 32.99, P <0.001, R2= 0.45), net effect (Figure 3b, F = 236.78, P <0.001, R2= 0.68) and complementarity effect (Figure 3c, F = 302.41, P<0.001, R2= 0.73) increased linearly, but the selection effect decreased (Figure 3d, F = 91.60, P <0.001,R2= 0.62). The overall net effect increased because the complementarity effect (14.30 ± 1.22, F4,207=86.38, P <0.001) increased more strongly than the decreased selection effect (-4.18 ± 0.57, F4,207= 25.44,P <0.001).
Species richness significantly affected the interactions among species (Table 2). For example, the main effect of species richness was significant for RYT(F4,207= 18.27, P <0.001), net effect (F4,207= 38.03, P<0.001), complementarity effect (F4,207= 46.86, P<0.001), and selection effect (F4,207=13.33, P<0.001). The functional group number significantly affected RYT (F2,207= 3.10, P = 0.016), net effect(F2,207= 4.53, P = 0.002), and the complementarity effect (F2,207= 3.57, P = 0.009). Surprisingly, there is some evidence that the differences in species richness,functional group number, and composition worked together to significantly promote overyielding in natural grassland ecosystems, as the SR × FG × Species ID interaction was significant for the complementarity effect (F7,208= 2.74, P = 0.012) and the selection effect (F7,208= 4.03, P = 0.001).
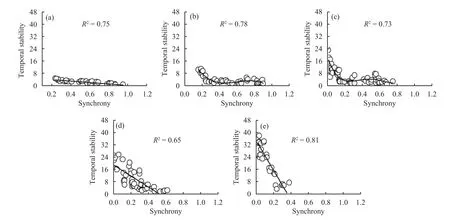
Figure 2 Effects of plant diversity on the relationship between community-wide synchrony and its temporal stability.(a) 2 species, (b) 5 species, (c) 10 species, (d) 15 species, (e) 20 species
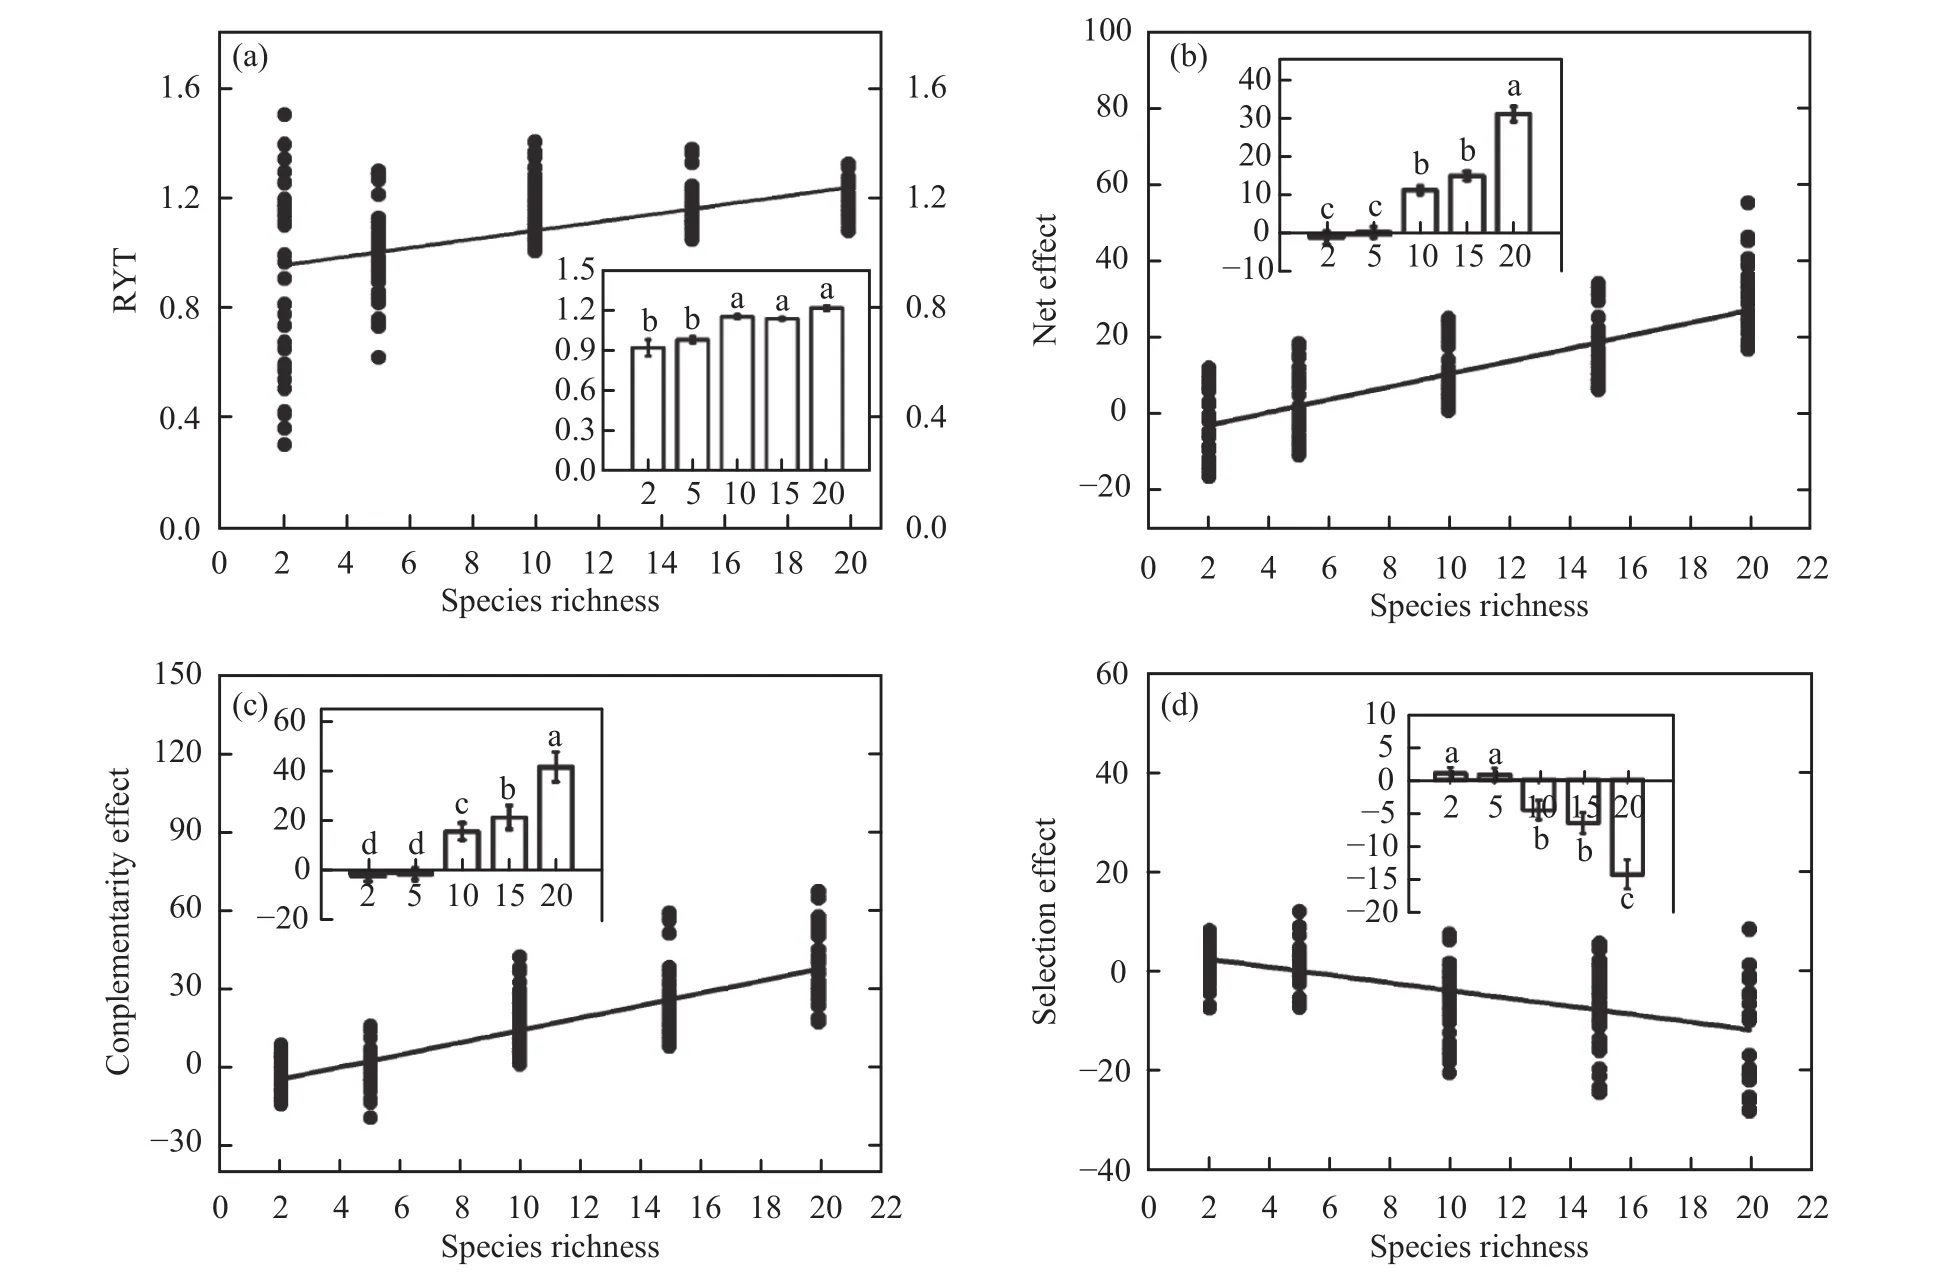
Figure 3 Effects of species richness on (a) the relative yield total (RYT), (b) the net effect, (c) the complementarity effect, and (d)the selection effect. Means ± SEM labelled with different letters differ significantly (Tukey's HSD, P <0.05)

Table 2 Summary of the analysis of net biodiversity effects, the two components of the complementarity effect, and the selection effect
Temporal stability increased linearly with increasing complementarity effect (F = 68.41, P <0.001, and R2= 0.85; Figure 4a) and decreasing selection effect(F = 34.77, P <0.001, and R2= 0.81; Figure 4b). This indicates which species interactions which resulted in niche partitioning or facilitation and interactions which favoured unproductive species both improved utilization rate of resources by the strategic complementarity in the community, and promoted productivity and temporal stability of the ecosystem.
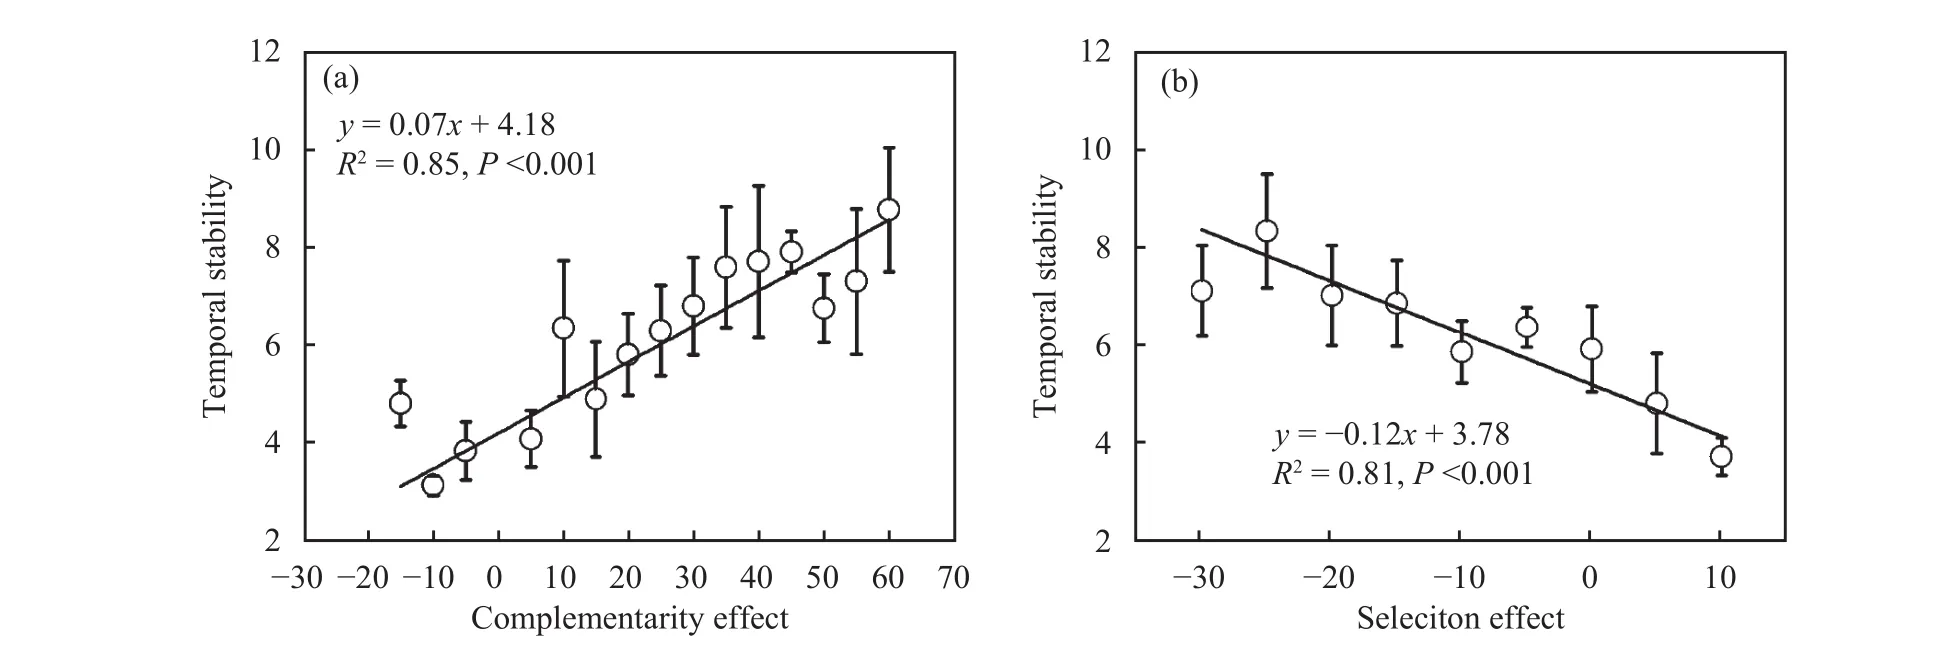
Figure 4 Interactions that influenced temporal stability. (a) the complementarity effect and (b) the selection effect
3.4 Simulations of species interactions in terms of the tripartite partition
All simulated values of the three components(TIC, TDC, and DE) and of the net biodiversity effect(ΔY) increased linearly with an increase in the measured value in neutral and dominant communities, but trade-off communities exhibited the opposite trend.This suggests that species interactions can not only influence the magnitudes and signs of the three components of the net biodiversity effect, but can also influence relationships among the three components under the background of biodiversity change.
In the three community types, the simulated TIC,TDC, DE, and ΔY value was significantly higher in the dominant communities, followed by neutral communities, and then by trade-off communities (Table 3).The relationship between simulated and measured values was significant among the three components of the net biodiversity effect (R2= 0.66 to 0.92, Figure 5),which suggest that monoculture yields in the theoretical simulation potentially captured the physical processes of the competitive assemblages and species interactions in the natural grassland ecosystem.
The RMSE of measured and simulated for ΔY ranged from 19.69 to 16.76, and the MSE from -9.05 to -9.63 (Figure 5). The simulation results corroborate the predicted importance of species interactions in mediating biodiversity effects on yield, and will explore mechanisms for these patterns by partitioning the diversity effect into components in different relationship between biodiversity and productivity.
We have presented evidence that species interactions that result in overyielding promoted biodiversity, productivity, and temporal stability; this is because the complementarity effect (TIC) increased more strongly than the decreased selection effect(TDC and DE) in a dominant community (Figures 6b,6e, 6h). In a neutral community, the negative TDC and DE and TIC that was produced by interspecific competition were offset (Figures 6a, 6d, 6g), which species interactions was not effect to the change of community productivity. However, the allelopathic effect among species result in the TIC and negative TDC and DE (Figures 6c, 6f, 6i), which reduced the community productivity in trade-off community.Therefore, species interaction is very important in effect to community productivity.
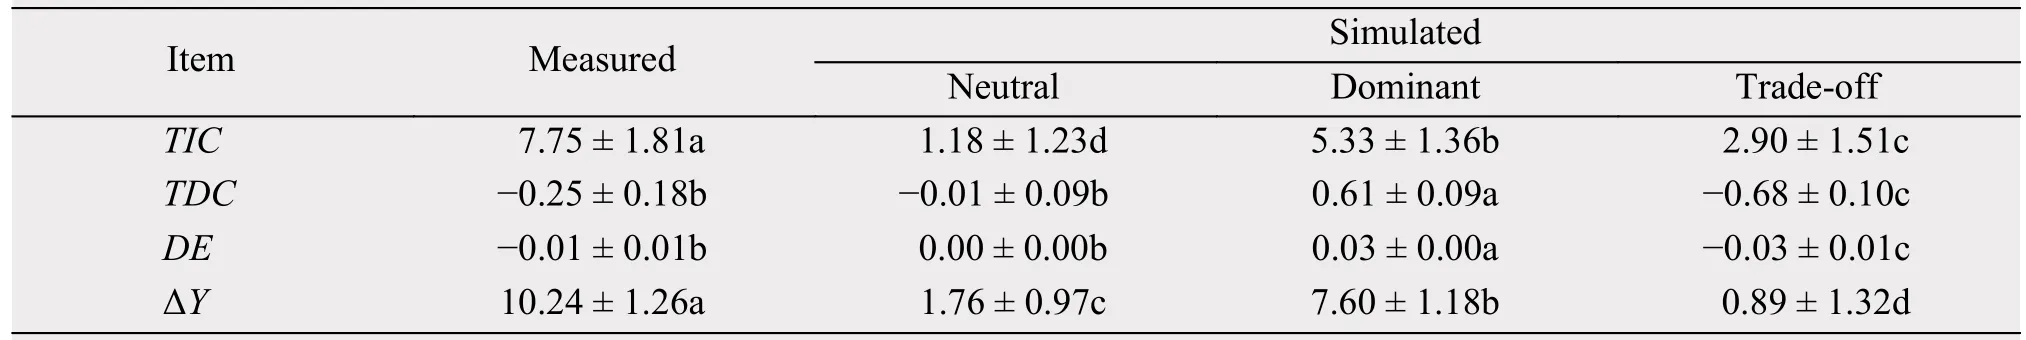
Table 3 Statistical summaries of measured and simulated parameters in the neutral, dominant, and trade-off communities
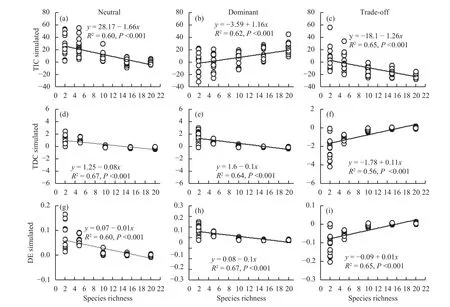
Figure 6 Effects of species richness on the (a) trait-independent complementarity (TIC), (b) trait-dependent complementarity(TDC), and (c) dominance effect (DE) in neutral, dominant and trade-off communities
4 Discussion
4.1 Effects of biodiversity on temporal stability
The increase in productivity and temporal stability with increasing species richness observed in our experiment, which supports a greater diversity should lead to greater ecosystem stability (Lehman and Tilman, 2000; Tilman et al., 2006; Van Ruijven and Berendse, 2007; Isbell et al., 2009). We found evidence of a significant decrease of covariance (i.e.,asynchrony effects) with increasing diversity (Figure 1c). This suggests that low community-wide species synchrony was a prerequisite for stability at the community level (Figure 3). Thus, the negative covariance between species is the mechanism responsible for the positive relationship between diversity and community stability. The z value estimated across all species was 1.40, a value that has been interpreted as indicative of a portfolio effect (e.g., Tilman, 1999;Steiner et al., 2005; Van Ruijven and Berendse,2007). Therefore, biodiversity increased temporal stability via a combination of overyielding, species asynchrony, and portfolio effects.
Ecosystem stability has been assumed to depend as much on the functional groups of the component species as on species richness (Hooper and Vitousek,1997), while, our results provide evidence that temporal stability of the ecosystem depended mainly on the interaction between species identity and species richness. These interaction effects were only significant for aboveground productivity of perennial herbs(Table 1), which suggests that perennial herbs have a particularly important contribution to the productivity and temporal stability of the ecosystem in a semiarid desert steppe of China.
4.2 Mechanisms by which biodiversity influences productivity and temporal stability
Linking theoretical and empirical work is necessary to better understand the effect of biodiversity on the stability of ecosystem functioning (Morin et al.,2014). The mechanisms underlying the increasingly positive effect of biodiversity on plant biomass production shifts from a selection effect to a complementarity effect as biodiversity increases, and this is consistent with the theory of Fargione et al. (2007).For example, a negative selection effect has been initially observed when the number of species was less than five (Figure 5b), this may be because unproductive species are able to colonize a site and grow rapidly in early successional states (Polley et al., 2003),possibly excluding other species, in both monoculture and polyculture conditions (Rees et al., 2001;Grime, 2002; Long et al., 2007), so negative dominance and trait-dependent complementarity effects are probably common (Loreau and Hector, 2001, Hooper and Dukes, 2004, Bruno et al., 2005). However, as the number of species increases (i.e., later in succession),more of the initially unexploited niches are exploited,resulting in a progressive increase in the net biodiversity effect. The generality of this trade-off suggests that the yield of a plant species in mixtures may often be unrelated, or negatively related, to their competitive ability in stable community (Bai et al., 2004;Bruno et al., 2005; Long et al., 2007). And, trade-offs between competitive ability and other life history traits such as fast growth are ubiquitous in mixed communities (Grime, 2002). The net effect depended mainly on complementarity effect when there were more than five species (i.e., later in succession) because aboveground biomass in a mixture was not associated with competitive ability (Figures 5b, 5c), and the mechanisms for these patterns can be explored by partitioning the diversity effect into components. An increased complementarity effect indicates that species-rich communities can exploit the available resources more completely (Naeem et al., 1994; Tilman et al., 1996; Hooper and Vitousek, 1997; Loreau,1998; Bond and Chase, 2002; Van Ruijven and Berendse, 2003). In grasslands, productivity is limited by water availability, so facilitation or complementarity in water use may be caused by reduced soil evaporation that results from increased vegetation cover at higher species diversity. Complementarity among annual herbs, perennial herbs, and subshrubs can occur because of differences in their rooting depth, probably reflecting spatial differences in nutrient uptake(Van Ruijven and Berendse, 2005). Therefore, complementarity may both enhance ecosystem functioning and represent a mechanism that facilitates long term species coexistence in a natural grassland ecosystem of China. However, these conflicting results may be explained by differences in the underlying mechanism, the dominant species exhibited exceptionally stable biomass production by increasing the selection effect in the study by Polley et al. (2007)and Long et al. (2007). Also, the selection and complementarity effects are not mutually exclusive in a complex ecosystem (Figures 5c,5d, and Figures 9) in our grassland ecosystem. Many effects can simultaneously affect productivity, so coexistence mechanisms may be an important component of the relationships between diversity and stability (Tilman, 1999;Cottingham et al., 2001).
To better understand the maintenance of biodiversity, productivity, and temporal stability, we attempted to identify the specific mechanisms that contribute to a negative selection effect and a positive complementarity effect using Fox (2005) framework of tripartite partitioning. We found that species interactions that result in overyielding, caused by trait-independent complementarity via facilitation or niche partitioning, were not offset by negative dominance and trait-dependent complementarity effects. However, as has been widely contradictorily hypothesized,trait-independent complementarity was offset by negative selection effects including the competitive suppression of highly productive species in diverse polycultures, resulting in weak or negligible net effects with increasing species richness (Loreau and Hector,2001; Hooper and Dukes, 2004). Consequently, our research suggests that the different mechanisms that underlie the biodiversity effect are likely to overlap and influence each other, and that the response of ecosystem function to changes in species richness could be the outcome of the interactions among many different mechanisms.
Acknowledgments:
This study was supported by the National Basic Research Program of China (No. 2013CB429903),and the National Natural Science Foundation of China(Nos. 41471024; 41771038). We thank all participants in the vegetation and environmental surveys at the Forestry Bureau of Yanchi County, Ningxia Hui Autonomous Region, China.
 Sciences in Cold and Arid Regions2018年4期
- Sciences in Cold and Arid Regions的其它文章
- International Workshop on Cryospheric Changes and Their Regional& Global Impacts Successfully Held in Gansu Province
- Cultivated-land change in Mu Us Sandy Land of China before and after the first-stage grain-for-green policy
- Comparisons of plant calcium fraction between two different vegetation zones in semi-arid region
- Effects of N:P ratio of Artemisia ordosica on growth influenced by soil calcium carbonate
- Seasonal dynamics of N:P ratio stoichiometry and Ca fraction for four dominant plants in the Alxa Desert
- Change in summer daily precipitation and its relation with air temperature in Northwest China during 1957-2016