Optimization of CNC cutting parameters using design of experiment(DOE)and desirability function
Ender Hazir •Emine Seda Erdinler •Kücük Hüseyin Koc
Abstract In this study,25( five factors at two-level factorial design)design of experiment was applied to investigate a set of optimal machining parameters to achieve a minimum surface roughness value for Abies nordmanniana.Wood specimens were prepared using different values of spindle speed,feed rate,depth of cut,tool radius,and cutting directions.Average surface roughness ( Rz)values were applied using a stylus.The objectives were to:(1)obtain the effective variables of wood surface roughness;(2)analyze which of these factors had an impact on variability in the CNC machining process;(3)evaluate the optimal cutting values within the range of different cutting levels of machining parameters.The results indicate that the design of experiment(DOE)based on the desirability function approach determined the optimal machining parameters successfully,leading to minimum Racompared to the observed value.Minimum surface roughness values of tangential and radial cutting directions were 3.58 and 3.21 μm,respectively.
Keywords Wood surface roughness·Optimization·
Introduction
Computer numerical control(CNC)used in the woodworking industry is applied in sanding,milling,drilling and cutting operations(Ohuchiand Murase2006).The advantages of CNC machines are enhanced productivity,flexibility of production and integration for automation systems(Albert 2009;Raja and Baskar 2011).In the furniture industry,CNC machining is one of the crucial stages as it affects coating and finishing performances such as waste reduction,adhesion strengths of coating,and aesthetics of wood materials(Cool and Hernandez 2011;Tan et al.2012;Ozdemir et al.2015).Moreover,surface roughness is a significant index of the manufacturing process and a quality characteristic for wood and wood-based materials.Although there are different methods for measuring roughness such as the use of laser,light scattering,and pneumatic techniques,stylus-type equipment is widely applied due to advantages in determining accurate numerical results(Hiziroglu 1996;Sandak and Tanaka 2003;Zhong et al.2013).
Surface roughness (Ra)is affected by CNC machining parameters involving feed rate,stepover,tool radius,spindle speed and depth of cut(Lu 2008;Sütçü2013;Deus et al.2015).In addition to these,anatomical structure and mechanical properties of wood materials,such as moisture content,hardness,density,annual ring variation,cell structure,early-late wood ratio and cutting directions,are other effective variables in this process(Taylor et al.1999;Gurau et al.2005;Kopac and Sali 2003).Considering all these variables,the selection of appropriate machining parameters is an important step to optimize the wood cutting process.Determination of the effective parameters and their optimum levels are investigated by an analytical approach providing minimum experimental trials at lower cost.Design of experiment(DOE)based optimization is a successfully applied methodology in engineering problems(Krimpenis et al.2014;Asiltürk et al.2016;Bhalamurugan and Prabhu 2015;Jacob and Banerjee 2016).The two-level and factorial-level are the most widely applied types of design(Bingöl et al.2015).The full factorial design technique investigates every possible combination for factor levels at two levels.The fractional design is appropriate for problems with a large number of factors(Montgomery 1997).Gaitonde et al.(2008)optimized the delamination of medium-density fiberboard(MDF)using the Taguchi design.According to this work,delamination decreased as the feed rate decreased and the cutting speed increased.Coelho et al.(2008)applied the Taguchi design for investigating the effects of wood cutting parameters such as depth of cut,rotation speed,and feed speed for minimizing surface roughness.Davim et al.(2009)looked at the function of CNC machining parameters for MDF such as feed rate,spindle speed and cutting speed on surface roughness.The results showed that spindle speed was a significant factor.Samples with smoother surfaces were the result of higher feed rates and spindle speeds.Prakash and Palanikumar(2010)used the Taguchi method to determine drilling parameters for MDF such as tool diameter,spindle speed and feed rate.Feed rate was found to be the most effective parameter for MDF surface quality.Wilkowski et al.(2011)employed the Taguchi method to investigate CNC cutting parameters for two different wood materials.The machining factors feed rate and spindle speed were found as effective variables for wood surface quality.A mathematical model for the cutting force(Fc)of MDF with an uncoated carbide insert was developed by Norazmein et al.(2012).The model was determined by conducting the Box–Behnken design(BBD)and response surface method(RSM).The processing parameters were routing width,cutting speed,and feed rate.According to the results,higher cutting force was found with higher routing widths,lower cutting speeds and higher feed rates.
Similar to the previous study,Sütçüand Karagöz(2012)determined the same CNC cutting parameters,including depth of cut,spindle speed,stepover and feed rates on surface roughness and material removal rate(MRR).As the result of this work,surface roughness decreased by increasing the depth of cut,feed rate,stepover and spindle speed.The most effective factor for material removal rate was spindle speed.Deus et al.(2015)optimized the milling parameters of MDF such as depth of cut,spindle speeds and feed rates.According to their study,a minimum surface roughness value was obtained with a 1 mm depth of cut,high spindle speed and low feed rate.
Sofuoglu(2015)investigated the influence of tool clearance strategy,cutter-type feed rate and spindle speed for surface quality of European larch(Larix deciduaMill).Optimization of these variables was performed with the Taguchi design.RaandRzwere determined by ANOVA analysis.Rzdecreased 1.8 times andRa2.2 times compared to the initial machining factors.
However,there is a lack of information on determining optimum processing parameters for machining.In this study,in contrast to those reported in literature:(1)25factorial design was performed to determine the variables;(2)Pareto analysis was applied to measure the process variability;(3)mathematical models were developed using multilinear backforward elimination regression;(4)desirability function was employed to obtain optimal levels for minimizing surface roughness.
Materials and methods
Materials
Wood specimens ofAbies nordmanniana(200 mm×
100 mm×30 mm)from Turkey were selected as test material.Ninety-six specimens were conditioned at(20± 2)°C and 65± 5%relative humidity.Moisture content of the wood samples was measured at 12±1%after room conditioning.
Roughness measurements and machining conditions
Experiments were conducted on a 3-axis CNC router integrated with an Alpha-CAM program.Taylor-Hobsan Suftronic equipment used to determine surface roughness values.This is a stylus-based portable profilometer with a diamond stylus with 90°contact angle and 5-μm radius to take surface specimens.Before measuring the samples,the equipment was calibrated using standard specimen roughness values to provide consistency and accuracy.In accordance with ISO 4287(1997),two different roughness parameters,average roughness (Ra)and mean peak to valley height (Rz),are used to determine the surface quality.
Experimental procedure
This experimental procedure involved 6 phases to obtain optimal machining conditions for minimizing the roughness value(Fig.1).The phases were as follows:
1. The process parameters were selected for various cutting conditions:depth of cut(d),feed rate(f),spindle speed(n),tool radius(r)and cutting directions.
2. The experimental design used for conducting the experiment consisted of two levels, five factors and three replicates(25×3).

Fig.1 Schematic diagram of experimental procedure
3. Interactive and effective factors were analyzed using Pareto and ANOVA analysis.These plots were employed to determine the relationship between the input and output variables.Multiple regression analysis was used to evaluate the experimental data.
4. Mathematical models were developed for optimizing and predicting the surface roughness.The models performed statistically byFtest at probability levels(p<0.05).Verification of the models used(R2),(R2-adj),and normal probability plot(NPP).Non-significant variables were determined by using the backforward elimination regression method.
5. Pareto ln (SD)analysis determined the process variability.
6. The effective variables were optimized using the desirability function with the Minitab software.The optimum processing condition values were compared with real experimental data.
2kfactorial design
This is a method that investigates the significant parameters to a response(Montgomery 1997)and is efficient and ideal for determining the effective parameters.Since it is a statistically based method,it also evaluates interactions between the effective variables as it is not possible to evaluate these by a classical experimental design(Antony 2014).In addition,this design has several advantages such as fewer experiment trials and data analysis using graphical methods.It also investigates all combinations of the factor levels more effectively than the traditional design,namely one-variable-at a-time(OVAT)(Bingöl et al.2015).The mathematical model is another advantage of this design.The coded equation for 2kfactorial design is presented in Eq.1 as follows:

where βiis the regression coefficient and β0is the average response in an experimental procedure.ε is the random error and is approximately normal and independently disturbed with a mean of zero and constant variance.The model coefficient βijindicates the interaction between χiand χj(Montgomery 1997).The uncoded variables are transformed into coded variables and are given in Eq.2:

The term of χ is the coded and χ is the natural variable.χmaxand χminare the highest and the lowest values of natural variable(Myers et al.2009).
In this study,cutting variables such as cutting direction,tool radius,feed rate,depth of cut and spindle speed were found to be the independent variables.Process parameters were obtained by applying 25factorial design.The variables coded as(-1)and(+1)are shown in Table 1.
Five factors at two level(25)design in each trial with three replicates,making a total of 96 test runs,were performed for determining each response.To obtain an accurate estimate of the experimental error,each trial condition was applied in random order.The experimental design was performed with the factorial design matrix given in Table 2.

Table 1 CNC parameter relations

Table 2 Experimental design
Results
Statistical result
A 25factorial design was employed to determine the main effect and two–three way interaction effects.Theeffective factors were analyzed using ANOVA and theFtest to investigate the following for each parameter in Eqs.3 and 4:
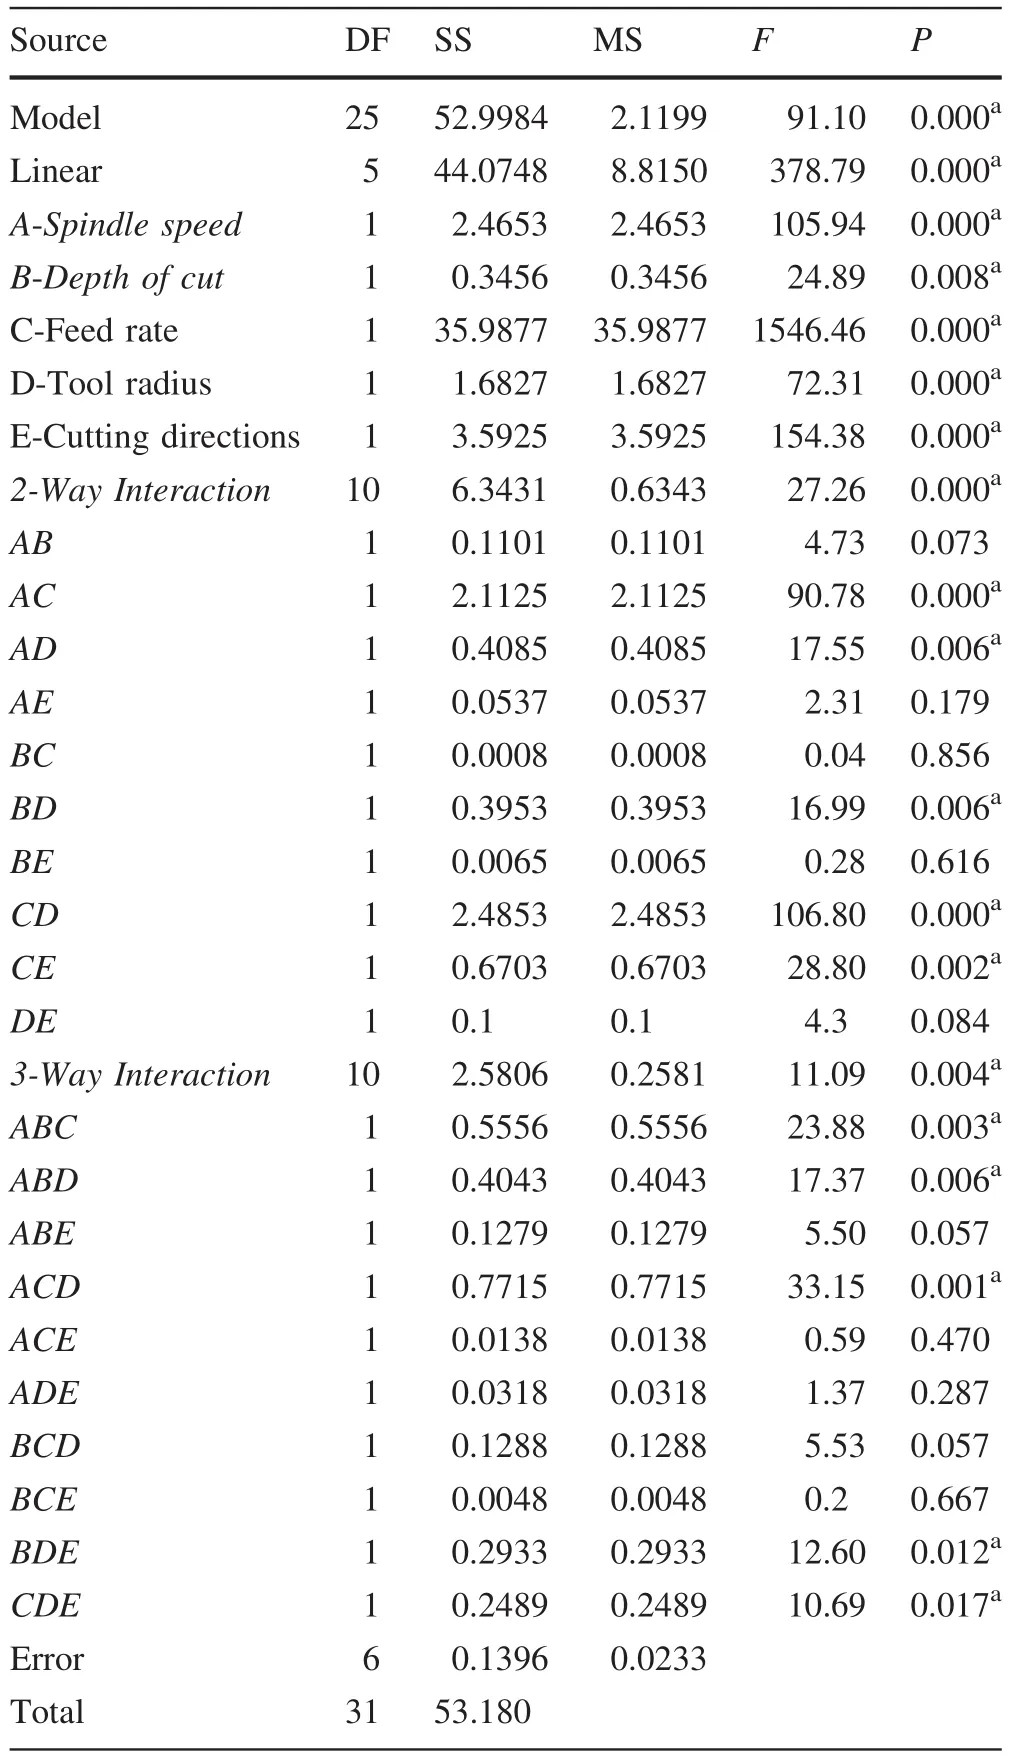
Table 3 ANOVA results for Ra

Fig.2 Pareto chart for the effective factors

Fig.3 Main effect plot of the factors for Ra

TheFvalue is found by:

The terms(α -1)and(N- α)stand for the degree of freedom and the error degree of freedom,respectively.MSAandMSEindicate the sum of the squares of the means and errors,respectively.WhenF0is higher than the critical value ofFα,α-1,N-1and where α is the level of significance,the null hypothesis is rejected(Saleem and Somá2015).Table 3 showed the analysis of variance for these five factors and the values ofFandP.Values of ‘‘prob.> F’’are lower than 0.05 showing that the equation terms are significant.The variables A,B,C,D,E,CD,AC,CE,AD,BD,ABD,BDE,CDE,ABC and ACD were effective parameters on the CNC machining process.
Evaluation of main effects
The importance of main and interaction effects is shown in Fig.2.The vertical line in the Pareto chart displays the statistically significant effect on the response for 5%significance level(Antony 2014).Any effect that ranges past this datum point is potentially important.The Pareto plot demonstrated that the main effects of A,B C,D,E and the interactions of CD,AC,CE,AD,BD,ABD,BDE,CDE,ABC and ACD were statistically significant at the 5%level on surface roughness.
The main effects factors are illustrated in Fig.3.The surface roughness value was affected by each level of parameters.A higher spindle speed,lower depth of cut,lower feed rate,lower tool radius and tangential cutting directions should be used for minimizing surface roughness.The slope of the parameters is not horizontal,showing that the variables affected surface roughness.The feed rate affected the machining process because the slope of variables is steeper,and this is denoted in Fig.3.The results were performed using ANOVA analysis.
Evaluation of interaction effects
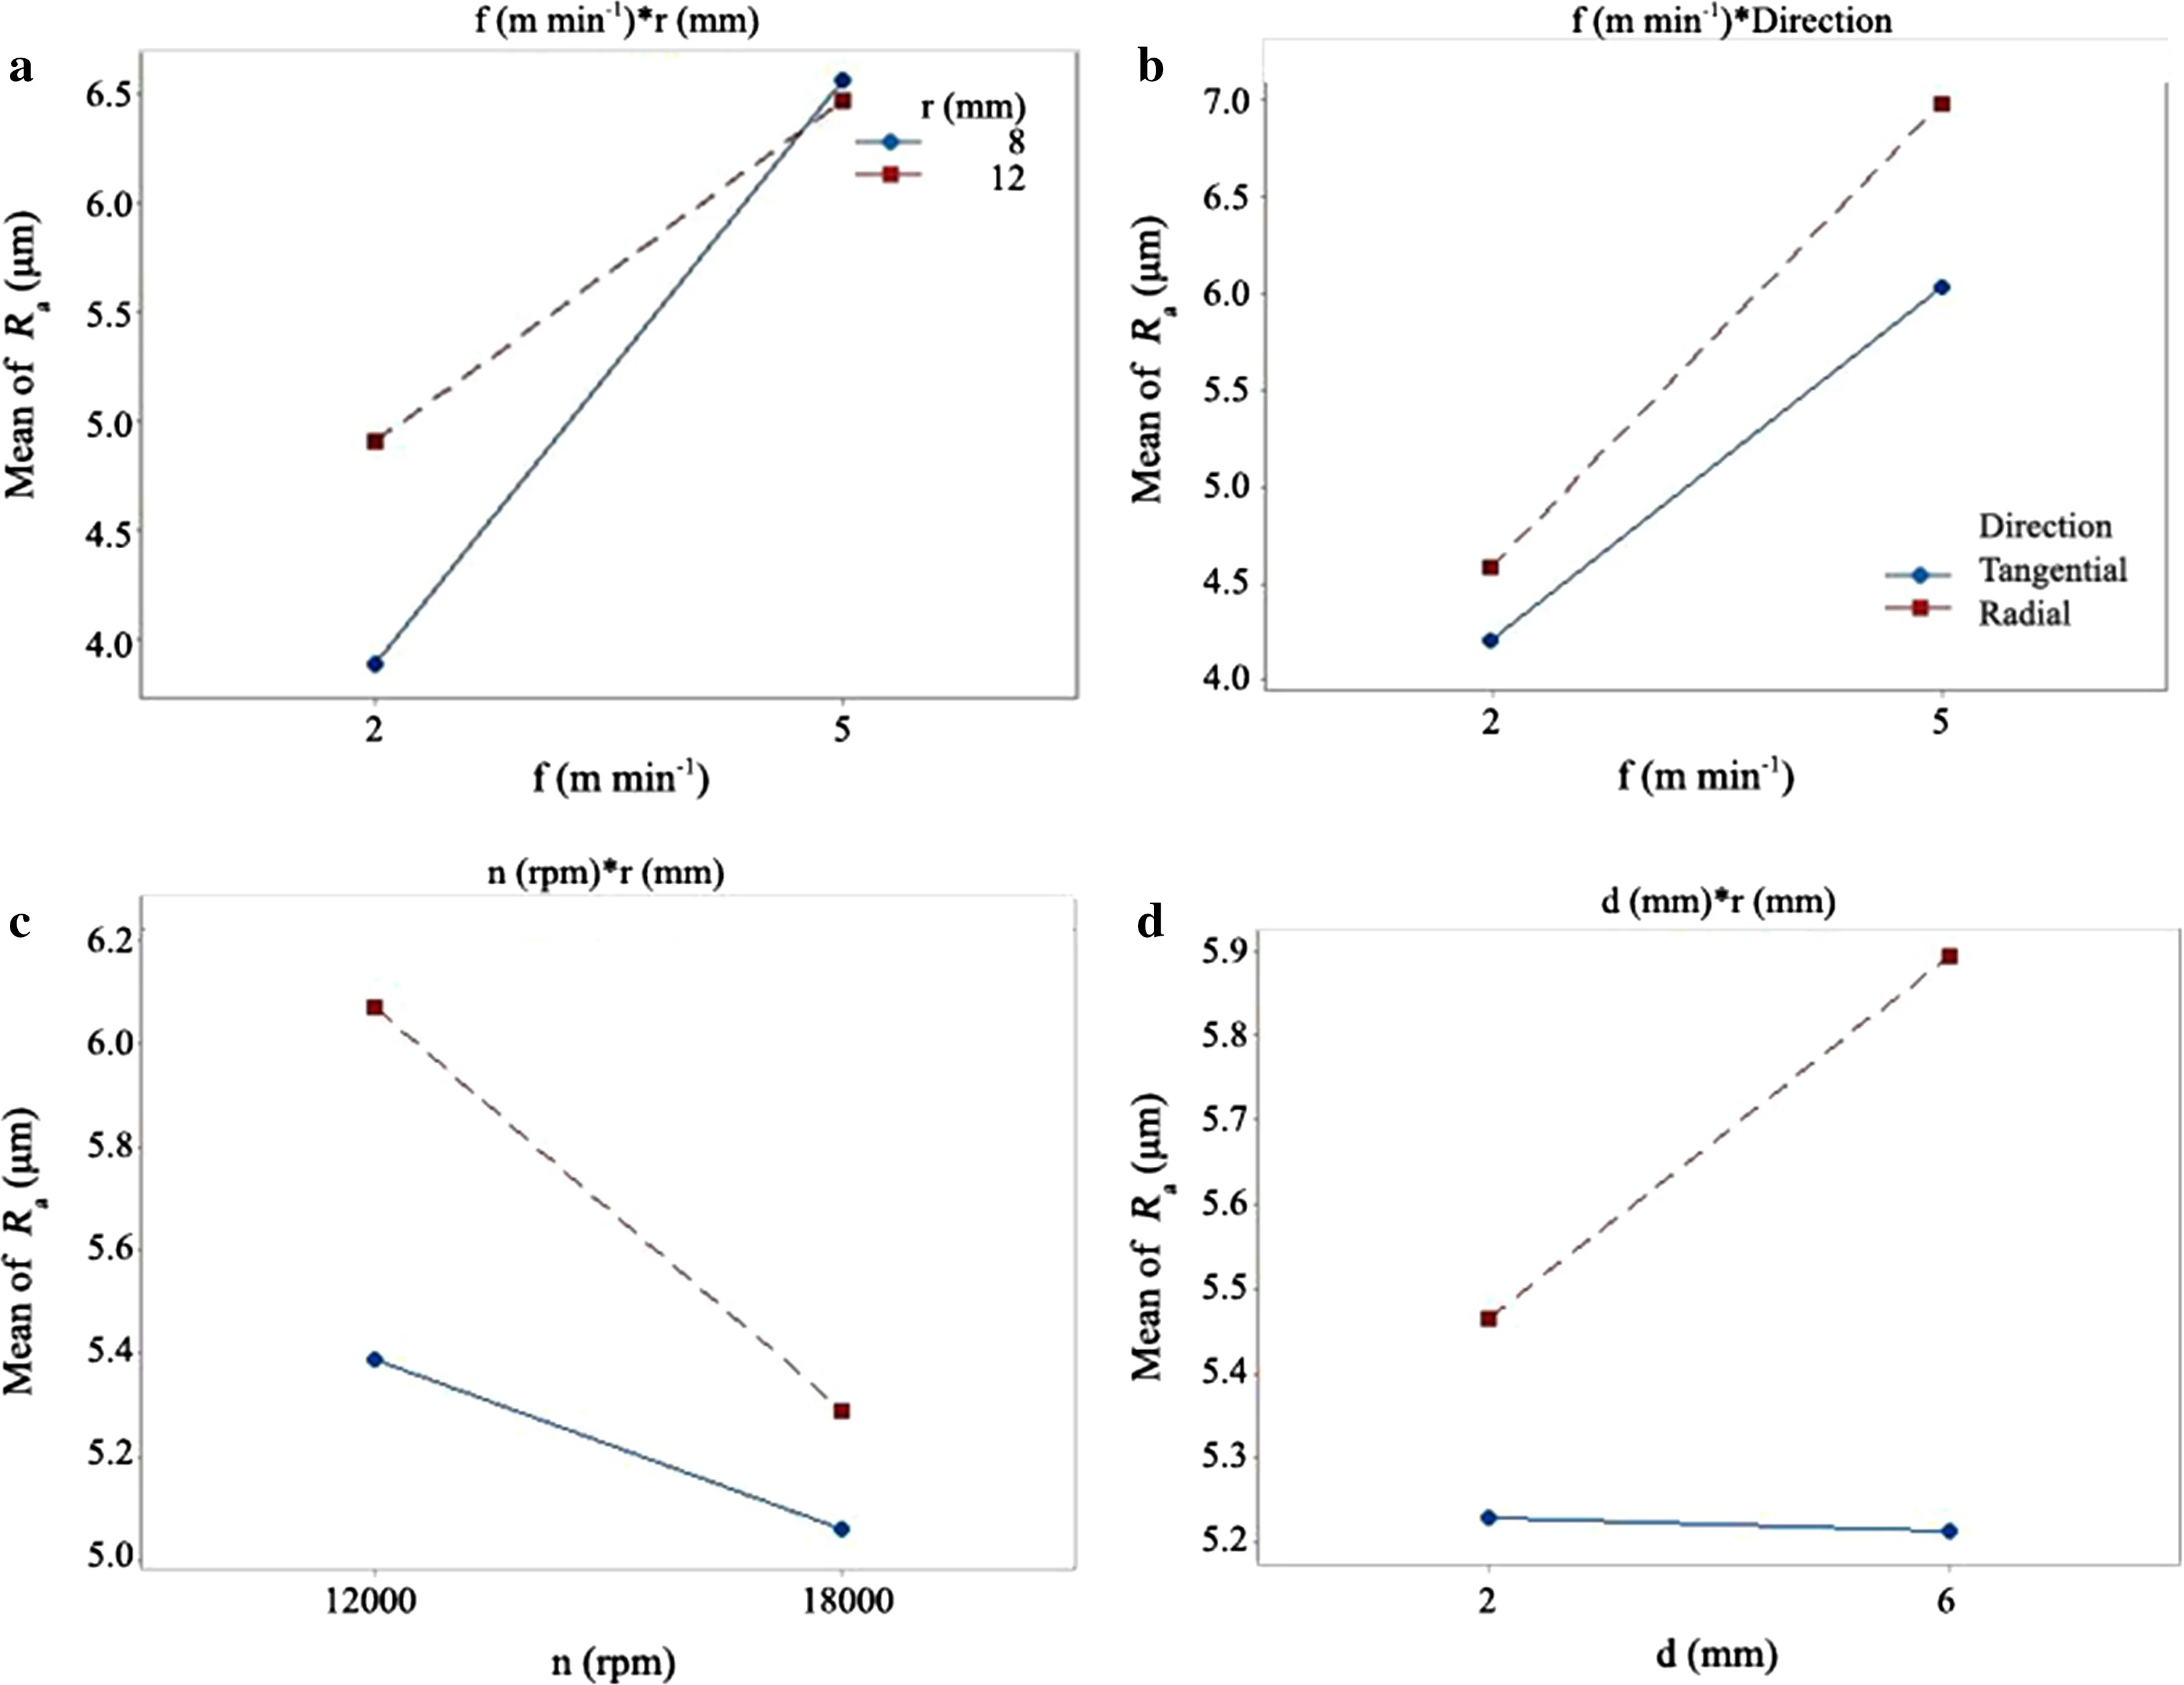
Fig.4 Interaction between a feed rate and tool radius;b feed rate and cutting direction;c spindle speed and tool radius;d depth of cut and tool radius for Ra
The two-way interactions plots are shown in Fig.4 and indicate that the one factor has impact on other factors.From Fig.4a,surface roughness increased with higher feed rate and lower tool radius.The interaction effect between tool radius and feed rate were significant parameters on wood surface roughness.Figure 4b,shows that surface roughness decreased with lower feed rate when the cutting direction was tangential.The results were verified from the ANOVA in Table 3.A smoother surface was obtained with higher spindle speed and lower tool radius(Fig.4c).Figure 4d shows that surface roughness decreased with lower depth of cut and lower tool radius.According to the results,the interaction effects were significant on the CNC machining process. In addition,surface roughness decreased with lower tool radius,higher spindle speed,lower feed rate,lower depth of cut,and tangential cutting direction.The results obtained the main effect plot displayed in the analysis of main effects section.
Determination of process variability
The machining process factors that affect variability were investigated using a design matrix with ln(SD)as the surface roughness(Table 4).This matrix was used to minimize the response variability for optimization problems(Antony 2014).
The ln(SD)Pareto plot was employed to evaluate the main and interaction factors that affect variability of the surface roughness.Figure 5 shows that the main effect of feed rate(C)and the interaction between feed rate(C)and depth of cut(B),and the interaction between spindle speed(A)and tool radius(D)had significant impact on variability in the machining process.
Figure 6a,b display the interaction between depth of cut(B)and feed rate(C),and the interaction between spindle speed(A)and tool radius(D).The interaction of BC and AD are strong as shown in the graphs.In Fig.6a,the variability on surface roughness was a minimum low level B and C application.The variability on the CNC machining process decreased with higher spindle speed and lower tool radius(Fig.6b).
In order to determine the optimal cutting condition for the CNC process,both response mean and variability on the process were analyzed.The best combinations for minimizing surface roughness and variability are given in Table 5.The optimum parameters were obtained by analyzing the mean of surface roughness and mean ln(SD)values at high spindle speeds,low depths of cut,low feed rates,low tool radius and in a tangential cutting direction.

Table 4 Coded design matrix with variability as Ra
Validation of the model
Normality assumption was performed by plotting the histogram of residuals and normal probability.In Fig.7a,the error indicates normal distribution as the residuals fall along a straight line.Figure 7b indicates that the residuals resembled a normal distribution.Figure 7c and d display the residuals falling in a horizontal band and residuals without any pattern.Instead of ordinary residuals,standardized residuals were used for identifying the outliers.The residualsdiwere calculated by Eq.5:

Mathematical models of cutting directions
These models were developed to determine optimal values of machining conditions leading to minimum values ofRa.A multilinear backforward elimination regression analysis was used to remove the non-significant factors in the models.The adequacy of the equations was determined usingR-square and Adj-R-square values.R-square values of 98.17 and 95.60 were found in tangential and radial cutting directions,respectively.Adj-R-square values of 96.07 and 91.75 were calculated for tangential and radial cutting directions,respectively.These results indicate that there were high correlations between observed and predicted values.The models for formulating the optimization problem for tangential and radial cutting directions are given in Eqs.6 and 7.
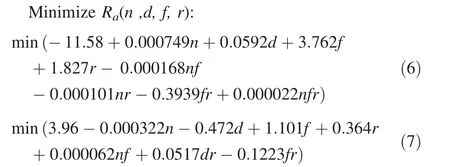
These fitness functions were optimized within the specified range selected in Table 1 and are Eqs.8a,8b,8c and 8d.

Optimization using desirability function
The desirability function technique is one of the most widely used engineering applications for parameter optimization(Palanikumar et al.2008).According to this function,the measured quality characteristics of every predicted response are transformed to a dimensionless desirability value.The value of the function is the range betweend=0 andd=1.The value ofdincreases as the desirability of the corresponding response increases(Palanikumar et al.2008).In this study,the transformation of wood surface roughness value was selected as the‘smaller-the-better’quality characteristic.Therefore,the selected equation is given by Eq.9:where,Tis the target value of theith response,yi,Lthe acceptable lower limit values,Uthe acceptable upper limit for this response and ω represents the weight.From the results shown in Fig.8a,b,the minimum surface roughness values for tangential and radial cutting directions were 3.58 and 3.21 μm,respectively.

Fig.5 Ln(SD)Pareto chart for the effective factors

Fig.6 Interaction between a depth of cut and feed rate;b spindle speed and tool radius for standard deviation(SD)

Table 5 Minimum surface roughness and variability

Based on the findings in the experimental design,spindle speed,depth of cut,feed rate and tool radius values of 18,000 rpm,2 mm,2 m min-1and 8 mm were determined to be optimal machining conditions,respectively,for tangential cutting direction samples.Corresponding values for the radial cutting direction were 18,000 rpm,6 mm,2 m min-1and 8 mm.
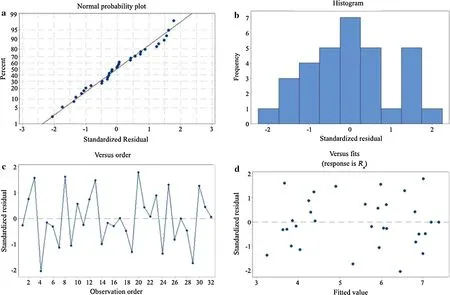
Fig.7 a Normal probability plot for standardized residuals;b histogram of standardized residuals;c versus order for standardized residuals;d versus fits for standardize residuals
Discussion
Determination of effective parameters
Spindle speed,depth of cut,feed rate,tool radius and cutting directions were identified as the effective parameters on surface roughness by employing Pareto and ANOVA analysis.Figures 2 and 3 illustrate that the variables were significant factors on wood surface quality.The feed rate was the most significant variable.In Fig.4,the interaction of CD,CE,AD and BD were effective factors.The results were verified by Pareto and ANOVA analysis and are compared with the data in Table 6.
Prakash and Palanikumar(2010)found that the parameter of feed rate highly affected surface roughness of MDF,while Davim et al.(2009)reported that spindle speed was the significant parameter forRaof MDF.In the present work,feed rate and parameter interactions were found as significant factors.
Analysis of process variability
As shown in Fig.5,C and interaction of BC and AD were found to be the most effective factors on the process variability by using ln(SD)Pareto analysis.According to Fig.6a,b,for determining the minimum surface roughness and minimum variability values,the optimal machining condition should result in higher spindle speeds,lower depths of cut,lower feed rates,lower tool radius and with a tangential cutting direction.These results are given in Table 3.As seen in Table 6,there are no examples of studies on the process variability.
Determination of optimal processing parameters
In the present study,Fig.6a,b shows the minimumRavalues of tangential and radial cutting directions as 3.58 and 3.21 μm,respectively.These results were compatible with Table 5 and Fig.4.In this case,mathematical models were recommended both for prediction of variables with different levels and for optimization of the parameters.
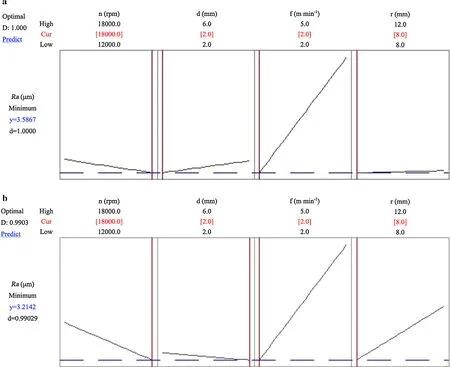
Fig.8 a Optimum levels of tangential direction;b optimum levels of radial direction

Table 6 Comparison of the results in the literature
Theoretically,to validate the findings of the approach in this study,the optimal cutting parameters values of the desirability function were used in the regression model Eqs.10 and 11,wherenis an optimal solution of the spindle speed,dan optimal solution of the depth of cut,fan optimal solution of the feed rate,andran optimal solution of the tool radius of tangential and radial cutting directions.
The function results were calculated in Eqs.10 and 11.
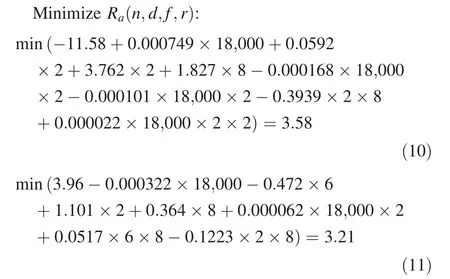
The optimal processing parameter values were transformed into the fitness function equations.The objective functions value of 3.58 and 3.21 μm were found for tangential and radial cutting directions,respectively.These values were verified by the desirability function for tangential and radial cutting directions.They were similar to the recommended optimum values in Table 5.From Table 6,there was little information for determining the optimum processing parameters and process variability for furniture industries.In this study,in contrast to the literature,mathematical models were developed based on the 25factorial design and desirability function methods for solving the wood surface roughness problem.
Conclusion
The 25factorial design-based optimization approach was used to find the effective variables and optimal levels for minimizing theRa.Four machining parameters,spindle speed,depth of cut,feed rate and tool radius,were selected as continuous variables with the cutting directions identiif ed as discrete variables.
According to the results,the conclusions are as follows:
1. The processing factors were determined using design of experiment approach.Interactions and main variable effects were highly effective for the smoother wood surface;
2. ANOVA and Pareto analysis demonstrated that feed rate highly affected wood surface roughness.Moreover,minimum process variability was investigated with higher spindle speeds,lower depths of cut,lower feed rates,lower tool radius and using tangential cutting directions;
3. Since the wood specimen is a heterogeneous structure,cutting directions were significant factors.For this reason,two different mathematical models were developed for radial and tangential directions;
4. Mathematical models were developed using the backforward elimination regression method to determine non-significant factors.As the models have highR2andR2-adjusted values,the equations are statistically significant for the machining parameters;
5. Minimum surface roughness values of 3.58 and 3.21 μm were obtained for tangential and radial cutting directions,respectively;
6. Results of spindle speed,depth of cut,feed rate and tool radius values of 18,000 rpm,2 mm,2 m min-1and 8 mm were considered as optimum machining conditions,respectively,for tangential cutting direction samples.Corresponding values for the radial cutting direction were 18,000 rpm,6 mm,2 m min-1and 8 mm.
 Journal of Forestry Research2018年5期
- Journal of Forestry Research的其它文章
- Environmental load of solid wood floor production from larch grown at different planting densities based on a life cycle assessment
- Variability in physical properties of plantation-grown progenies of Melia composita and determination of a kiln-drying schedule
- Reduction of electric field strength by two species of trees under power transmission lines
- Forest type identification by random forest classification combined with SPOT and multitemporal SAR data
- Forest mapping:a comparison between hyperspectral and multispectral images and technologies
- Genetic variation of height growth rhythm between clones of Larix kaempferi×L.gmelini based on logistic models
