Genetic variation of height growth rhythm between clones of Larix kaempferi×L.gmelini based on logistic models
Chunming Li•Hui Xia•Hui Bai•Hongmei Wang•Yajuan Xing•Xiyang Zhao•Xiaomei Sun
Abstract Fifty-three larch interspecific hybrid clones(Larix kaempferi×L.gmelini)and their parent clones were used for growth curve analysis of height variations.The growth curves of the 55 clones were ‘S’-shaped and 36 exhibited similar curves as the male parent.The coefficients of the logistic models were higher than 0.943,indicating that our results were effective in the simulation of the growth curves.ANOVA analysis showed significant differences in height of different clones(P<0.01).Average date of maximum height growth was Day 173,and average duration of rapid growth lasted for 50 days.Annual average increase in height was 9.7 cm d-1and daily average increase was 0.2 cm.The ratio of GR to the total annual increase in height ranged from 51.2 to 68.8%,with the average being 59.8%.There was a positive correlation between k values and plant heights which benefited from the evaluation of early plant height.There was also a positive correlation between GR(growth stage),GD(plant height)and annual increase in height.These results are informative to the evaluation of the elite clone selection and provide a theoretical basis for breeding and management.
Keywords Larix kaempferi× L.gmelini·Hybrid clones·Logistic modeling·Plant height variation
Introduction
Larch(Larixspp.)is one of the most important economic species and is widely distributed in China.It has been widely utilized for its excellent wood quality,adaptability and rapid growth(Guan et al.2014).Plant growth,rhythm and variation were important parameters to supplement the theoretical basis for the early evaluation of adaptation and stress resistance(Sun et al.2008;Lai et al.2014).Growth is affected by environment and genotypes(Fang et al.1999),and displays an S-shape curve which can be divided into three stages:initial,exponential,and steady(Xing et al.1998).Growth is different at different stages,and management practices will result in different effects on growth and directly affect quality.Thus,management strategies are needed for effective cultivation and management of plants of different ages(Fu and Miao 1996;Fu et al.2001).Mathematical modeling has been increasingly used to simulate growth processes(Zamudio et al.2008)to help in the development of forestry management strategies(Yu 1989).Logistic modeling is a core theory used to describe population growth for several years(Yu 2003).Many studies show that logistic modeling can nicely fit growth curves.For example,the simulation coefficiencies of logistic models were higher than 0.88 in hybrid clones ofPopulus tomentosaCarr.(Zhao and Zhang 2013),transgeneP.simonii×P.nigraclones(Liu et al.2014),P.aigeirosDuby clones(Qin and Jiang 2004)andMagnolia lilii floraDesr.clones(Shen et al.2005).This suggests that logistic modeling is effective in predicting plant growth and could provide guidance in the development of early management practices.
In this study,logistic modeling simulated the growth curves and the variation in growth was recorded.The objectives were to:(1)compare growth traits of differentLarixclones;(2)predict the effects of the logistic model;and,(3)provide the theoretical basis for management.
Materials and methods
Materials
The 53 full-sib interspecific hybrid clones and two parent clones(L.kaempferi(LM5)andL.gmelini(LM9)used as female and male parents)are listed in Table 1.
Experiment methods
In 1978,cross experiments were carried out and seeds were sowed the following year.In 2013,53 hybrid clones were propagated by the medulla method(two thousand seedlings of half-sibL.kaempferifamilies of two-year-old stock)and all clones were cultivated in a greenhouse under the same conditions.In 2014,30 vigorous and phenotypically normal plants were selected from each clone for time course measurements of plant heights.The first measurement was taken in May 30th,2014 which was Day 152 of one year.Thereafter,height measurements were taken once every 10 days until Day 242 for a total of 10 set measurements.
Statistical analyses
These were carried out using the statistical package for social sciences(SPSS;version 13.0).The significance of fixed effects was determined by analysis of variance(ANOVA)Ftests.Variations among clones at different times were determined by ANOVA according to Hansen and Roulund(1997)as follows:

where yijis the performance of an individual of cloneiin yearj,μ is the overall mean,αiis the clone effect,βjis the time effect,αβijis the random effect of cloneiin timej,and εijis the random error.
The logistic formula was used to fit the progress of annual growth and the logistic equation was(Yang 2006):

whereyis the accumulative growth in height;tthe time for growth;kthe extreme value of annual t height growth and calculated as in Eq.(3)(Zhang and Ge 1994;Zhou et al.2004),whileaandbare two parameters calculated with the SPSS;the values of b0and b1are derived from a and b using Eqs.(4)and(5)(Dong 2007;He et al.1997):

wherekis the extreme value of the traits,y1,y2and y3are the corresponding values of height at three different times(t1,t2and t3)with 2t2=t1+t3.
By calculating the second derivative for the Eq.(1),when d2y/dt2=0,and then t0=ab-1,where t0is the date of the maximum height growth,i.e.,the rapid growth time point.
By calculating the third derivative for the Eq.(2),the result is:
where t1and t2are the beginning and end date of the rapid height growth stage.
The phenotype correlation rA(xy)of traits x and y is calculated as(Pliura et al.2007):

Results
Analyses of height growth
ANOVA analyses of tree height are shown in Table 2.The variance among different clones,time and the interaction effects of clone×time were all remarkably significant(P<0.01).
Growth model construction of annual height growth for all clones
Using logistic Eq.(1)to simulate the process of height growth,all the growth curves of the 53 clones were ‘S’-shaped,for example,the results of the hybrid clones L57 and L11(Fig.1).The growth models of all clones were constructed with the help of Eqs.(2),(3)and(4),and are shown in Table 3.The coefficiencies were significantlyhigher than 0.943,and the measured heights were close to thekvalues which indicates that our logistic modeling was effective in the simulation of growth curves for plant height.
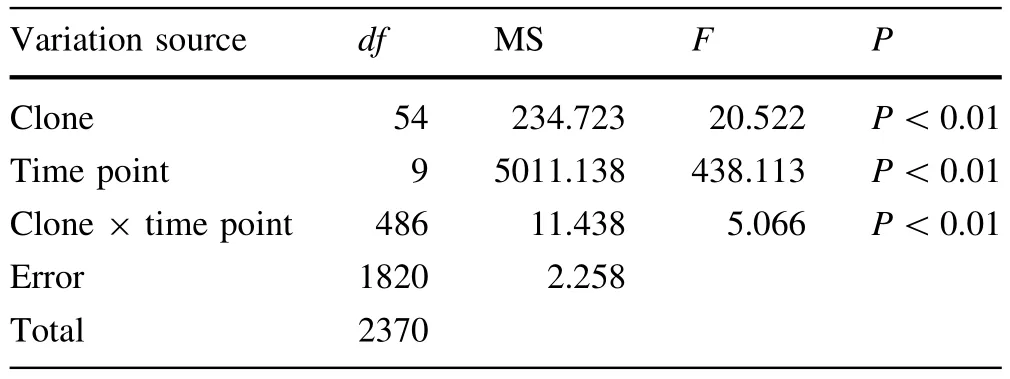
Table 2 ANOVA analysis of seedling height

Fig.1 Simulated curves of height of hybrid clones L57(left)and L11(right)
The simulated curves for the two parent clones were different from each other(Fig.2).The curves for the 53 hybrids were also different from each other,with clones being similar to the male parent and 17 clones similar to the female.
Relationship between plant heights and k values
The correlation coefficients of heights andkvalues are significantly positive(Table 4).
Analysis of growth stages and growth parameters
According to the time point t1,t2and t0,the growth stages were divided into three parts and the specific parameters are shown in Table 5.The average of t1,which was the beginning of the rapid growth stage,was Day 148.Clone L55 was the first into the rapid growth stage with t1being Day 126,while clone L57 was last with t1being Day 172.The average of t2,which was the end of the rapid growth stage,was Day 198.The clones L10 and L54 terminated this stage at Day 177,while clone L45 finished at Day 242.The average date of t0,the date of maximum height growth,was Day 173,with lone L55 beginning at Day 154 and clone L45 at Day 199.
The duration of the rapid growth period(RR)varied among the different clones.The average RR value was 50 days with clones L56 and L39 being the shortest at 27 days and clone L45 the longest at 84 days.During the RR,the average daily increase in height(GD)was 0.21 cm.The fastest growing clone was L11 with a GD of 0.47 cm,and the slowest were L55 and LM5 with GDs of 0.09 cm.The annual increase in heights during the rapid growth stage(GR)ranged from 5.08 to 21.97 cm·d-1with the average being 9.72 cm·d-1.The ratio of GR to the total annual increase in height(RRA)ranged from 51.2%to 68.8%,with the average being 59.8%.
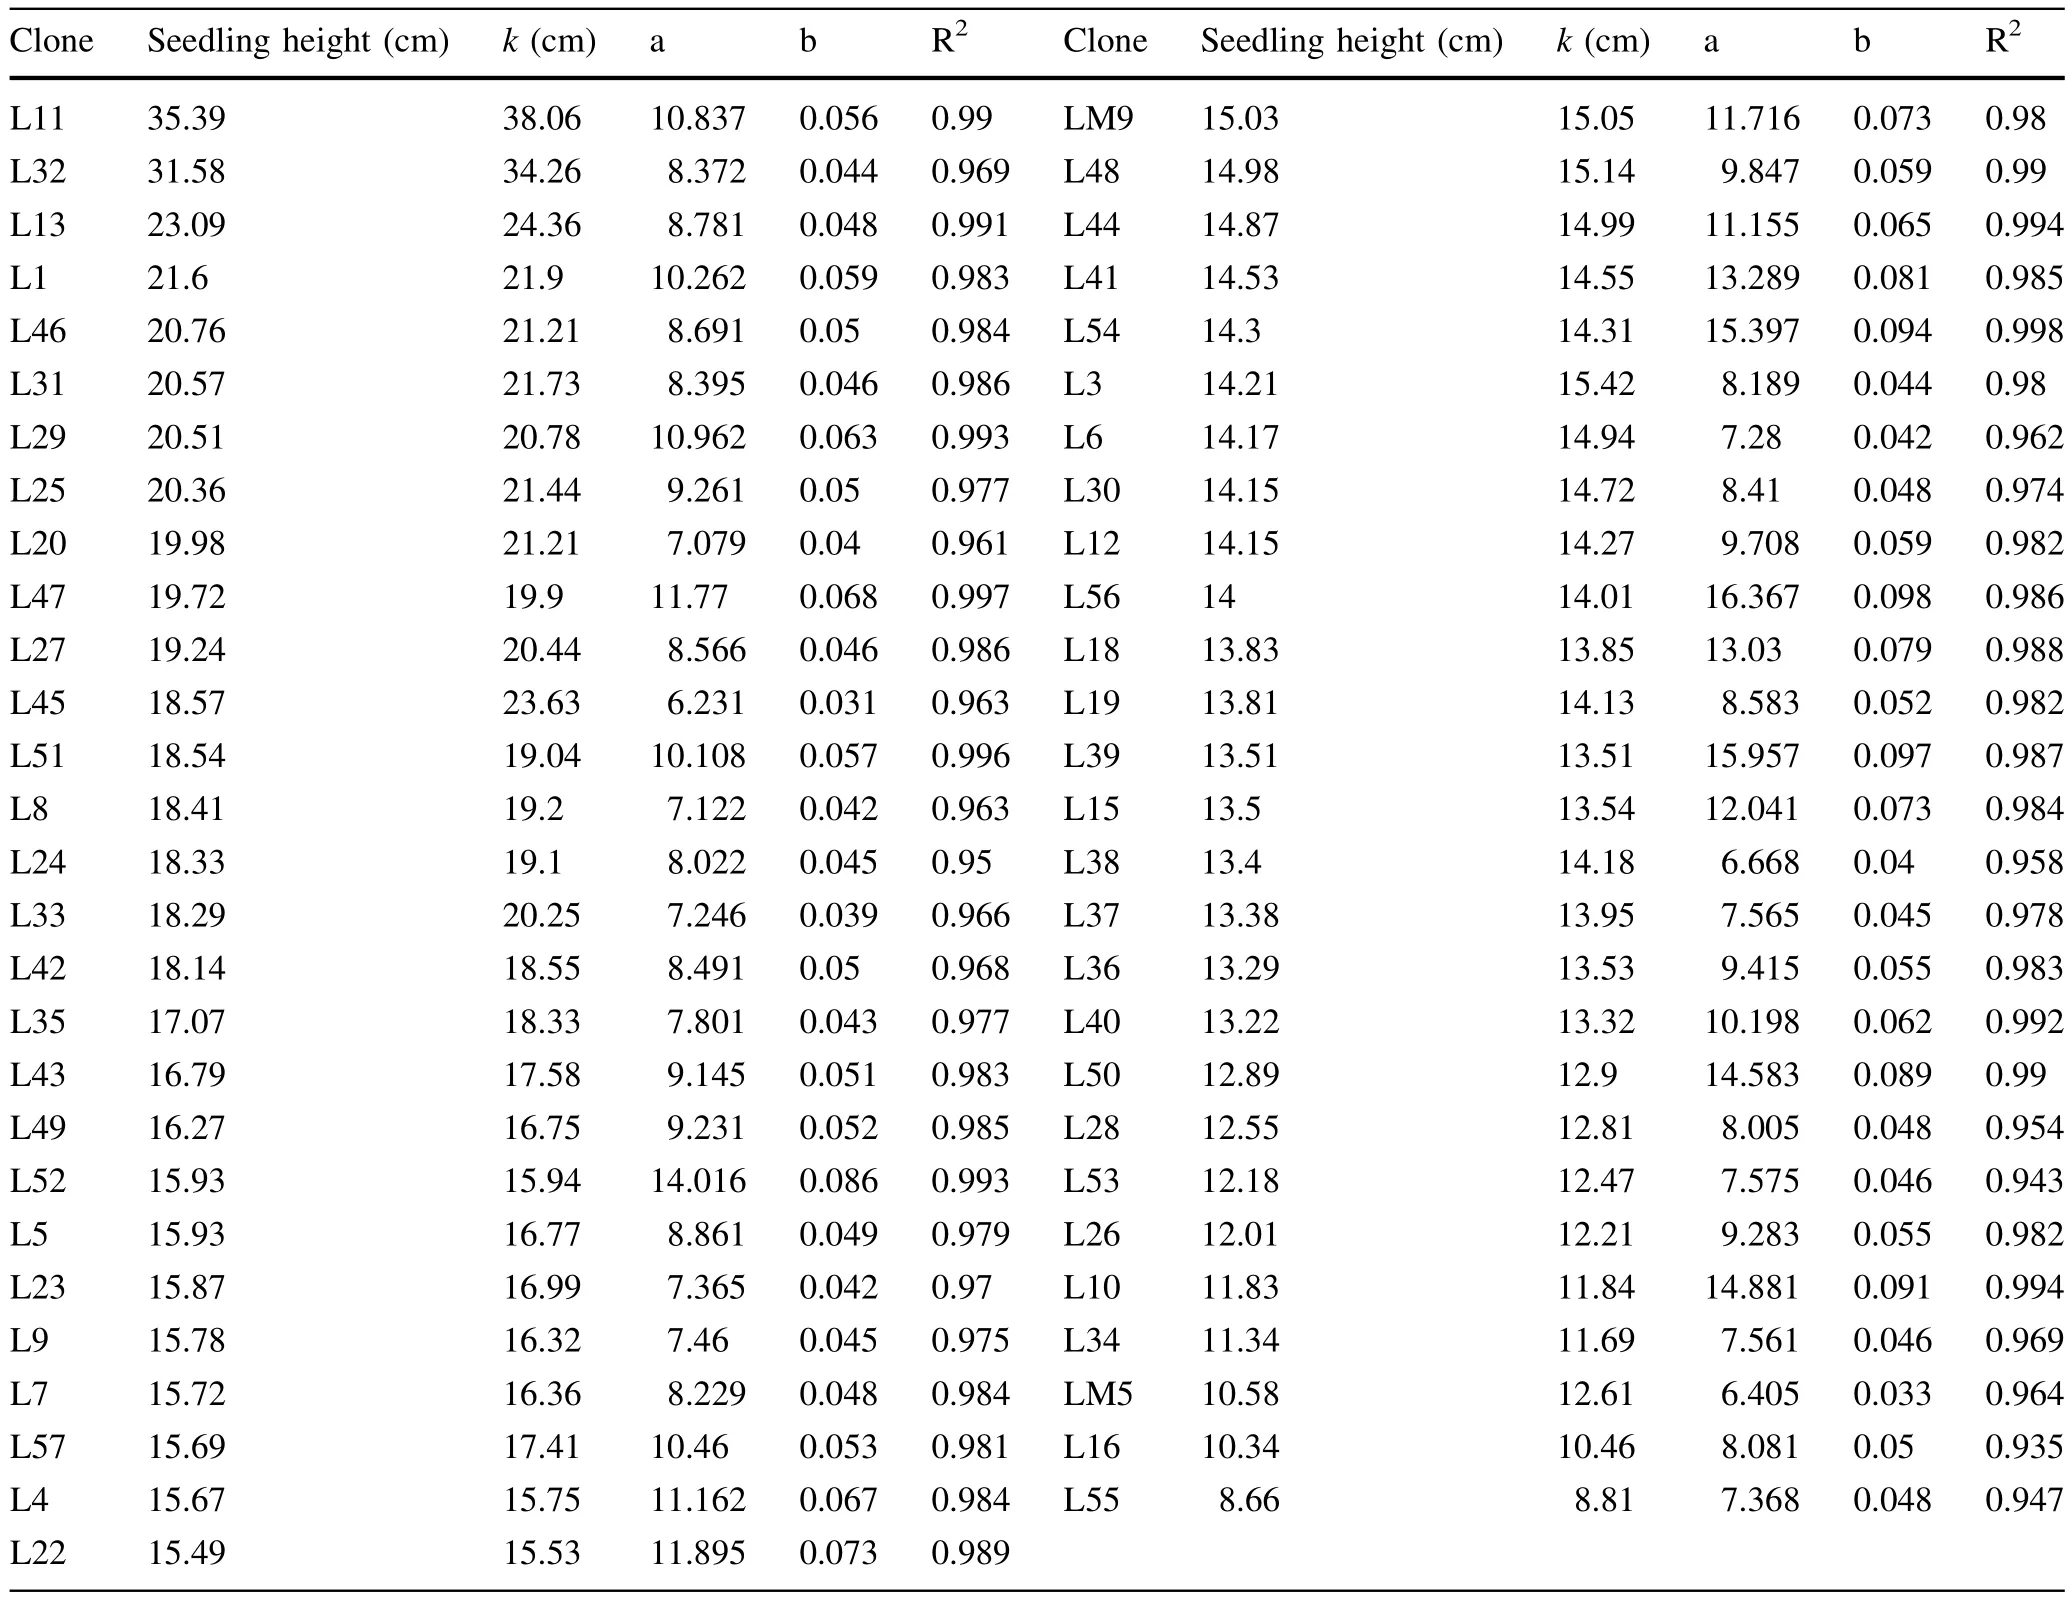
Table 3 Logistic modeling analysis of seedling height of 53 hybrid clones and their parent clones

Fig.2 Simulated curves of height of the male(LM9;left)and female(LM5;right)parent clones d,day
Correlation analysis of growth parameters during GR and annual increase in height
The results of the analysis between annual height increase(H)and the growth parameters t0,t1,t2,RR,GD,GR and RRA are shown in Table 6.All of the coefficienciesbetween H and each parameter were significant except for H and RR and H and RRA.The positive correlation between H and RR was not significant and there was a negative correlation between H and RRA.

Table 4 Correlation analysis of heights and k values
Comparison of the growth process of all clones
Using the clones L11 and L55 and the parent clones LM9 and LM5 as examples,we analyzed the growth varianceamong the different clones(Fig.3).The GR and GD of L11 were 21.97 cm and 0.47 cm·d-1respectively,which were larger than for the other three clones.The RR of L11 was 47 days but the height was 35.39 cm,which was the highest.The RR of LM5 was 80 days and longer than for the other clones,but its height was only 10.58 cm due to its small GR(7.28 cm)and GD(0.09 cm·d-1).Even though the GD of clone L55 was the same as LM5,its RR,GR and height were only 55 days,5.08 cm and 8.66 cm,respectively.The RR of LM9 was only 36 days,which was shorter than for L11.Height of LM9 was just 15.03 cm due to its small GR(8.69 cm)and GD(0.24 cm·d-1).These results show that height is closely correlated with GR and GD,as shown by the correlation analysis.
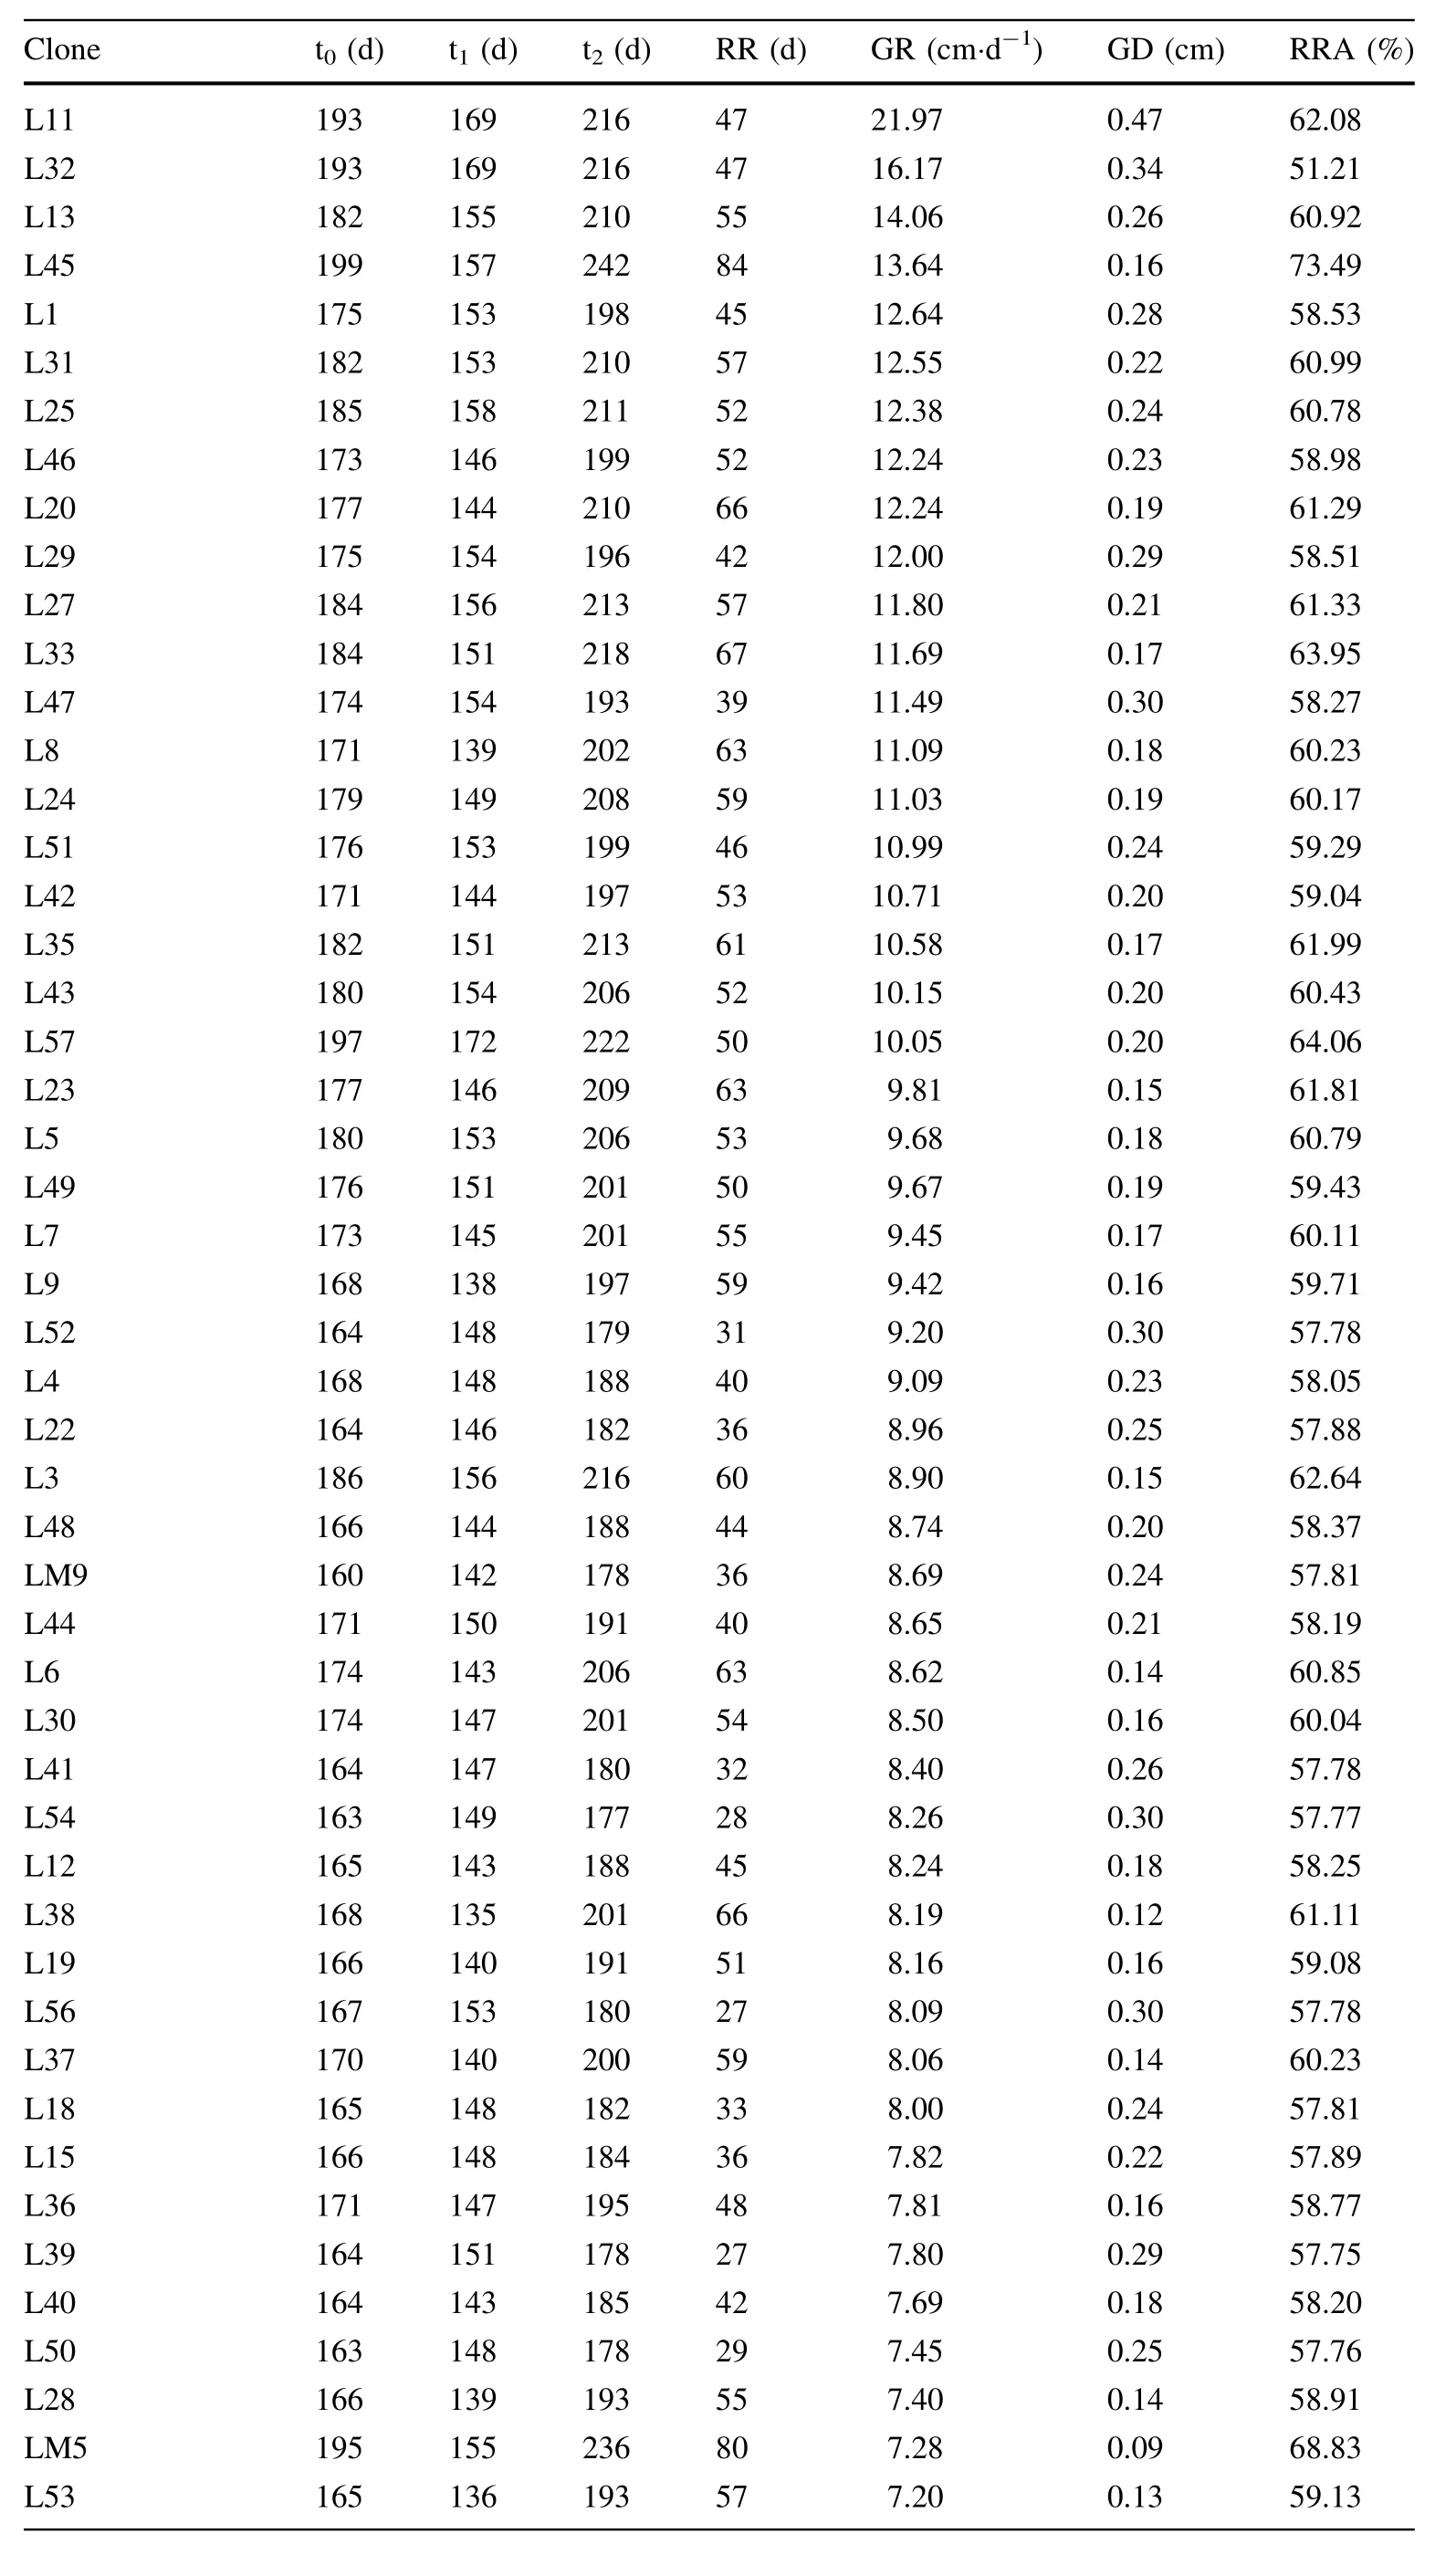
Table 5 Growth parameters of hybrid clones and parent clones
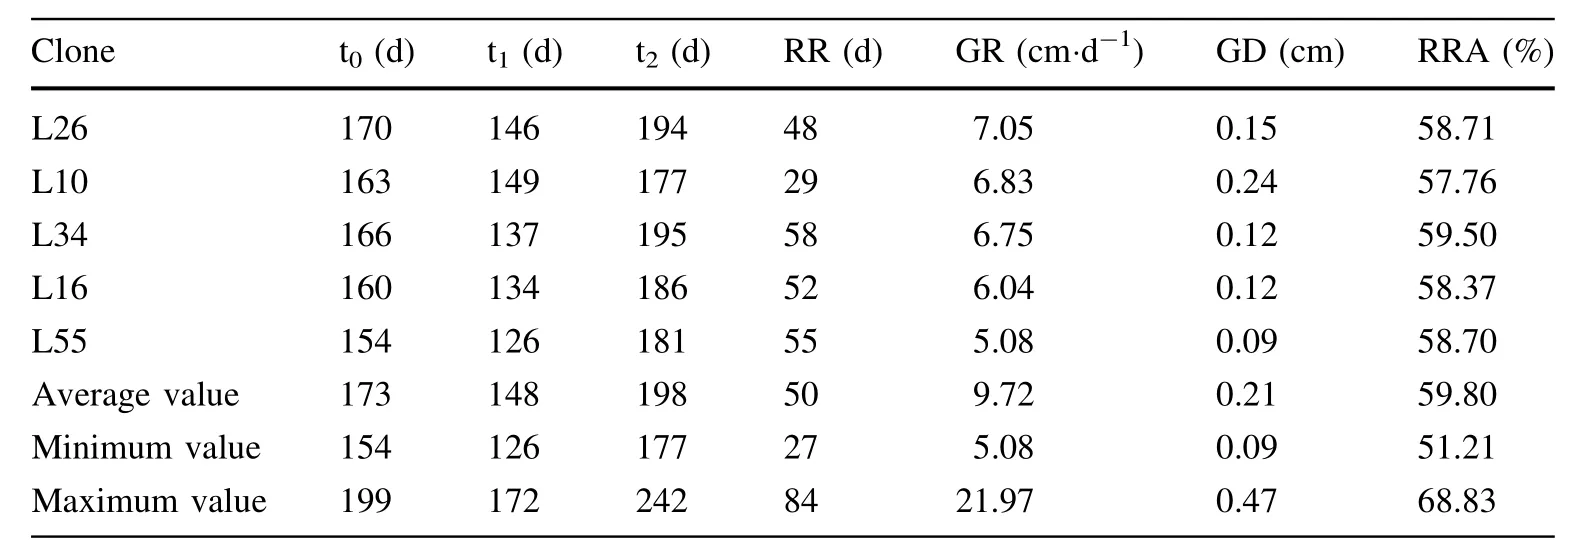
Table 5 continued

Table 6 Correlation analysis of height and growth parameters
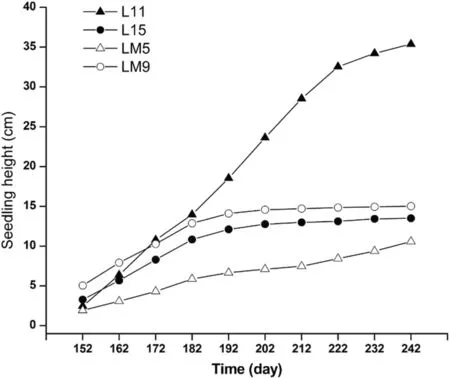
Fig.3 Growth process of hybrid clones and their parent clones
Discussion
ANOVA analysis and logistic model construction
There exists remarkable significance among the variations in height of the different clones according to ANOVA analysis,which indicates that height was influenced directly by the growth parameters of the different growth processes,and that these parameters were conducive to selection and early evaluation of larch hybrids.
Phenotypic growth characteristics are influenced by the complex of genotypes,environment,and genotype×environment interactions(Egbäck et al.2012).Thus,the growth performance is different at various stages.It is important to explore the growth patterns of height for a better understanding which will help in the development of breeding and management strategies of elite clones.Logistic modeling reflects the growth rhythm of plants well(Chen et al.2014).In this study,logistic modeling simulated the growth curves and all the coefficiencies were higher than 0.943 for the 53 clones.This is similar to the results withP.tomentosa(Zhao and Zhang 2013),P.deltoides(Wei et al.2009)and transgenicP.simonii×P.nigra(Liu et al.2014).Thekvalues were relatively in agreement with plant heights and correlation co-efficiency betweenkvalues and heights was 0.989,which indicates that they could be used as one of the important indexes for the early selection and breeding.Nevertheless,other mathematical models have different advantages for the simulation of growth curves such as the Cui-Lawson model(Cui and Lawson 1982)and the Li-model(Li et al.1997).It would be helpful for growth curve simulation if more effective mathematical models could be tested and applied.
Analysis of growth parameters at different growth stages
Growth parameters are different among different clones and during the rapid growth stage they are important for the evaluation and management of early plants.There exists high correlation co-efficiency between annual height and GR(rapid growth stage)or GD(average daily increase in height).Both GR and GD are two major indices for early selection of elite clones.Although the average increase in height during the rapid growth stage accounted for 59.8%of the annual increase in height,and the rapid growth stage lasted only 50 days,they play an important role in the growth period.Attention should be paid to the rapid growth stage in terms of fertilization,weeding and pest control to promote growth and improve economic value(Lu et al.2010).Even though the RR(rapid growth stage)was proposed as a major index for the evaluation of environmental adaptability in willow(Tu et al.1986),the correlation between heights and RR was not significant,and may reflect the growth differences between larch and willow species.
Comparison and analysis of the growth process of all clones
The simulated height curves varied and were ‘S’-shaped and displayed a ‘slow-fast-slow’rhythm.Among the 53 clones,two-thirds of the curves were similar to the male parent clone.The other curves were different from the ‘S’shape which might be because of the limited measurement time or the difference in genetic composition of the full-sib interspecific hybrid clones.Different genotypes might influence the growth processes of different clones(Oksanen et al.2001;Lin et al.2013).In this study, five elite clones(L11,L32,L13,L1 and L31)could be selected according to their annual increase in height based on their GR and GD.These results suggest that the increase in heights during the rapid growth stages contributed significantly to the annual increase in height.
Inter specific hybrid breeding was effective and the logistic models simulated reasonably well the growth processes of hybrid clones.Annual plant heights were highly correlated with the total increase in heights during the rapid growth stage.Height was also correlated with other growth parameters and genetic factors.Therefore,proper watering and fertilization during the rapid growth stage is vital for the early selection of elite clones.
Conclusions
Logistic modeling was highly in accord with plant growth curves.The increase in plant heights during the rapid growth stage played a major role in the annual increase in eight and was instructive for the breeding and early management of plants;the growth parameters were significant for the annual increase in plant heights and would be conducive to the early evaluation and selection.Our experiment provides a theoretical basis for the breeding and management of elite larch clones during the plant period.
AcknowledgementsThis work was supported by Grants from the National Science and Technology Pillar Program of China(No.2015DAD09B01).
 Journal of Forestry Research2018年5期
- Journal of Forestry Research的其它文章
- Environmental load of solid wood floor production from larch grown at different planting densities based on a life cycle assessment
- Variability in physical properties of plantation-grown progenies of Melia composita and determination of a kiln-drying schedule
- Optimization of CNC cutting parameters using design of experiment(DOE)and desirability function
- Reduction of electric field strength by two species of trees under power transmission lines
- Forest type identification by random forest classification combined with SPOT and multitemporal SAR data
- Forest mapping:a comparison between hyperspectral and multispectral images and technologies
