Forest mapping:a comparison between hyperspectral and multispectral images and technologies
Mohamad M.Awad
Abstract Mapping forests is an important process in managing natural resources.At present,due to spectral resolution limitations,multispectral images do not give a complete separation between different forest species.In contrast,advances in remote sensing technologies have provided hyperspectral tools and images as a solution for the determination of species.In this study,spectral signatures for stone pine(Pinus pinea L.)forests were collected using an advanced spectroradiometer ‘‘ASD FieldSpec 4 Hi-Res’’with an accuracy of 1 nm.These spectral signatures are used to compare between different multispectral and hyperspectral satellite images.The comparison is based on processing satellite images:hyperspectral Hyperion,hyperspectral CHRIS-Proba,Advanced Land Imager(ALI),and Landsat 8.Enhancement and classification methods for hyperspectral and multispectral images are investigated and analyzed.In addition,a well-known hyperspectral image classification algorithm,spectral angle mapper(SAM),has been improved to perform the classification process efficiently based on collected spectral signatures.The results show that the modified SAM is 9%more accurate than the conventional SAM.In addition,experiments indicate that the CHRIS-Proba image is more accurate than Landsat 8(overall accuracy 82%,precision 93%,and Kappa coefficient 0.43 compared to 60,67%,and 0.035,respectively).Similarly,Hyperion is better than ALI in mapping stone pine(overall accuracy 92%,precision 97%,and Kappa coefficient 0.74 compared to 52,56%,and-0.032,respectively).
Keywords Classification·Economy·Hyperspectral·Multispectral·Spectral signatures·Stone pine
Introduction
Forests cover more than 30%of the global land area and contain over 80%of the world’s terrestrial biodiversity(FAO 2016).This biological diversity refers to the variety and variability of life on land,specifically in forests.One of the most widely used definitions describes it in terms of the variability within a species,between species,and between ecosystems(UNEP 2016).Biological diversity makes a direct and noticeable contribution to global food security and provides a range of goods and services that include a major source of renewable energy and having an irreplaceable role in climate change adaptation and mitigation.Forest species differs from one place to another depending on natural factors such as climate,topography and soils.Stone pine(Pinus pineaL.)is specific to the Mediterranean region,occurring in southern Europe,North Africa,and the Levant.The total area covered by stone pine forests is 380,000 ha,distributed as 75%in Spain,9%in Portugal,9%in Turkey,5%in Italy,and lower percentages in Greece,Lebanon and France(Moussouris and Regato 1999).
Stone pine is a conifer that can reach heights of 24 m,with needle-like leaves(Schiller et al.2008).It has direct and indirect benefits such as producing edible nuts(seeds),wood, firewood,resins,livestock feed,and honey(Moussouris and Regato 1999).It also protects soils, filters and stores underground water,and helps to prevent desertification and landslides(Choueiter and Ucenic 2007).
World production of pine nuts is lower than demand and is some 30,000 tons(6000 tons of white pine nuts),where Spain is the major producer of pine nuts(Loewe et al.2011).The current average retail price of stone pine nuts is 50–60 Euros/kg(Mutke et al.2011).Although the main area of production is the Mediterranean basin,some countries in South America,such as Chile,are showing interest in planting this species(Loewe et al.2011).
There is need for an effective,low cost,and rapid method for monitoring the changes to stone pine cover.There are numerous studies with objectives to find the best method and source of remote-sensing data for effective forest monitoring and mapping.However,some of these methods compare current hyperspectral technologies to old multispectral ones such as Advanced Land Imager(ALI)on board Earth Observation 1(EO-1),Landsat 5 and 7(Ferrato and Forsythe 2013;Awad et al.2014;Goodenough et al.2003;Ruiliang et al.2008;Cho and Lee 2014).In addition,these studies use conventionally known unsupervised and supervised algorithms such as Iterative Self-Organizing DATA(ISODATA)algorithm(Tou and Gonzalez 1974),K-Means(MacQueen 1967),and Maximum Likelihood classification(Pfanzagl and Hamboker 1994).The success of these algorithms in the classification of multispectral and hyperspectral images depends on many conditions;the area of a forest must be large enough,and most important,it must be homogeneous(one type of forest).These limitations have encouraged us to find more robust technologies and efficient algorithms which are able to separate different forest types(in the case of mixed forests)and between forests and other cover types.
Kruse et al.(1993)compared three supervised classification schemes:spectral angle mapper(SAM)algorithm,support vector machine(SVM)algorithm(Cortes and Vapnik 1995),and Maximum likelihood classifier(MLC)algorithm.These algorithms were applied to thirteen different image sets.MLC showed higher classification accuracy than the SAM and SVM classifiers.The authors did not use collected spectral signatures from an advanced spectroradiometer nor did they adapt the algorithms to their data.
New research(Racek and Balaz 2012;Weyermann et al.2009)indicates that spectral angle mapper(SAM)is a robust and reliable tool for matching the endmembers with pure spectra.However the algorithm’s efficiency degrades because some portion of the VNIR spectrum is sensitive to noise,atmospheric effects,differences between technologies,constant offset,and slant offset(Racek and Balaz 2012).Therefore it is necessary to carry out modifications to the SAM algorithm to adapt to these spectrum limitations and to increase its efficiency.
The literature clearly shows that the use of different conventional remote-sensing data and algorithms are not suitable and efficient for complex data classification to create reliable forest maps.Moreover,the training samples used in the literature are mainly traditional fieldwork data which rely mainly on the experience of the sample collector.
In this research,new techniques and data sources of satellite images are used for two areas in Lebanon to compare hyperspectral images such as Hyperion and multiangle CHRIS-Proba with two other multispectral images,Landsat 8 and ALI.
Landsat 8 has advanced technologies compared to older versions of Landsat satellite images,such as more bands that cover the VNIR,in addition its radiometric resolution is 12 bits which is similar to CHRIS-Proba.ALI is similar to Hyperion with respect to spatial resolution and are both carried on the same satellite EO-1.This means their images are captured synchronously.The research uses unsupervised and supervised classification methods combined with field work that includes the utilization of GPS and ASD FieldSpec 4 Hi-Res spectroradiometer.
The first objective of this research is stone pine classification using Landsat 8 images and to determine if using multispectral remote-sensing can increase the accuracy of classification compared to the use of hyperspectral images.In addition,it is assumed that by introducing high spatial resolution hyperspectral satellite images and increasing the efficiency of the SAM algorithm,the classification of stone pine may be improved and the accuracy increased.
Materials and methods
Study area
Lebanon is located on the eastern shoreline of the Mediterranean Sea.According to MPWT(2016),the yearly average temperature is 5–10 °C above 1800 m altitude.Temperatures of 15°C or more occur at elevations of 1100–1200 m.There is a small area that experiences slight littoral benefits from the dampening effect of the sea and has a yearly average temperature above 20°C.The quantity of rain varies according to the topography and the wind regimes.The largest annual rainfall of approximately 1200 mm occurs in the central mountainous region.The littoral zones are the second most exposed to rain and precipitations may reach 1000 mm.The northern littoral receives around 900 mm of rain while the south receives around 700 mm a year.The inland region receives variable amounts of rain,for example,in the northern portion corresponding to the internal region between 200 and 800 mm a year.The relative humidity near the littoral is the highest with a yearly average of over 70%,while for the slope of the western mountain range facing the sea up to an altitude of approximately 1800 m it is between 60 and 70%.Above this altitude,the relative humidity drops to less than 60%.
Slopes in Lebanon range from flat(0–2%)to>60%;there are more than 135 types of soils according to Darwish et al.2005.This variability in climate and topography has enabled different types of coniferous and broadleaf forests to occupy most of the Lebanese lands.The major type of forest is stone pine because of the suitable natural conditions existing(Awad 2015).
The study was carried out in two pilot areas rich in stone pine forests(Fig.1),the first is located on Mount Lebanon,El-Meten province,the second is in Jezzine province,south of Lebanon.The dominant soil type is eutric arenosols(Awad 2015).They are moderately deep over sandstone on steep and to moderately steep slopes.These areas were chosen for several reasons:(1)the complexity of the terrain;(2)the diversity the climatic factors;and,(3)the availability at no cost of Hyperion,ALI,and Landsat 8 images from the U.S.Geological Survey(USGS)and multi-angle CHRIS-Proba images from the European Space Agency(ESA).
The two areas are subject to strong anthropogenic degradation processes.Urban expansion,quarries and forest fires caused by population growth are decreasing the size of stone pine forests.This expansion is creating a mixed land cover which makes the task of monitoring these forests using conventional remote-sensing tools a complex one.
Data and methods
Different processes which start with data acquisition and end up with the creation of stone pine maps are summarized in Fig.2.Each of these steps is explained later in this section and supported in the next section with experiments.
Image acquisition
Four different hyperspectral and multispectral images are used in the comparison process.CHRIS sensor aboard Proba images the Earth in a 14-km swath with a spatial resolution of 17 m.Images are generally acquired in sets of five modes(multi-angles);in our case CHRIS image mode 3 is used with 18 hyperspectral narrow bands.Spectral resolution of the CHRIS image varies between 2 and 12 nm from the beginning of the blue wave length(400 nm)to the mid of the near infrared(1050 nm).Landsat 8 provides moderate resolution imagery from 15 to 100 m and with 11 bands which cover most of the visible to long infra-red spectrum of the earth′s land surface.Landsat 8 operates in the visible to thermal infrared spectrums.
Hyperion is another hyperspectral sensor with a swath width of 7.75 km.It images the earth’s surface in more than 220 contiguous spectral bands from 400 nm to 2.5 μm at a ground resolution of 30 m and spectral resolution of 10 nm.ALI multispectral image used in this study has 9 bands with 30-m resolution,plus a panchromatic band at a resolution of 10 m which covers the visible to short wave infrared spectrum.
CHRIS-Proba is compared to Landsat 8 while Hyperion is compared to ALI.The arrangement of the satellites for comparison is based on three criteria:(1)availability;(2)the revisit time;and,(3)spatial and spectral resolution.
ALI and Hyperion visit the same area at the same time and can be pan-sharpened to the same spatial resolution(10 m)because of the existence of the 10 m panchromatic image as one of ALI’s sensors.Hyperion and ALI cover the same spectral wavelength.Landsat 8 can be pan-sharpened to the same resolution as CHRIS-Proba.This can be done by the fusion of Landsat 8 images(VNIR)with the panchromatic image available in Landsat 8(15 m resolution).The pan-sharpened image is then re-sampled to 17 m.
The comparison between Landsat 8 and CHRIS-Proba is based on using VNIR bands only.Finally,the temporal resolution difference between CHRIS-Proba and Landsat 8 is<30 days.This does not have a serious effect on the results because studying coniferous forests requires a longer time to change compared to crops.
Atmospheric correction
The images are subject to the influence of atmospheric elements such as water vapor and aerosols.The technique used for atmospheric correction is based on Fast Line-of-Sight Atmospheric Analysis of Spectral Hyper-cubes module(FLAASH;Exelis 2015).This model is highly tunable,such that it allows users to define all parameters that influence atmospheric absorption and scattering.The input for the model is radiometric-calibrated radiance images in band-interleaved-by-line(BIL)or band-interleaved-by-pixel(BIP)format.The data type may be a floating-point,4-byte signed integers,2-byte signed integers,or 2-byte unsigned integers depending on which satellite image is used.To perform water retrieval,the image bands must span at least one of the following ranges at 15 nm spectral resolution or better:(1)1050–1210 nm;(2)770–870 nm;or,(3)870–1020 nm.For hyperspectral sensors,wavelengths and full width half maximum(FWHM)values must be available in the header file or in separate ASCII files.Known multispectral sensors require only wavelength values.
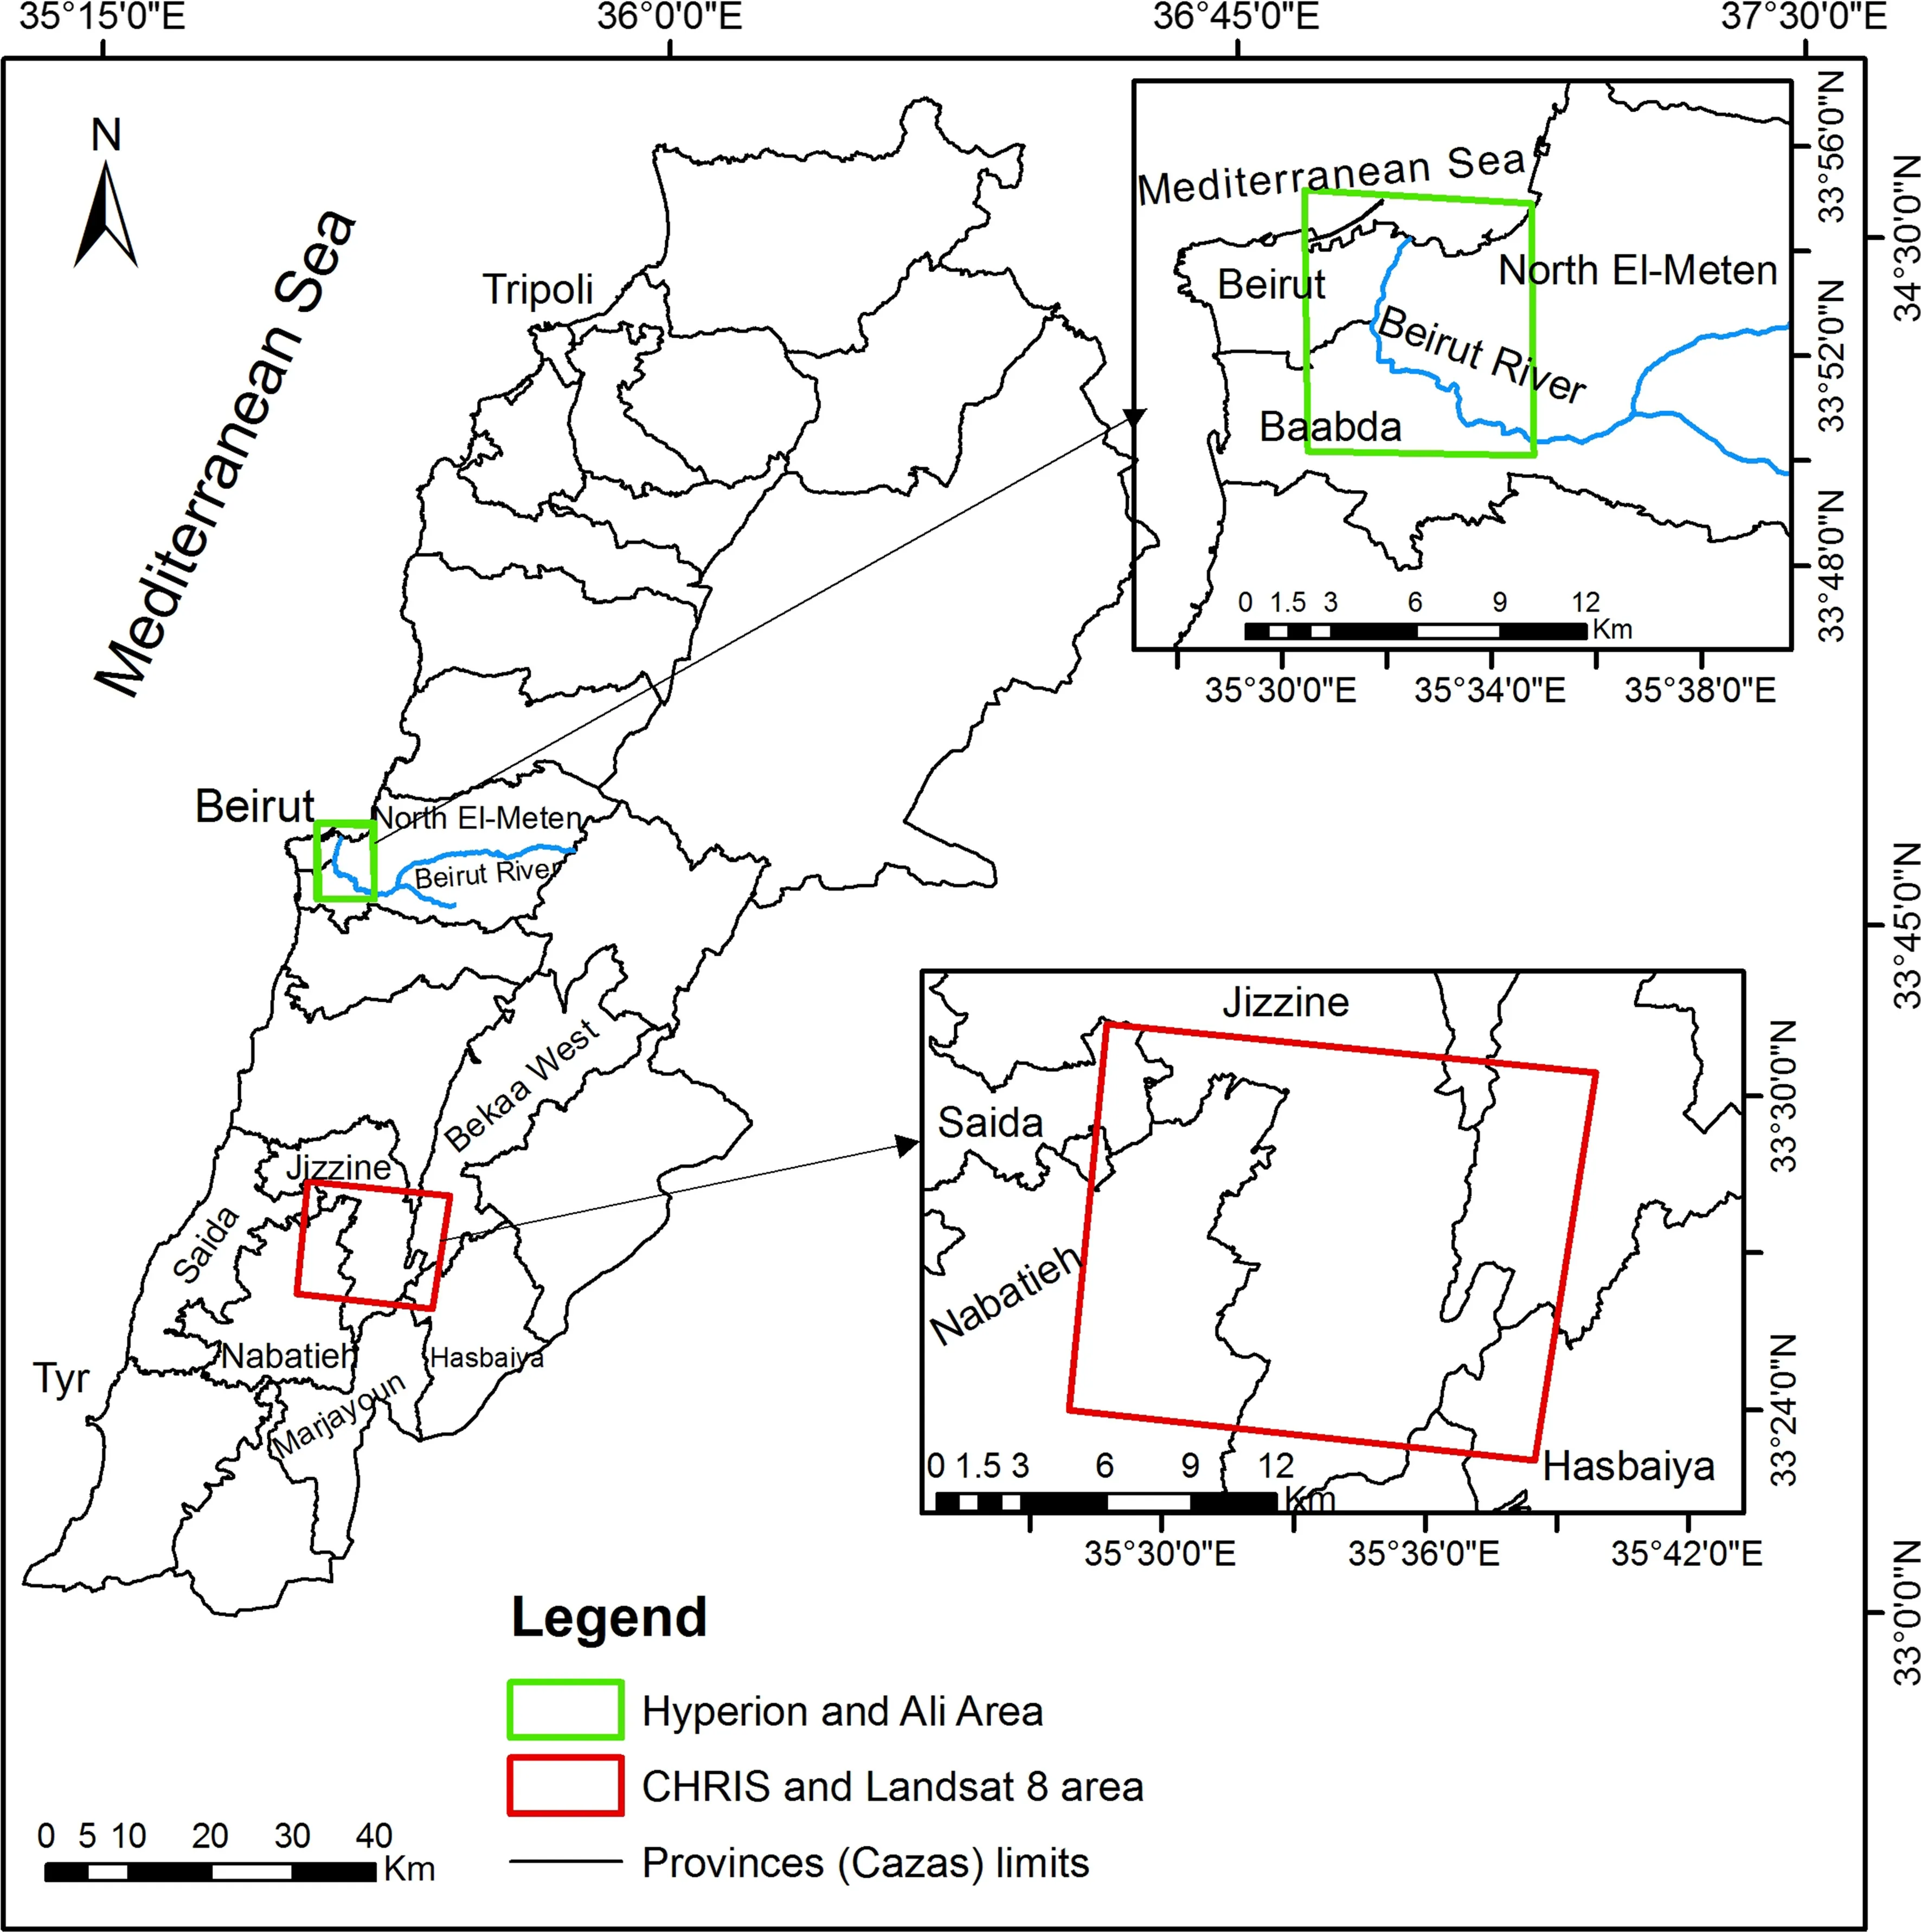
Fig.1 Areas of study
Geometric correction
This is applied to raw CHRIS hyperspectral narrow bands to correct errors of perspective due to the Earth’s curvature and sensor motion.It is addressed by rectifying the image to the Landsat 8 pan-sharpened image.In addition,out of the 220 bands in the Hyperion image,65 are excluded due to the absorption in these specified spectral ranges.To make the comparison between CHRIS and Landsat 8 compatible,the Landsat 8 spatial resolution is enhanced using the Wavelet resolution merge algorithm(King and Wang 2001).Wavelet-based fusion can significantly preserve the spectral characteristics and enhance spatial details as well(Wu et al.2015).
The pan-sharpening process combines the panchromatic(15 m)with the visible and short wave bands.This is not necessary for Hyperion and Ali because both have 30 m resolution.
Spectral signatures collection and resampling process
ASD ‘‘HiRes FieldSpec 4’’(Fig.3a)provides the best spectral resolution available in a portable spectroradiometer and is used to collect spectral signatures(Fig.3b).Collection of these spectral signatures was done in Augustand September when the sky is clear and coincides with the time of image acquisition.The spectral signature of stone pine is plotted in a graph that shows wavelength against the percentage of reflectance(Fig.4a).
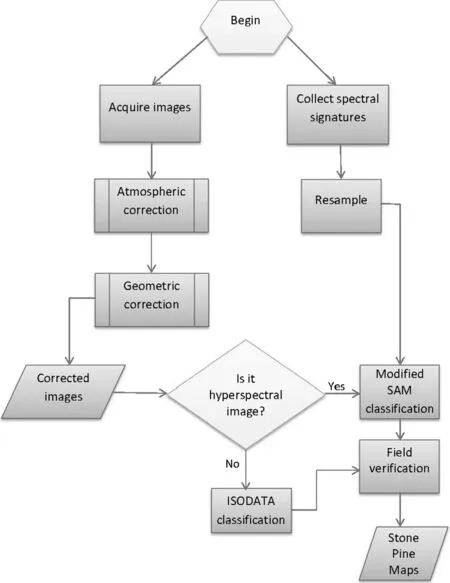
Fig.2 Flowchart of the stone pine mapping process
These signatures are re-sampled for the different hyperspectral and multispectral images(Fig.4b–d Resampling is a set of ordered processes which can be listed as:(1)read different spectral signatures collected by the spectroradiometer;(2)read band wavelengths from the metadata file of the satellite images;(3)compute the average of every wavelengths recorded by the spectroradiometer;(4) find a match between every spectrum in the image and the computed average;and,(5)reconstruct the spectral signatures.Spectral Response Functions(SRFs)are used in the resampling process.All satellite sensors have unique SRFs which reflect the intrinsic physical characteristics of each sensor(SRFs 2016).From the graphs,it is difficult to use the re-sampled spectral signature for Landsat or ALI multispectral images in the SAM classification process due to the coarseness of the spectrums,while it is smooth for the hyperspectral images.For this reason,Iterative Self-Organizing DATA(ISODATA;Tou and Gonzalez 1974),an unsupervised algorithm,is used for the classification of the multispectral images.
Spectral angle mapper(SAM)modification
The supervised SAM(Kruse et al.1993)is used to classify both hyperspectral images and determines the spectral similarity between two spectra,the one collected by the spectroradiometer and each pixel value in the image.The process works by calculating the angle between the twospectra,treating them as vectors in a space with dimensionality equal to the number of bands(Eq.1).Pixels with minimum or zero spectral angles in comparison to the reference spectrum are assigned to the class defined by reference vector.Endmembers spectra used by SAM come from the ASCII file created from the spectroradiometer.
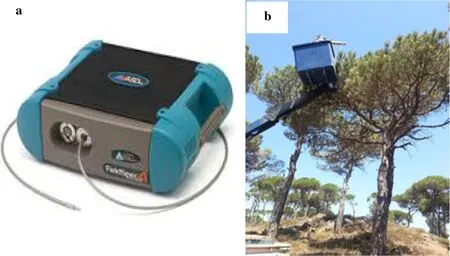
Fig.3 Spectroradiometer a ASD Fieldspec 4 b collecting stone pine signatures

wheregis the angle,Bthe number of bands,pthe pixel value,andSpthe reference spectral signature
The variablespandSpare adjusted to avoid problems in the SAM algorithm which were listed earlier.The adjustment is based on determining if differences between the reflectance of both spectroradiometer and satellite sensor(GreenD1,redD2 and end of red edgeD3)are constant(Fig.5).The computation ofD1,D2,andD3 is expected to improve the value ofSpand reduce the differences in reflectance distance with the value of spectral signature extracted from satellite images.Equation 2 represents the improvement to the conventional equation of SAM.

When the difference is computed it is based on the average of ranges,e.g.,red edge,red,and green spectra ranges
Field verification and type of experiments
Different experiments were planned in this research to verify the above processes.The first was to compare the Modified SAM algorithm with the original to check robustness.The other experiments consisted of two comparisons between different multispectral and hyperspectral images to select the best type of satellite image for the classification of stone pine forests.
After the classification of the images,there is a need to verify the results.This is the last step before accepting the classification as the final stone pine map.Normally this is done by collecting the location of the stone pine trees such that a portion is accompanied with spectral signatures collection.In addition,several points representing other species and objects are recorded.Simple random sampling is used because of its efficiency to verify the created map of the forests(West 2016)
The objective of the field work is to collect the same number of samples for each area.However,due to errors made during the collection process and to the remoteness of some locations,it was difficult to avoid differences between the collected samples.
To verify the results of the first experiment,many samples of spectral signature were collected using the ASD spectroradiometer.The classification of stone pine forests using the modified SAM and the verification of the results are based on 100 samples collected randomly.
The results of the other experiments were verified using different collected samples(108 samples for CHRIS and Landsat;100 for Hyperion and ALI).Finally,the accuracy was computed based on the confusion matrix method(Kohavi and Provost 1998),a matrix of sizem×massociated with a classifier to show the predicted and observed classification(Table 1),wheremis the number of different classes.Heremrepresents two classes,stone pine and others.TP,FP,FNandTNrepresent true positive,false positive,false negative and true negative respectively.
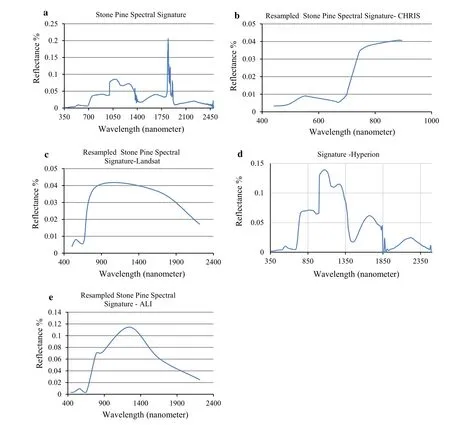
Fig.4 Stone pine spectral signatures a ASD b CHRIS(c)Landsat 8 d Hyperion e ALI
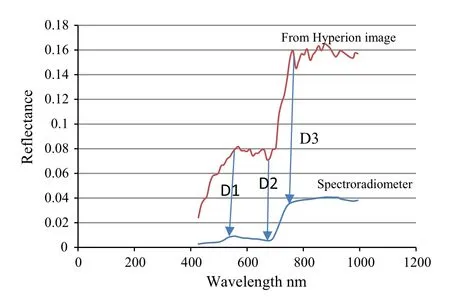
Fig.5 Differences between stone pine spectral signatures of spectroradiometer and satellite
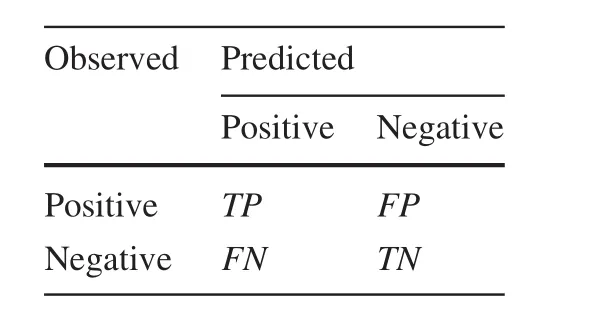
Table 1 Confusion Matrix
Sometimes the overall accuracy may not be an adequate performance measure if a specific class such as stone pine is the target of the evaluation.One way to account for this is by calculating the precision or positive predictive value(PPV)of stone pine classification using Eq.3(Heston 2011):whereTP(true positive)is the proportion of correctly classified stone pine,FP(false positive)is the proportion of other classes that were classified incorrectly as stone pine,TN(true negative)is the proportion of other classes that were classified correctly,andFN(false negative)is the proportion of stone pine classes that were classified incorrectly as other classes.

Kappa coefficient(Ka)(Cohen 1960)is another metric method for accuracy assessment and is frequently used to test interrater agreement(Eq.4).The coefficient values range from-1 for the poorest agreement to+1 for the perfect value.
wherep0is the relative observed agreement among raters(overall accuracy)and is the hypothetical probability of chance agreement.
According to Landis and Koch(1977),Kappa values<0 indicate no agreement and 0–0.20 as slight,0.21–0.40 as fair,0.41–0.60 as moderate,0.61–0.80 as substantial,and 0.81–1.0 as almost perfect agreement.
Experimental results
In the first experiment,verification of the classification results show that the accuracy for the modified SAM is 92%compared to 84%for the conventional SAM.The modified algorithm works well on reducing differences between recorded spectral signatures by spectroradiometer and the ones obtained by satellites.On the other hand,the original SAM algorithm failed to match spectral signatures,and the problem may increase depending on the sensor technology.
Considering the above result,this is a great achievement with respect to mapping stone pine forests which means either an increase or decrease of 8%of the total area.In addition,this helps decision makers and planners to decide which area in a specific country needs reforestation.
The above result is a promising one as well,as it increases the confidence in using SAM to separate different species for those using supervised algorithms based on collected spectral signatures by the spectroradiometer.
This proves the first hypothesis that modifying SAM can increase the accuracy of the stone pine classification using hyperspectral satellite images and collected spectral signatures.
The results of the next experiments are shown in Fig.6a–d.These figures show stone pine cover extracted from four different satellite images.The verification indicates that the accuracies of the classified Hyperion and CHRIS are 91 and 82%compared to 52 and 60%for ALI and Landsat.
Tables 2,3,4 and 5 show the confusion matrices for the verification of the results based on field samples which represent the location of the stone pine and other type of forests or shrubs.In the confusion matrices of CHRIS and Landsat out of 108 sample points,84 points were selected for stone pine and 14 for others.On the other hand,75 points were collected as samples for stone pine locations in the verification of Hyperion and ALI.At times,technical issues related to satellites play important roles in increasing and decreasing the accuracy of the classification.For example,one can explain the high accuracy of Hyperion compared to CHRIS because the Hyperion has a small swath width.In addition,Hyperion spectral resolution is higher than CHRIS which makes a difference in identifying forest species.
One may suggest that CHRIS and Landsat verification require more samples.That is true if enough resources and time are allocated.These resources may be identified as new technologies such as Unmanned Aerial Vehicle(UAV)for accessing remote and inaccessible areas.Moreover,the 2-year duration of the project did not help to acquire and to learn new technologies.
To be confident of the results,thePPVvalues are calculated such that CHRIS,Landsat 8,Hyperion and ALI have 93,67,97,and 56%consecutively.It is clear that the order of accuracies is similar to the previous computed accuracies.However,the values are greater than the one computed earlier because the modified SAM is able to match spectral signatures to the hyperspectral images.This removes any confusion about the overall accuracies obtained using field verification and indicates that homogeneous forests are extracted from the images.
The Kappa coefficient(Ka)is utilized to re-inforce our confidence in the results.Kavalues for CHRIS,Landsat 8,Hyperion and ALI are 0.43,0.035,0.74,and-0.032 respectively.
The Kappa values indicates that the results obtained using modified SAM as an algorithm and hyperspectral images are better for mapping stone pine forests.
In the experiments,it is shown that using Landsat 8 did not improve the classification process of forests which contradict one of the hypotheses that new technologies of multispectral remote sensing can improve classification process.One of the interesting results is that classification using CHRIS hyperspectral image is lower in accuracy than the classification using Hyperion image.This contradicts the hypothesis that high spatial resolution with low spectral resolution hyperspectral images can increase the accuracy of forest classification.
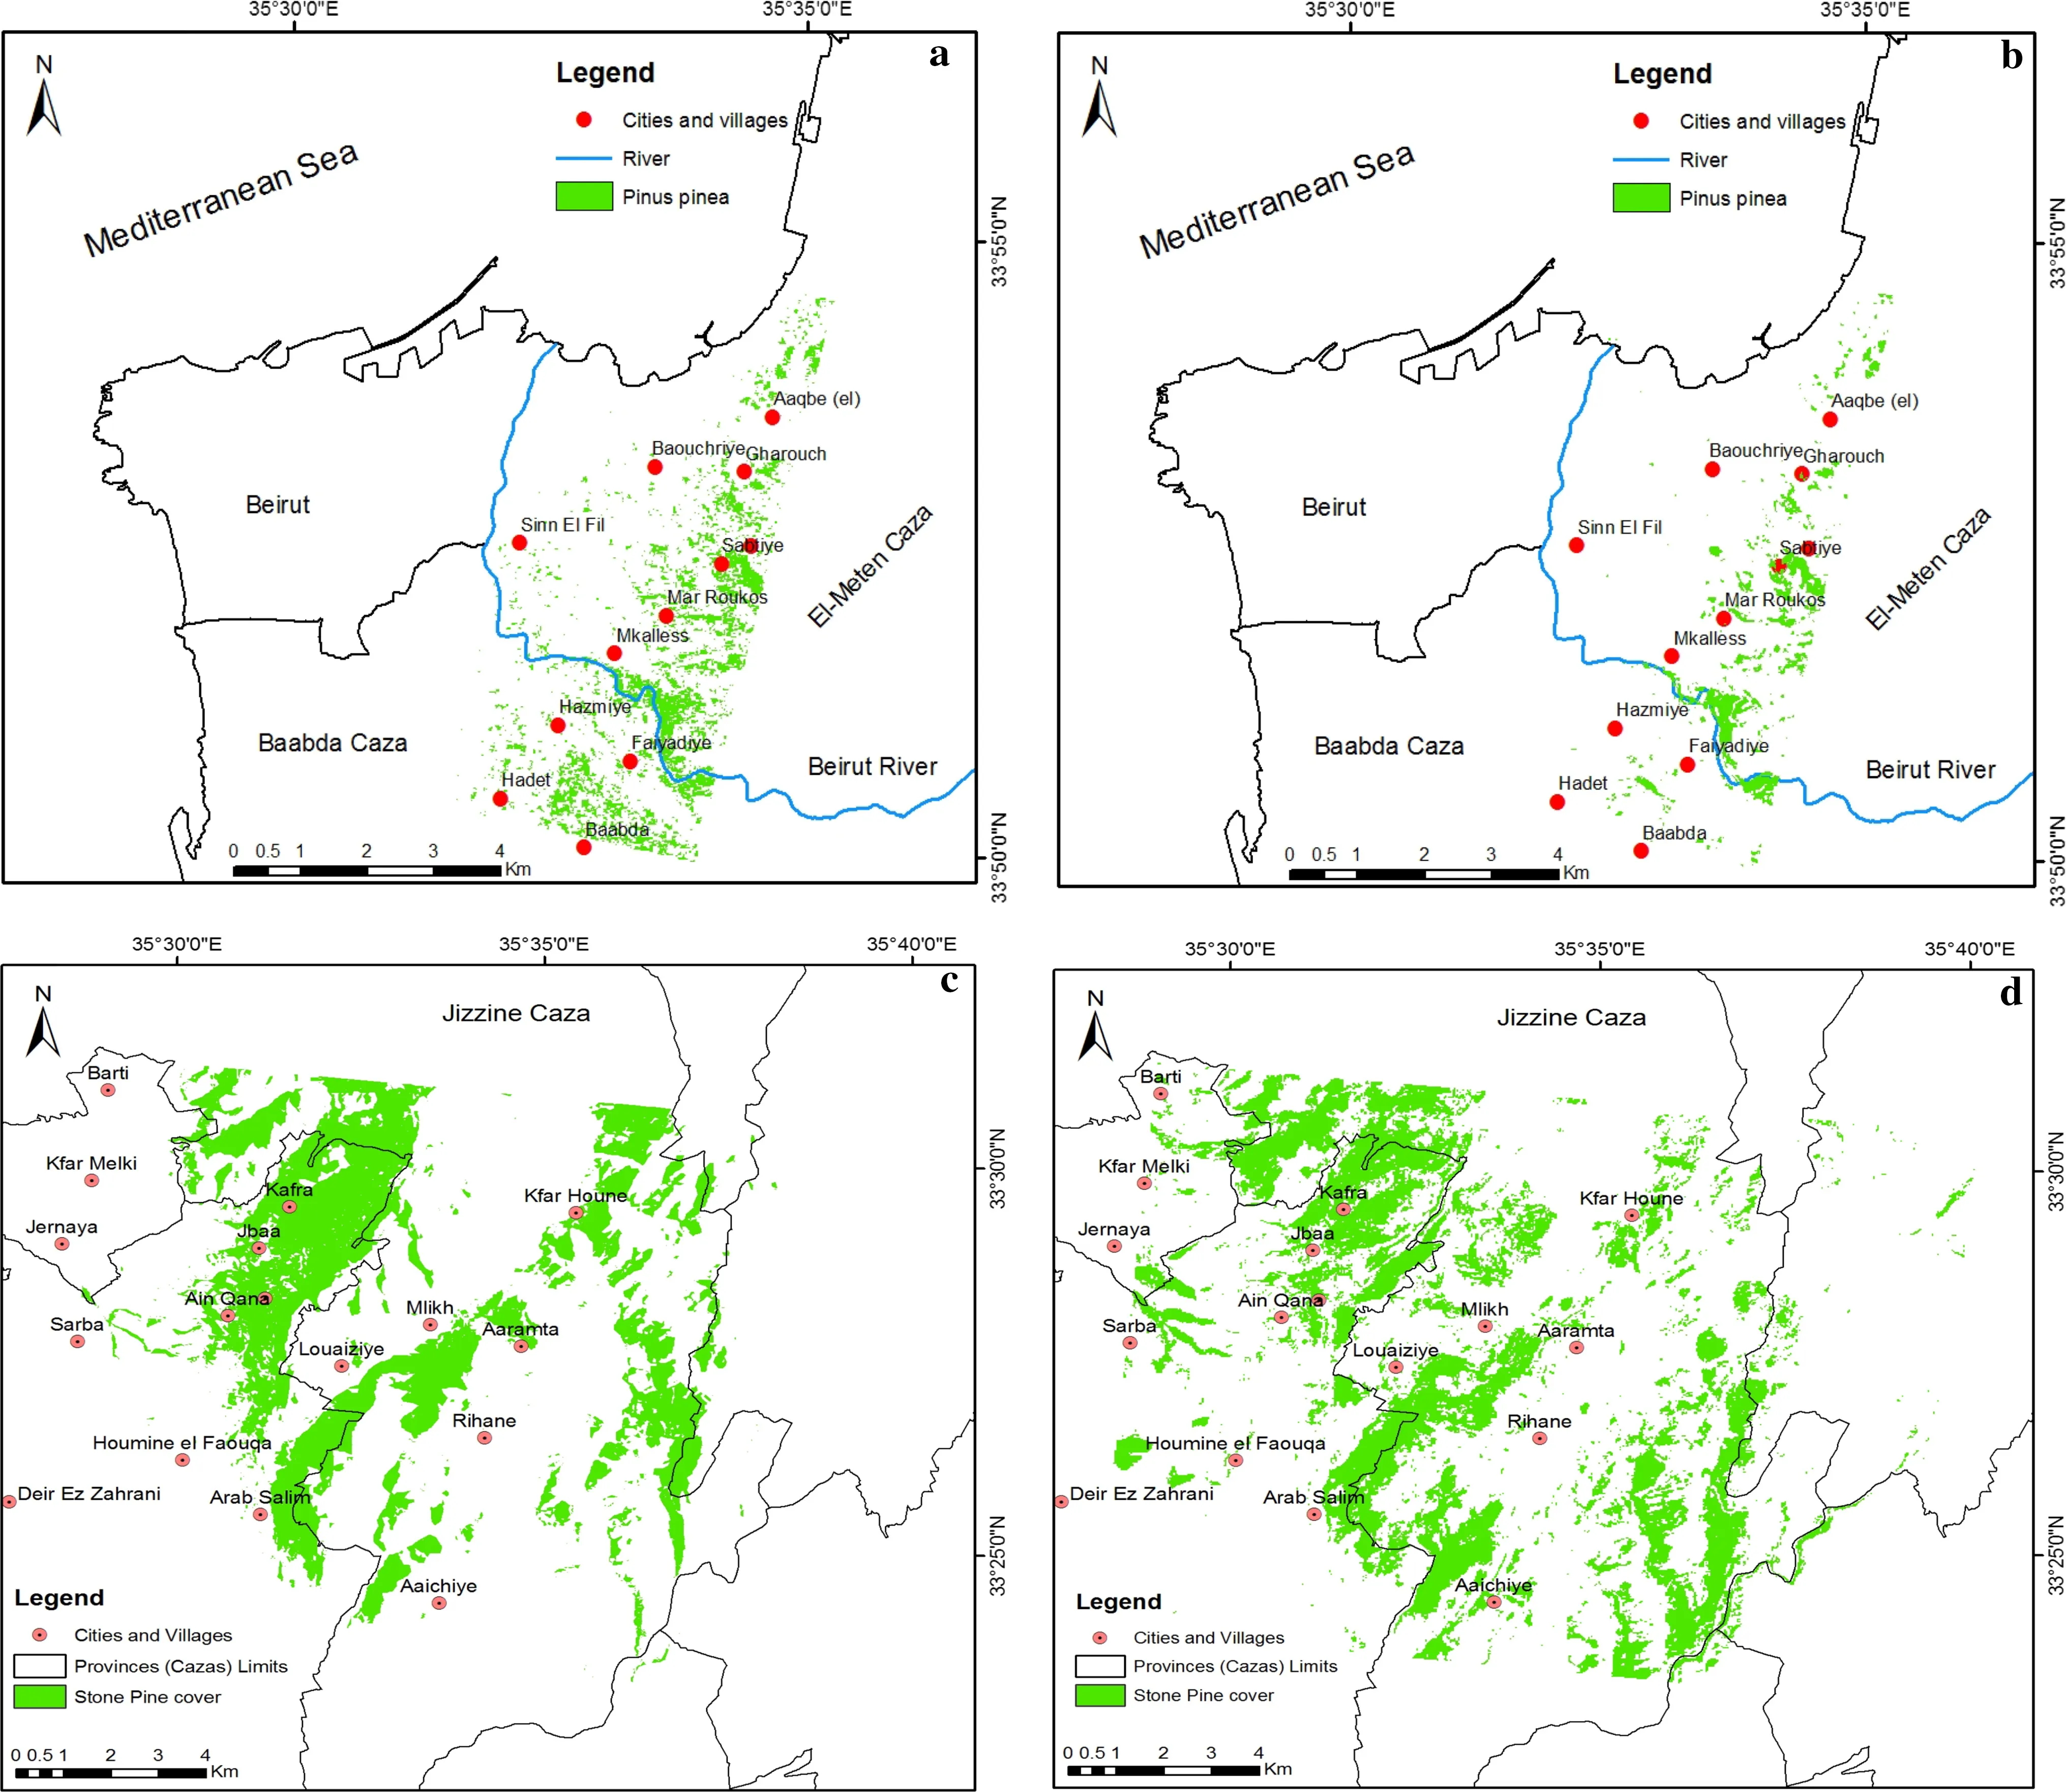
Fig.6 Classified image of a Hyperion b ALI c CHRIS and d Landsat 8

Table 2 CHRIS-Proba accuracy verification confusion matrix
Discussion
The results indicate that the advancement in multispectral technologies(the deployment of Landsat 8 or time synchronization with hyperspectral sensors such as Hyperion and ALI on EO-1)does not improve the mapping of stonepine forests.Moreover,it was demonstrated that there are other sources of inexpensive or free hyperspectral data such as CHRIS-Proba which can improve mapping accuracy with larger coverage of the forest area ‘‘swath width’’,where CHRIS-Proba has wider swath than Hyperion.However,the last one is able to improve the accuracycompared to CHRIS-Proba because it has higher spectral resolution.

Table 3 Landsat 8 accuracy verification confusion matrix

Table 4 EO-1 Hyperion accuracy verification confusion matrix

Table 5 EO-1 ALI accuracy verification confusion matrix
In this research it is shown that the difference in the accuracy of forest classification between hyperspectral and multispectral can be larger than indicated in the literature.For example,in Ferrato and Forsythe(2013),Hyperion hyperspectral imagery produced almost comparable accuracy(5–6%better)than Landsat 5 multispectral data.Goodenough et al.(2003)obtained overall classification accuracies with Hyperion(90.0%),ALI(84.8%),and Landsat(75.0%).Several issues play important roles in making the difference between classified hyperspectral and multispectral image accuracies.Using advanced hyperspectral technologies and having complex land cover characteristics(mixed forests and small forested areas)are some of these issues.Moreover,it is shown that some important supervised algorithms for hyperspectral image classification can provide better results if they are modified to reduce sensitivity to noise and combined with the spectroradiometer technology.This is in contrary to the low performance for these algorithms as indicated by Cho and Lee 2014.
Comparing Landsat 8 to hyperspectral images has not been reported in the literature.This research is considered to be the first attempt to utilize Landsat 8 to map stone pine forests.Although,the Landsat 8 is without charge and represents one of the best high resolution multispectral images(after pan-sharpened with the 15 m panchromatic image),it is not useful in separating between mixed forests or different land cover types.Moreover,the experiments showed that even with the advancement of multispectral technology,hyperspectral images are better in mapping forests in combination with spectroradiometer technology.
This research has paved the way to solve complex mapping tasks such as mapping heterogeneous areas.High spatial and spectral resolution can help in solving this problem and reducing costs using robust fusion or pansharpening algorithms.The outcome of this research can further be applied to other forest species around the world.For example,it is difficult to distinguish between different tropical forest species and there are attempts to overcome this using Landsat(Helmer et al.2012).If the results of this research are applied,they can be a solution for mapping tropical forests and other type of forests as well.
Conclusion
Large areas in the Mediterranean region are covered with stone pine forests and for many countries they are an important source of income.Accurate mapping of these forests is vital for economic sectors such as agriculture and tourism.Currently,mapping is based on mainly multispectral images and field work.In this research,two hyperspectral images are compared against two multispectral images based on field work,registered spectral signatures by a spectroradiometer,and unsupervised and supervised algorithms.One of these important algorithms is SAM which was modified to overcome some problems in order to achieve better performance and higher accuracies.The results show that the modified SAM is better than the original SAM algorithm in separating different forest species based on the strong correlation between collected spectral signatures and Hyperion images.It is important to note that for the first time,Landsat 8,a new multispectral satellite technology,has been used in this research.Although advanced multispectral technology is used,hyperspectral images(Hyperion and CHRIS-Proba)provided better accuracy(82 and 92%)compared to(52 and 60%)for the two multispectral images(ALI and Landsat 8).Other known quantitative measurements which are based on the confusion matrix such asPPVindex and Kappa coefficient are computed to support the results.Future work will cover more forest type mapping which can include the search for more hyperspectral data options,including the use of Aerial Unmanned Vehicles(UAV)with VNIR hyperspectral imaging systems.In addition,there is an intention to create more efficient algorithms which are robust against changes in reflectance values for the same vegetation type.
AcknowledgementsThe author would like to thank USGS and ESA for providing satellite images.
 Journal of Forestry Research2018年5期
- Journal of Forestry Research的其它文章
- Environmental load of solid wood floor production from larch grown at different planting densities based on a life cycle assessment
- Variability in physical properties of plantation-grown progenies of Melia composita and determination of a kiln-drying schedule
- Optimization of CNC cutting parameters using design of experiment(DOE)and desirability function
- Reduction of electric field strength by two species of trees under power transmission lines
- Forest type identification by random forest classification combined with SPOT and multitemporal SAR data
- Genetic variation of height growth rhythm between clones of Larix kaempferi×L.gmelini based on logistic models
