Geologic-seismic models,prediction of shallow-water lacustrine delta sandbody and hydrocarbon potential in the Late Miocene,Huanghekou Sag,Bohai Bay Basin,northern China
Hao Liu,Qing-Long Xia,Xin-Huai Zhou
aSchool of Ocean Sciences,China University of Geosciences,Beijing 100083,China
bExploration&Exploitation Research Institute,Tianjin Branch of China National Offshore Oil Corporation,Tianjin 300000,China
cExploration&Exploitation Research Institute,Shanghai Branch of China National Offshore Oil Corporation,Shanghai 315000,China
Abstract The Huanghekou Sag is located at the southeast part of the Bohai Bay Basin,northern China.Large-scale shallow lake delta developed in the Neogene provided suitable geological conditions for the formation of a subtle oil-gas reservoir in this area.The key for analyzing sandstone reservoir and sedimentary facies is by using seismic attributes(amplitude)to establish the relationship between lithology combination and seismic attributes.The lower unit of Late Miocene Minghuazhen Formation at the BZ34 block in the Huanghekou Sag was subdivided into 10 parasequence sets(PSS).Thicker sandstones mainly occurred in PSS1 and PSS10,whereas thin sandstones are mostly observed within other parasequence sets.This study presents statistics and analyses of lithology,i.e.,statistics of root-meansquare(RMS)amplitude and lithology of well locations in different parasequence sets of the study area,as well as 1-D forward seismic models of 7 types of lithology combinations,the establishment of a spatial distribution of 2-D sandbody,forward seismic models etc.Our study indicates that high amplitude peaks correspond to thicker sandbodies,while low amplitude indicates non-development of sandbodies(generally less than 2 m),and medium amplitude agrees well with large sets of mudstones interbedded with medium and thinner sandstones.Different sand—mudstone combinations genetically reflect a combination of multiple micro-facies,therefore,amplitude features can predict sandbodies as well as facies characteristics.
Keywords Shallow-water lacustrine delta,High-frequency sequence,Root-mean-square(RMS)amplitude,Geological-geophysical model,Sandstone depiction,Huanghekou Sag,Late Miocene
1. Introduction
The Bohai Bay Basin is one of the major sea areas for offshore oil-gas exploration in China(Chen and Zhang,2007;Gong et al.,2011;Liu et al.,2017).Presently,the Neogene hydrocarbon reservoirs and the Miocene of the Huanghekou Sag played a major role in oil-gas exploration(especially the subtle hydrocarbon reservoirs).The Neogene is characterized by continuous strata,slow subsidence rate,large lake and gentle slope(Liu et al.,2016;Zhu et al.,2008).Shallow water deltas form profitable reservoir/seal combinations in the Neogene and favorable accumulation conditions for oil-gas reservoirs(Dai et al.,2007;Lai et al.,2009a;Xu et al.,2002;Zhu et al.,2008).
The major difficulty in exploration of oil-gas reservoirs lies in the analysis of geological conditions of subtle traps and oil-gas reservoirs.Depicting reservoir sandbody is one of the key steps in analyzing geological conditions for forming subtle traps.Previous studies regarding sequence stratigraphy and sedimentary facies of the Neogene in the Huanghekou Sag(Dai et al.,2007;Lai et al.,2006,2008,2009a,2009b;Li et al.,2014;Peng et al.,2009;Sun et al.,2010;Tian et al.,2009;Xu et al.,2002;Zhu et al.,2008)showed some implication in prediction of reservoirs.Meanwhile,a hypothesis was proposed,stating there are rules to follow for the reservoir of shallow deltas.Some clues were also found during the exploration using amplitude attributes(Lai et al.,2009b).Further studies need to be conducted regarding the following aspects:1)The study of regional sequence and sedimentary facies are inadequate for a detailed depiction of sandbodies and prediction of reservoir;2)Attribute extraction is based on the third-order sequences of the area with thicker strata(200—400m),resulting obvious diachronism in attribute extraction.Thus,the depiction of sandbodies and analysis of sedimentary facies using division interpolation within the sequence boundaries is needed.
Seismic stratigraphy(Vail et al.,1977,1991)is a well-accepted and powerful tool for analyzing sedimentary facies.In addition to wire-line-log data,biostratigraphic and seismic stratigraphic data are critical for sequence-stratigraphic analyses of the reservoir,seal,and source rock prediction(Mitchum et al.,1993).However,predicting sandbodies and mapping sedimentary facies in the subsurface have been a challenge because the data obtained from well bores are basically one-dimensional(1-D)and laterally discontinuous,whereas sandbodies and facies can change dramatically in three-dimensions(3-D)across untested areas.
In recent years,high-quality seismic reflection data have provided a new source of information to map not only the structure and stratigraphy but also the hydrocarbon reservoirs in sedimentary rocks.The development of three-dimensional(3-D)seismic imagery allows researchers to predict the extent and quality of the reservoirs away from the control well and to select in- field drilling targets in mature fields.Some published examples are facies imaging from 3-D seismic data(Biddle et al.,1992;Brown,1992a,1992b;Brown et al.,1981;Galloway et al.,1977;Gao,2007;Jackson et al.,2010;Mcglue et al.,2006;Mitchum, 1977; Posamentier et al., 2000;Posamentier and Kolla,2003;Raeuchle et al.,1997;Rijks and Jauffred,1991;Schramm et al.,1977;Weimer,1990).Several studies(Zeng and Hentz,2004;Zeng et al.,2007;Zhao et al.,2011)have also addressed the issues of high-resolution imaging and prediction of sandstone reservoirs by 3-D seismic data.90°phasing of seismic traces and stratal slicing have been practically applied to many regions for references.
Although these techniques can be used to demonstrate how facies changes may cause variations of seismic reflection,they fail to provide guidelines for facies recognition due to the lack of realistic lateral and vertical stratigraphic complexity.Sedimentary facies can be analyzed directly based on the horizontal distribution features of seismic attributes(amplitude).The horizontal distribution of lithofacies is the basis of sedimentary facies analysis.However,the most critical problem,i.e.,the relationship between seismic attributes(amplitude)and lithology,has not been given much attention.
Therefore,we attempt to:1)conduct high frequency Pliocene and Miocene sequence stratigraphy in the Minghuazhen Formation within a third order sequence framework,with sequence being classified into parasequence set(fourth-order);2)analyze the features of lithology combinations of different parasequence sets within a high-frequency sequence framework in detail,and selectively analyze the vertical overlying relationship between sandstone and mudstone;3)conduct attribute extraction,comparison,and optimization in the framework of a high frequency sequence;4)choose a three-dimensional(3-D)area with relatively dense wells,and analyze the relationship between seismic attributes and lithology of well using statistical methods;5)build the forward synthetic seismic models of the development features of one-dimensional(1-D)sandbodies,and selectively analyze the relationship between vertical combinations of sand and mud,with corresponding sedimentary micro-facies and the synthetic seismic amplitude;6)build 2-D vertical-lateral development models of genetic sandbodies and their two dimensional(2-D)forward seismic records,and compare the synthetic seismic records with actual seismic section to verify the geological model of spatial development of sandbodies.
2. Geological setting
The Huanghekou Sag is located at the southeastern part of the Bohai Bay Basin,between the South Bohai low uplift and the North Laizhou Bay low uplift.From Paleogene to the present,the paleo-topography of Huanghekou Sag is characterized by deep in the west and the north,shallow in the east and the south(Gong et al.,2000;Tian et al.,2009)(Fig.1).The Huanghekou Sag in the south-central area of the Bohai Sea is a solitary type basin from Late Miocene to Middle Pliocene(Dai et al.,2007;Lai et al.,2009a;Xu et al.,2002;Zhu et al.,2008),which is similar to the Songliao Basin of northeastern China(Han et al.,2000;Lü et al.,1999).Two sets of faults striking in approximately east—west and north—north—east direction were developed in the sag.Fault-uprising belt,faultstep belt,steep slope belt and secondary sag are obviously controlled by these faults.The sag exhibits a dustpan shape with faults in the north and overlapping in the south,covering an area of approximately 3300 km2,and approximately 7000 m of the maximum burial depth of the basement.The Paleogene and Neogene developed completely and the Neogene is composed of the Guantao and Minghuazhen Formations.
Drainage system was well developed surrounding the Bohai Bay Basin in the Neogene(Xu et al.,2002),especially in the western margin of the basin.Rivers flowed into the basin,causing the Huanghekou Sag the depositional center.The Neogene basins are different from those of the Paleogene:the Paleogene lakes were mostly controlled by subbasin-controlling faults,interpreted as rift lacustrine basins,and were mainly semi-deep—deep,whereas the Neogene lakes were generally developed at a down-depression stage.The basin was eroded by peneplanation during the depositional period of the Guantao Formation,which made the slope at the bottom of the basin very gentle.
3. Methodology
Regional correlations and facies maps were conducted by identifying and correlating major sequence boundaries and flooding surfaces from 118 wells(including core descriptions of 12 wells)and 1000 kmlong 2-D and 3-D seismic surveys covering 4300 km2regional study area.
A more detailed study was conducted depending on availability of high-resolution seismic data. Data used in this study are the BZ34 3-D seismic volume,which covers an area of approximately 100 km2.In this area,all of the available core and well log data were utilized.Well log and seismic data were combined to establish a detailed sequence stratigraphic framework(Fig.2).All sequence stratigraphic terminologies used in this paper follow the definitions of Vail et al.(1977,1991).
Acoustic impedance was used to provide a qualitative indication of sandy(high impedance)and muddy(low impedance)lithology.The relationship between 1-D lithology combination and seismic attributes was established using numerous synthetic seismograms.The architecture of 2-D sands was interpreted via seismic data and associated to facies based on well logs and core descriptions.The seismic data were processed to highlight discontinuities such as sandy edges.Subsequently,2-D forward synthetic seismograms were established and compared with actual seismic profile to testify the accuracy of the sandbody texture and the geological model.
4. Sequence stratigraphy
4.1. Third-order sequence stratigraphic framework of the lower segment of the Minghuazhen Formation,Late Miocene

Fig.1 Location of the Huanghekou Sag,Bohai Bay Basin,northern China.Faults and uplifts in the figure show tectonic units of the Huanghekou Sag during the Paleogene.
The lower unit of the Minghuazhen Formation consists of gray-green and brown-red mudstones with gray-green and light gray fine sandstones,with biocombinations of Magnastriatites—Fupingopollenites—Liquidambarpollenites.
Seismic reflection features of the third-order sequence boundary mainly include overlap and toplap.Seismic truncation is rare due to the relatively stable structure of the lower segment of the Minghuazhen Formation.Analyses of sequence boundary unconformity of the well log and core data were mainly based on abrupt contact and cyclic-reciprocal boundary.The maximum flooding surface is mostly with high continuity and high amplitude on seismic sections,and some downlaps on the boundary can be observed at different locations of the basin.The surface always corresponds to thick mudstone intervals of well data.
The lower segment of the Late Miocene Minghuazhen Formation was subdivided into two third order sequences and four systems tracts(see Fig.2).Low stand systems tract(LST)was not developed due to the lack of lacustrine basin slope break belts(Liu et al.,2004,2016,2006).The identified transgressive systems tracts(TST)and high stand systems tracts(HST)corresponded to the expansion and shrinking periods of the lakes,respectively.
4.2. High-frequency sequence stratigraphy

Fig.2 Framework of the third-order sequences of the lower segment of Minghuazhen Formation in the Huanghekou Sag.Sequence classification was based on combination of well log and seismic data.See Fig.1 for the location of the section.a—Sequence classification of drilling well data;b—Sequence classification of seismic data.
A key oil- field area(BZ34 Area)and an important oil-producing interval(SQ1)are selected respectively for high-frequency sequence identification and classification.The unit of stratigraphic classification is a parasequence set.Classic sequence stratigraphy defines parasequence set as a stratigraphic succession genetically related parasequences which contain characteristic stacking pattern bounded by major marine flooding surfaces and their correlative conformities.In some cases,one or both boundaries of a parasequence set will be a sequence boundary(Van Wagoner et al.,1988).Progradational,retrogradational and aggradational parasequence sets were recognized in the study area according to the differences of their stacking patterns.
Progradational parasequence sets were formed when sedimentation rate was higher than the growth rate of accommodation space,where thickness of sandstones continuously increased and thickness of mudstones decreased.The sand to mud ratio increased from bottom to top.The sand/mud formed a parasequence stacking pattern,with lake-level shoaling from bottom to top.Retrogradational parasequence sets were formed when sedimentation rate was less than the growth rate of accommodation space,where thickness of sandstones continuously decreased and mudstones decreased. The sand to mud ratio increased,accompanied by water body deepening from bottom to top.The sand/mud formed a parasequence stacking pattern with lake-level rising from bottom to top.Aggradational parasequence sets were formed when sedimentation rate of sediments was equal to the increasing rate of accommodation space,with no significant variation in sedimentary thickness of sandstones and mudstones and the sand to mud ratio.The sand/mud formed a stacking pattern, and generally,the water depth of each parasequence set was almost unchanged.

Fig.3 Section of classification and comparison of parasequence sets in SQ1 in the lower part of Minghuazhen Formation in Huanghekou Sag.See Fig.1 for the section location.a—Sequence classification of drilling well data;b—Sequence classification of seismic data.
The relatively intense pattern in the BZ34 region and higher resolution of seismic data served as basis for spatial comparison and analysis of high-frequency sequences.In particular,parasequence sets were classified among multi-wells.The corresponding seismic boundary was determined strictly in accordance with log synthetic records.3-D space of high frequency sequence was classified and compared based on seismic data.
According to the above-mentioned analyses,10 parasequence sets were classified in the BZ34 block,including four TST and six HST sets.Additionally,the stratigraphic framework of high-frequency sequence was established(Fig.3).Type of parasequence set was obviously related to systems tracts of the sequence.Progradational parasequence sets were mainly developed in the early TST (PSS2)and late HST(PSS8—PSS10)periods.Retrogradational parasequence sets were developed in the earlier(PSS1)and late(PSS1)TST periods,while aggradational parasequence sets were developed in the early HST(PSS5—PSS7)period.
5. Sedimentary facies
Fluvial delta and lacustrine deposits were identified in the lower segment of Neogene Minghuazhen Formation(Fig.4).
Fluvial sediments were developed primarily in the periphery of the study area,and presented as lateral filling of channels according to the reflection on seismic profiles.Normal meandering fluvial facies was subdivided into channel over bank, flood deposits and oxbow lakes.
Delta developed in northeast,northwest,southwest and east of the study area and was subdivided into inner coastal and outer coastal margins.Inner coastal margin can be subdivided into subaqueous distributary channels and estuarine.Main subaqueous channel mainly included pebbly coarse-grained sandstones,coarse-grained sandstones,medium-grained sandstones and fine-grained sandstones.Well log curves are characterized by high resistance,low gamma,and a clock or hopper type of abnormally positive magnitude of spontaneous potential.River mouth bar was not developed very well due to weak hydrodynamics of shallow lake,rapid channel progradation,and its strong reconstruction of the original estuarine sediments(Dai et al.,2007;Li et al.,2014;Xu et al.,2002;Zhu et al.,2008).The outer coastal margin of meandering fluvial delta can be subdivided into subaqueous distributary channels,distal sand bars,and inter-distributary micro-facies.Sediments of subaqueous distributary channels mainly included medium-grained sandstones and fine-grained sandstones.Well log curves are characterized by high resistance,low gamma,and clock,hopper and box types of abnormally positive magnitude of spontaneous potential.Distal sand bars mainly include finegrained sandstones,powder sandstones,muddy powder sandstones and mudstones,with development of indistinct cross-bedding and massive bedding.Well log curves are characterized by high resistance,low gamma,and clock,hopper and box types of abnormally positive magnitude of spontaneous potential of saline mud(Fig.5).Lacustrine facies mainly included shore shallow lacustrine deposit,which can be further divided into sand banks,mixed beaches and mud flats.
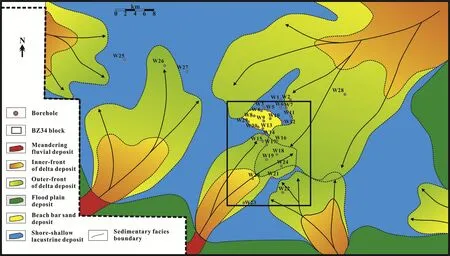
Fig.4 Facies distribution of the lower segment of Neogene Minghuazhen Formation in the Huanghekou Sag Micro-facies was subdivided for sandstone reservoir analysis.

Fig.5 Sequence classification and sedimentary facies analysis of Well W21.
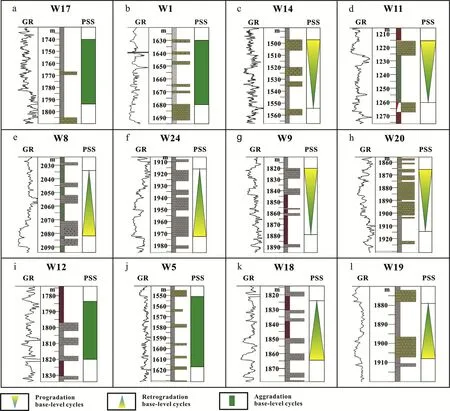
Fig.6 Lithology of typical drilling well and well log of different parasequence sets in SQ1 of BZ34 block. Thick,medium and thin sandstones in the statistics were not classified according to industrial standards,but rather,based on distribution of local lithology and its combination features:thin sandstones<4 m;4 m<medium sandstones<10 m;thick sandstones>10 m.Similar descriptions in the text below take the same standard.
6. Analysis of the development features of lithologies
The statistics and analyses of the development features of lithologies were based on wells in the study area,including statistics of main lithology types,thickness of sandstones/mudstones, relationship between types of parasequence sets and the lithology combinations in different systems tracts.These statistical results serve to directly analyze the relationships between different lithology combinations and forward seismic amplitude features.
6.1. Lithology types and thickness distribution features of sandstones
SQ1 mainly contains fine-grained sandstones,equigranular sandstones,pebbly fine-grained sandstones and siltstones and mudstones.According to sand thickness,single sandbodies were developed in PSS1,with a maximum thickness of 23 m.Maximum thickness of sandbodies of mid-lower part of HST was usually less than 10 m.Thicknesses of the thinnest single sandbodies was less than 1 m.According to the frequency distribution analysis of sandbody thickness of each parasequence set,most single sandbodies were siltstone with a thickness range of 1—3 m.Thick and coarse-grained sand of over 10 m mostly occurred in PSS1 and PSS10.
6.2. Types of parasequence sets in systems tracts framework and statistics of their lithology combinations
Aggradational and progradational parasequence sets were developed in the HST.Two types of lithology combinations were developed in the aggradational parasequence sets(including PSS5—PSS7).The first type consisted of 10—60 m thick massive mudstones and 1—4 m thick medium-and thin-bedded sandstones(Fig.6a);the second type consisted of interbed of 1—5 m sandstones and 3—15 m mudstones(Fig.6b).Both were developed in the progradational parasequence sets(PSS8—PSS10):abrupt contact of sand and mud(thickness of sandstones:3—16 m;thickness of mudstones:25—50 m)and ramp contact of sand and mud(thickness of sandstones:2—16 m;thickness of mudstones:3—40 m)(see Fig.6c and d).
The lacustrine TST can be divided into early and late TST. Retrogradational and progradational parasequence sets were developed in the early lacustrine TST.The retrogradational parasequence sets(PSS1)developed two types of lithology combinations in the study area:ramp contact of sand and mud(thickness of sandstones:2—23 m;thickness of mudstones:3—40 m)and a large set of sandstones interbedded with mudstones(thickness of sandstones:8—23 m;thickness of mudstones:1—13 m)(shown in Fig.6e and f).Progradational parasequence sets(PSS2)developed ramp contact of sand and mud(thickness of sandstones:1—10 m;thickness of mudstones:10—30 m)and abrupt contact of sand and mud(thickness of sandstones:3—14 m;thickness of mudstones:1—40 m)(see Fig.6g and h).Parasequence sets in the late TST(PSS3,PSS4)were mainly aggradational-retrogradational sets,with a large set of mudstones consisting of medium sandstones(thickness of sandstones:4—8 m;thickness of mudstones:6—40 m)and alternative beds of sand and mud(thickness of sandstones:1—5 m;thickness of mudstones:3—15 m)(shown in Fig.6i and j).The retrogradational parasequence sets developed ramp contact of sand and mud(thickness of sandstones:1—5 m;thickness of mudstones:7—40 m)andabrupt contact of sand and mud(thickness of sandstones:3—10 m;thickness of mudstones:10—40 m)(see Fig.6k and l).

Fig.7 Distribution maps of RMS amplitude of each internal parasequence set in SQ1,with united value ranges for RMS amplitude.
7. Statistics and analysis of relationship between seismic attributes and lithology at well locations
7.1. Extraction and selection of seismic attributes
There are many types of seismic amplitudes,including RMS amplitude,average absolute amplitude,maximum peak amplitude,average peak amplitude,maximum trough,and peak values,etc.RMS attribute is to obtain the root-mean-square amplitude by calculating the RMS value of amplitude of each sampling point in seismic trace analysis.RMS amplitude is squared before it is averaged.It is very sensitive to amplitude variation and is especially helpful to distinguish anomalous bodies in seismic bodies.Therefore,we analyzed the distribution of sandbodies by using RMS amplitude.
The thicknesses of the parasequence sets in the study area were generally 20—100 m.The time for two way seismic travel was approximately 7—40 ms.Most of them are thinner than 10 m and less than 1/4 wave length of a seismic resolution.The maximum thickness of a single sandbody was 23m.Therefore,top and bottom surfaces of the window during extraction of the seismic RMS amplitude,corresponding to the top and bottom surface of a parasequence set,respectively.These methods were helpful to convey the actual appearance of sandbodies in targeted section.Fig.7 shows 2-D distribution of RMS amplitude of 10 parasequence sets in SQ1.
7.2. Statistics and analysis of wave impedance of sandstones/mudstones
According to the statistics of multi-wells,speeds of different lithologies in this area were 2800—3200m/s for sandstones and 2700—3000 m/s for mudstones.Wave impedance of the corresponding sandstones and mudstones were 6500—8000 and 5500—7000,respectively.Only sandstones and mudstones developed in this area.Although a considerable impedance overlap occurred between them,sandstones were statistically higher in impedance compared to mudstones(Fig.8).Wave impedance of sand/mud was separable with great difference,and provided a theoretical basis for sandbodies prediction in accordance with amplitude,according to the forward synthetic seismograms of this area.
7.3. Statistics and analysis of therelationship between RMS amplitude and lithology at well locations
Statistics of the relationship between RMS amplitude and lithology in different parasequence sets in the study area was gathered in details using statistical methods.Following conclusions were obtained:
1)The lithology combination of compound thick alternating beds corresponds to high amplitude;
2)The lithology combination of mudstone with thick sandstone corresponds to medium—high amplitude;
3)The lithology combination of mudstone with medium-thick sandstone corresponds to medium amplitude;
4)The lithology combination of thin mud-sand alternating beds corresponds to medium—low amplitude;
5)The lithology combination of a large set of mudstone with thin sandstone or to those mainly with a large set of mudstone corresponds to low amplitude.

Fig.8 Analysis graphics of the speed of sand/mud in BZ34 block,Huanghekou Sag,Bohai Bay Basin,northern China.

Table 1 Statistics of the relationship between lithology combination and RMS amplitude of drilling wells in BZ34 block,Huanghekou Sag,Bohai Bay Basin,northern China.
Taking PSS1 as an example,statistics of lithology combination and amplitude features of main wells in the BZ34 block were gathered in details(Table 1).The data showed that amplitude and lithology combination agreed well with each other,with a coincidence limit up to 95.24%which is helpful for the authors in providing evidence of sandstone prediction using high,medium—high and medium amplitude.
8. Analysis of 1-D forward seismic models of relationship between lithology combination and amplitude variation
According to the results of wave impedance analysis,the basic parameters for 1-D forward seismic models were as follows:speed of sandstones ranged from 2800 to 3200 m/s with a mean value of 3000 m/s;speed of mudstones ranged from 2700 to 3000 m/s with the mean value of 2850 m/s.It is difficult to obtain density data,which were obtained by using Gadner's empirical formula.The dominant frequency of 3-D seismic wavelet in the study area was 30 Hz.Data from 1-D forward seismic models were analyzed according to the statistical results of lithology combination after proper classification.
8.1. Forward seismic model of simple single sandbodies

Fig.9 Forward seismic model of simple single sandstones.

Fig.10 Forward seismic models of single sandstones with thickness larger than 10 m.a—Lithology of drilling wells;b—Geological model design and forward seismic records.
The total stratal thickness is 48 m,and the thicknesses of all single layer sandbodies are 24 m,20 m,16 m,12 m,8 m,4 m,and 2 m respectively.In the model,red color represents mudstones and yellow represents sandstones(the same as below)(see Fig.9).According to the forward seismic models,the amplitude decreased with the decreasing of thickness of single layer sandbody,and the reflection boundary moved downward.The amplitude reached the lowest when sandstone was 2 m thick.When the thickness was less than the tuning point,stratigraphic thickness can be confirmed only by the intensity of amplitude,and therefore,amplitude was important in revealing the thickness of sandstones and mudstones.

Fig.12 Forward seismic model of lithology combination of sandstone intercalated with mudstone.a—Lithology of drilling well;b—Geological model design and forward seismic records.
8.2. Forward seismic model of single sandstones with thickness larger than 10 m
Lithology combination of this model was mainly from the parasequence sets in early lacustrine TST and late HST which included a large set of mudstone with a single-layer thick sandstone(thickness of sandstone>10 m,mudstone>20 m).According to the analysis,distributary channels were dominant microfacies.The results of forward seismic models indicated that seismic reflection of sandstones of this lithology combination and its seismic micro-facies was characterized by high amplitude(Fig.10).

Fig.11 Forward seismic models of multiple sets of sandstones with thickness larger than 10 m.a—Lithology of drilling well;b—Geological model design and forward seismic records.
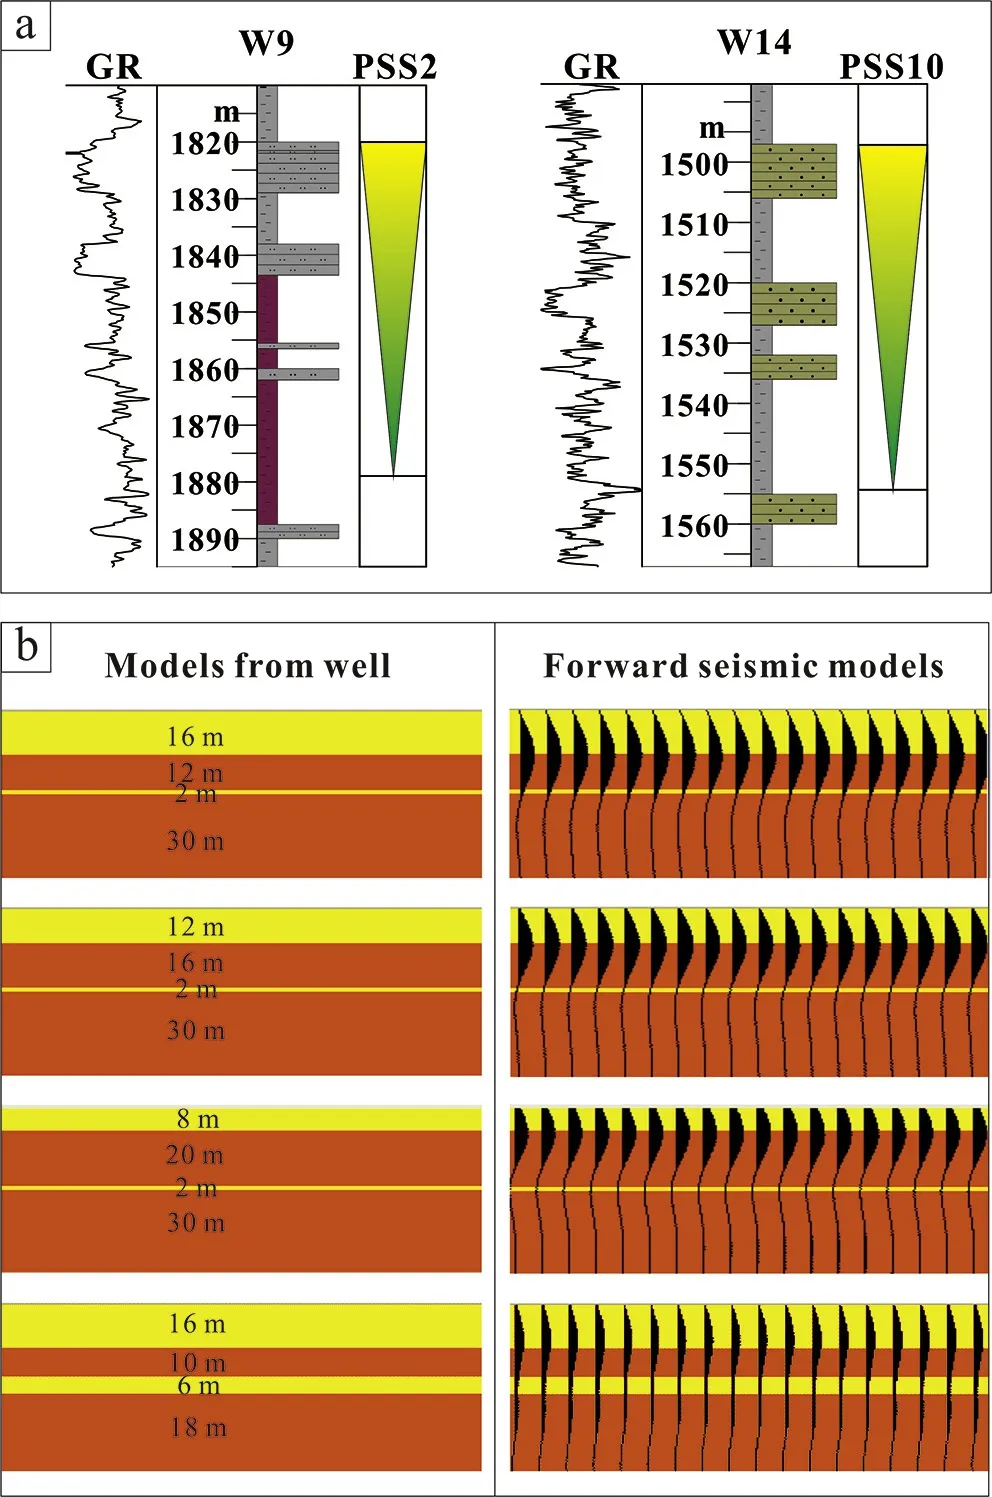
Fig.13 Forward seismic model of progradational sand and mud combination.a—Lithology of drilling well;b—Geological model design and forward seismic records.
8.3. Forward seismic model of multiple sets of sandstones with thickness larger than 10 m
According to the development features of sandstones in the early lacustrine TST and late HST,multiple thick bedding of sandstones(sandstones>10 m)obviously overlapped with each other,and the mudstones interlayered within the sandstones were usually thinner than 10 m.According to the results of forward seismic models,this rock unit was mostly characterized by composite high amplitude on seismic reflection.Seismic micro-facies included mainly distributary channel,developed in the shallow delta front(see Fig.11).
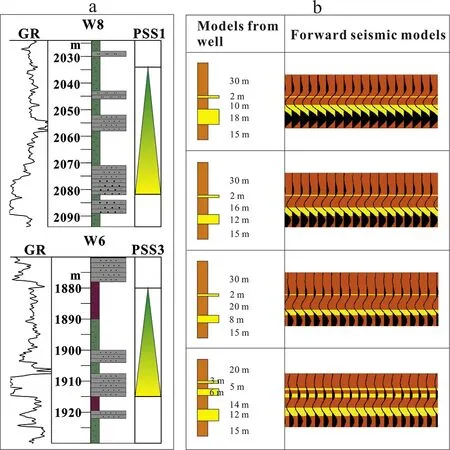
Fig.14 Forward seismic model of retrogradational sandstone and mudstone.a—Lithology of drilling well;b—Geological model design and forward seismic records.
8.4. Forward seismic model of lithology combination of sandstones intercalated with mudstones
The lithology was mudstone intercalated with thin sandstone or mudstone intercalated with mediumthick sandstone.Mudstones(3—12 m)were generally thicker than sandstones(2—6 m).They were mainly developed in early HSTand secondly in late lacustrine TST.The results of forward seismic modeling indicated that amplitude and wavelet features of this type of lithology combination was compound medium—low amplitude,and amplitude of mudstones intercalated with medium sandstones was obviously higher than that of thin sand(see Fig.12).The analysis of sedimentary micro-facies for drilling well supported that this lithology combination was thinner subaqueous distributary channel and distal sand bar.
8.5. Forward seismic model of thick mudstones intercalated with medium-thin sandstones
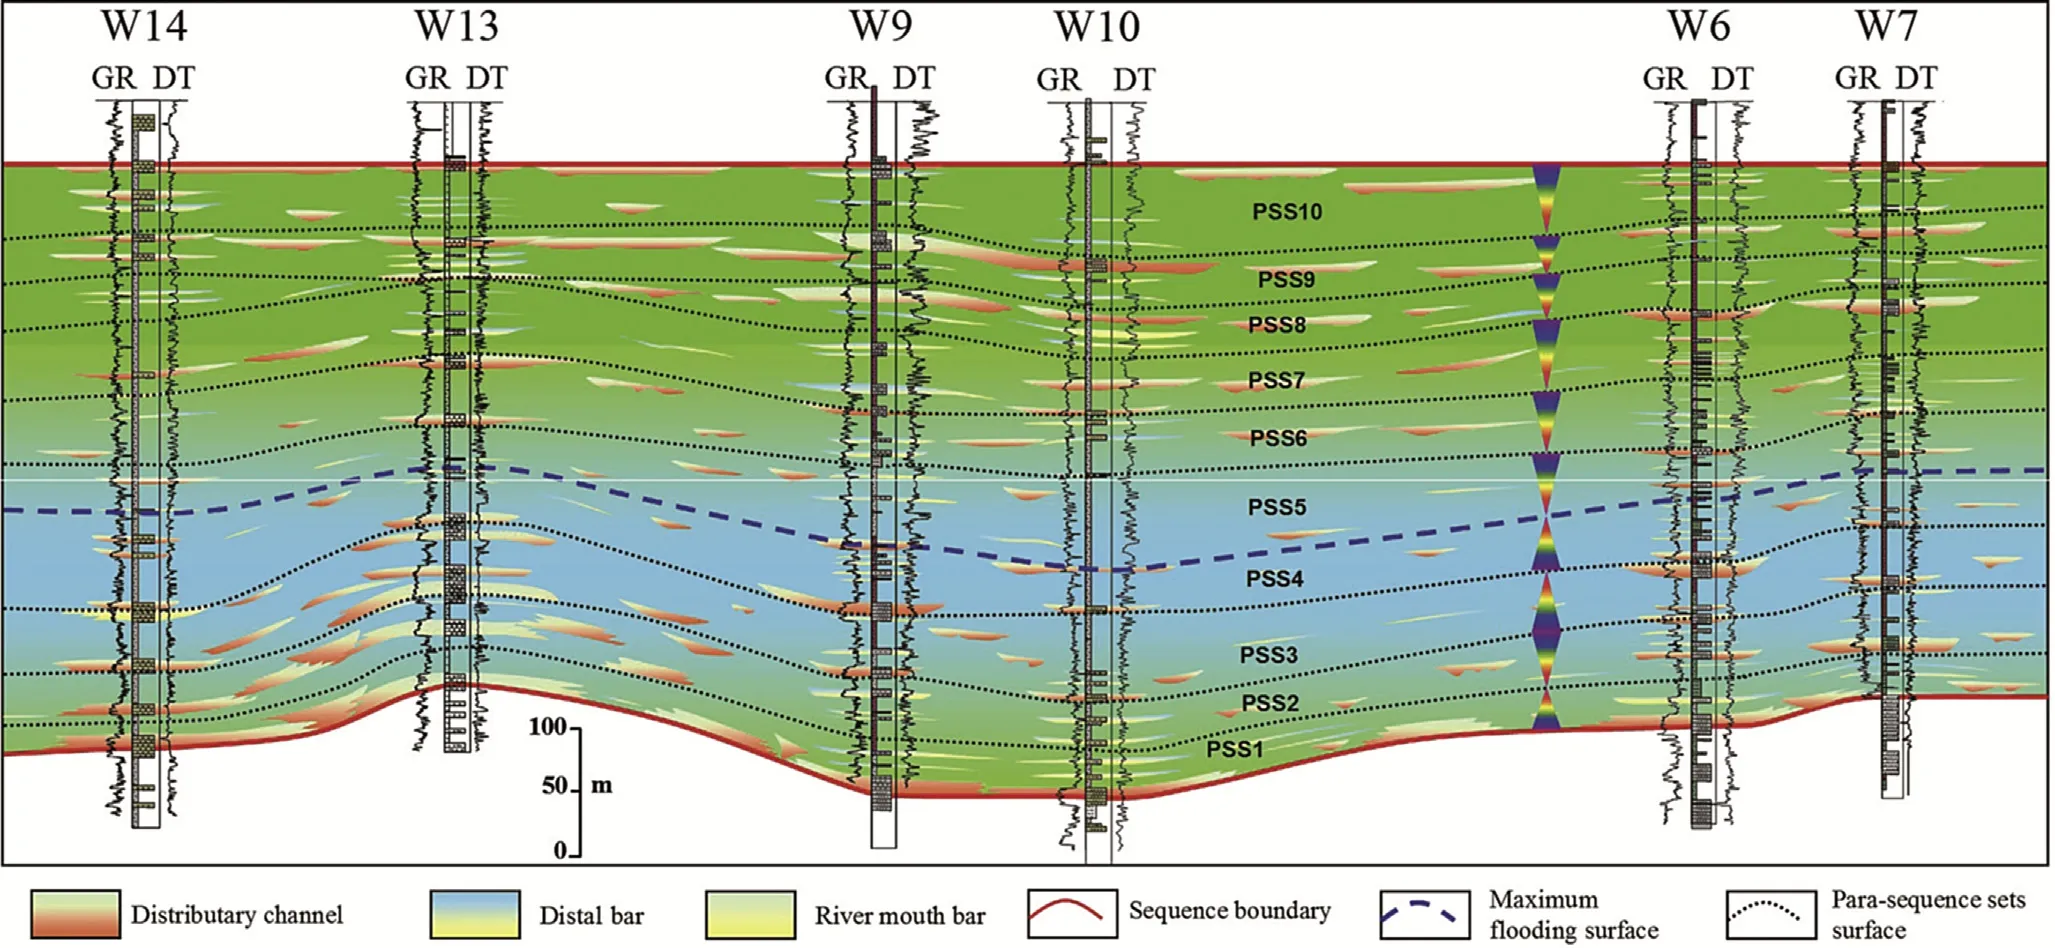
Fig.15 Classification of high-frequency sequences and description of sandbodies in BZ34 block,Huanghekou Sag,Bohai Bay Basin,northern China.Interpretation of sandbodies and their sedimentary micro-facies were mainly according to seismic reflection and lithology features shown by drilling well and well log data.
This type was a large set of mudstones(12—40 m)intercalated with medium-thin sandstones(1—8 m).They were mainly developed in early HST and secondly distributed in late lacustrine TST.The amplitude was compound medium—low amplitude,and lower amplitude was the most typical one(see Fig.9).It usually reflected distal sand bar of delta front or sandbank of shallow lacustrine facies(Fig.6a).
8.6. Forward seismic model of progradational sand and mud combination
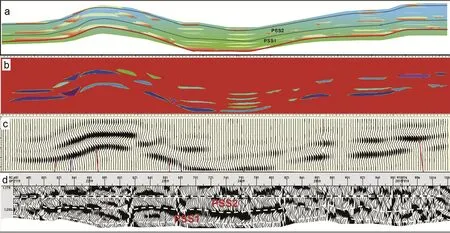
Fig.16 Comparison of sandbodies of the early lacustrine TST(PSS1 and PSS2)and forward seismic model results.a—Comparison profile of sandbodies from multiple wells;b—Sandbody model;c—Forward seismic model profile;d—Actual seismic profile.

Fig.17 Comparisons of sandbodies in the late lacustrine TST and early HST and forward seismic model results.a—Comparison profile of sandbodies from multiple wells;b—Sandbody model;c—Forward seismic model profile;d—Actual seismic profile.
The lithology combination is progradational,consisting of sandstones of 2—16 m thick and mudstones of 3—40 m thick.The top sandstones are generally thicker,approximately 8—10 m in general.They were mainly developed in late HST,and secondly in progradational parasequence set of late TST.The forward seismic model result was compound wave with medium to high amplitude(see Fig.13).
8.7. Forward seismic model of retrogradational sand and mud combination
The lithology combination is retrogradational,with sandstones of 2—14 m in thickness and mudstones of 3—40m in thickness.This type of lithology combination reflects a positive cyclic succession in which thickness gradually decreases with the rising of base level.They are mostly composite micro-facies of distributary channel systems consisting of distributary channels of multiple phases(it may include crevasse splays).According to the forward seismic model results, this set of strata was divided into two seismic events.Amplitude of the upper part was medium—low,and amplitude of the lower part was higher(see Fig.14).
9. 2-D forward seismic models analysis based on micro-facies and genetic sandbodies correlation
9.1. Spatial distribution pattern of typical sandbodies

Fig.18 Comparison of sandbodies in the late HST and forward seismic model results.a—Comparison profile of sandbodies of multiple wells;b—Sandbody model;c—Forward seismic model profile;d—Actual seismic profile.
The vertical distribution mode of sandbodies(see Fig.15)was extrapolated according to the seismic and drilling well data and amplitude features.Sandbodies were further developed and,for the most part,not connected in the longitudinal direction.Distributary channel and intra-channel micro-facies of delta front were developed in the early lacustrine TST(PSS1),with thicker sandbodies and coarser sand particles,which were mutually overlapped and joined on the side.Seismic amplitude was medium—low with wormshaped features and an undulating reflection.Delta front and prodelta sub-facies were developed in the late lacustrine TST—early HST,with sandbodies mostly distributing in an isolated lentoid,and features of low continuity,medium—low amplitude,worm shape and similar-spot on seismic reflection.Distributary channel of delta front was developed in the middle HST.But most channels were combination-plate-shaped sandbodies and their seismic features were characterized by high continuity,high amplitude,parallel—subparallel,and wave reflection.
9.2. 2-D forward seismic model of spatial distribution of sandbodies
Corresponding seismic records were obtained through forward seismic models.These models were designed according to geological concept mode of the established sandbodies.Forward seismic response showed a good corresponding relationship between seismic reflection features and actual geological models.
Figure 16 shows a comparison between sandbodies in the early lacustrine TST(PSS1 and PSS2)and forward seismic model results.According to the figure,sandbodies in the early age overlapped on the side and connected laterally with certain continuity.According to 2-D forward seismic model results,seismic reflection with medium continuity but high amplitude shows the overlapping and reconstruction of distributary channels in multiple phases.Strata of the actual seismic profile were mostly broken due to faultcontrolin late periods.However,macroreflection features of the strata after horizon flattening were similar to the forward seismic model results.
Sandbodies deposited in late lacustrine TST and early HST sedimentary periods were in isolated shape.Mudstones developed very well.The continuity was extremely low after the actual seismic profile was flattened,presenting as similar-spot seismic reflection with medium—high amplitude in the parts where sandbodies developed.The forward seismic model results indicated a more obvious isolated lentoid reflection features.However,the amplitude of different sandbodies varied greatly under the influence of speed variation,thickness and lateral extension distance of sandbodies(Fig.17).
The upper part of the sequence represented late period sedimentation of HST.Thickness of sandbodies gradually increased,in a board-shape splicing contact and accompanied with varying lateral connectivity.A set of wavelet with laterally high continuity,high amplitude,parallel—sub-parallel wave reflection were developed in the area near the parasequence set boundaries PSSB8 and PSSB9 on actual seismic profiles.Same features were reflected by 2-D forward seismic model.Decrease in continuity and amplitude on the right side of the profile agreed well with the actual profile(Fig.18).quantitatively determine sandstones thickness,relative thickness of sandstones was determined by amplitude.The validity of predicting horizontal distribution of sandstones must be carefully checked through the obtained drilling well information.Therefore,taking PSS1 as an example,we compared prediction results of sandbodies and actual lithology for drilling well(see Table 2).We found that the coincident rate of the predicted sandbodies with actual drilling well was high,and it is practical to use these prediction models to identify sandbodies.
Meanwhile,it is worth mentioning that establishing a rational relationship between lithology and amplitude depends on lithology combination in the study area.For example,the segment we studied is obviously characterized by a large set of mudstones
10. Discussion
Forward seismic models based on outcrops or drilling well data are widely used in hydrocarbon exploration(Biddle et al.,1992;Bracco Gartner et al.,2002;Chapin and Tiller,2007;Hodgetts and Howell,2000;Stafleu and Schlager,1995;Stemmerik et al.,1999).In combination with well-known geological sections or models,seismic modeling can provide insights into understanding and interpreting geological features which can be observed in seismic data(Bracco Gartner and Schlager,1999;Janson et al.,2007;Schwab et al.,2007;Shuster and Aigner,1994).In addition,2-D synthetic seismograms are very useful for investigating detailed seismic response of complex stratigraphic architectures(Anselmetti and Eberli,1997;Biddle et al.,1992;Bracco Gartner et al.,2002;Campbell and Stafleu,1992;Doherty et al.,2002;Falivene et al.,2010;Hilterman,1970;Janson et al.,2007;Kenter et al.,2001,2002;Schwab and Pince,1996).
The key problem of analyzing sandstone reservoir or sedimentary facies using seismic attributes is to establish the relationship between lithology combinations and seismic attributes through high frequency sequence study,lithology statistics of parasequence sets,analysis of wave impedance,1-D forward seismic models,2-D sandbody spatial distribution analysis and forward seismic models.A close relationship existed between them,i.e.,higher amplitude corresponding to well-developed sandbodies,lower amplitude corresponding to lack of sandbody development,and medium/high amplitude corresponding to a large set of mudstones intercalated with medium/thin sandstones.This type of relationship between lithology and amplitude can be directly used in the explanation of sandstones with RMS amplitude(Fig.19).Because it is difficult to intercalated with sandstones.Velocities of sandstones and mudstones are different to some degree,which provides a good foundation for lithology prediction using amplitude variation.Regarding lithology of very well-developed sandstones(e.g.,the Guantao Formation in the study area),the relationship between amplitude variation and lithology combination should be reconsidered.When the sandstones of a single layer were thicker(thickness of sandstones>24 m),the mudstones became thinner(<10 m in general).This relationship directly led to the decrease of seismic amplitude, whereas high amplitude reflection occurred only when mudstone interlayer was thicker than 10 m or even thicker.

Fig.19 Two-dimensional distribution of sandbodies in PSS1 of BZ34 block,Huanghekou Sag,Bohai Bay Basin,northern China predicted by RMS amplitude.Only relative thicknesses of sandstones were determined according to amplitude due to the impossibility of quantification of sandbodies thickness.

Table 2 Analysis of the coincident degree of prediction results and lithology of drilling wells of the PSS1 sandstones in SQ1 of BZ34 block,Huanghekou Sag,Bohai Bay Basin,northern China.
Combinations of different types of sandstones—mudstones reflected the origin of micro-facies using 1-D forward seismic models.2-D forward seismic models indicated that the spatial combination of these sandbodies led to various types of seismic reflection changes.Micro-facies obtained in 1-D forward seismic models agreed well with amplitude.Therefore,sandbodies distribution predicted according to amplitude strength also reflects the concept and features of micro-facies(Liu et al.,2016)(Fig.20).
11. Conclusions
1)A comprehensive analyses of seismic,drilling well,well log and core data of the lower segment of the Late Miocene Minghuazhen Formation revealed two third-order sequences and four systems tracts.SQ1 in the BZ34 area was divided into 10 parasequence sets.
2)SQ1 was dominated by sandstones and mudstones,with the largest thickness of a single sandbody of23m.Thick-beddeds and stones were mainly distributed in PSS1 and PSS10,while other parasequence sets were dominated by thin-bedded sandstones.The development of sandstones is related to its sedimentary positions within the same sequence.
3)The relationship between RMS amplitude and lithology at well locations in different parasequence sets in the study area were mainly as follows:lithology combination of compound thick alternating beds corresponds to high amplitude;lithology combination of mudstone with interbedded thick sandstone corresponds to medium amplitude;lithology combination of thin mudstone alternating beds corresponds to medium-low amplitude;lithology combination of a large set of mudstone interbedded with thin sandstone or large mudstone corresponds to low amplitude.
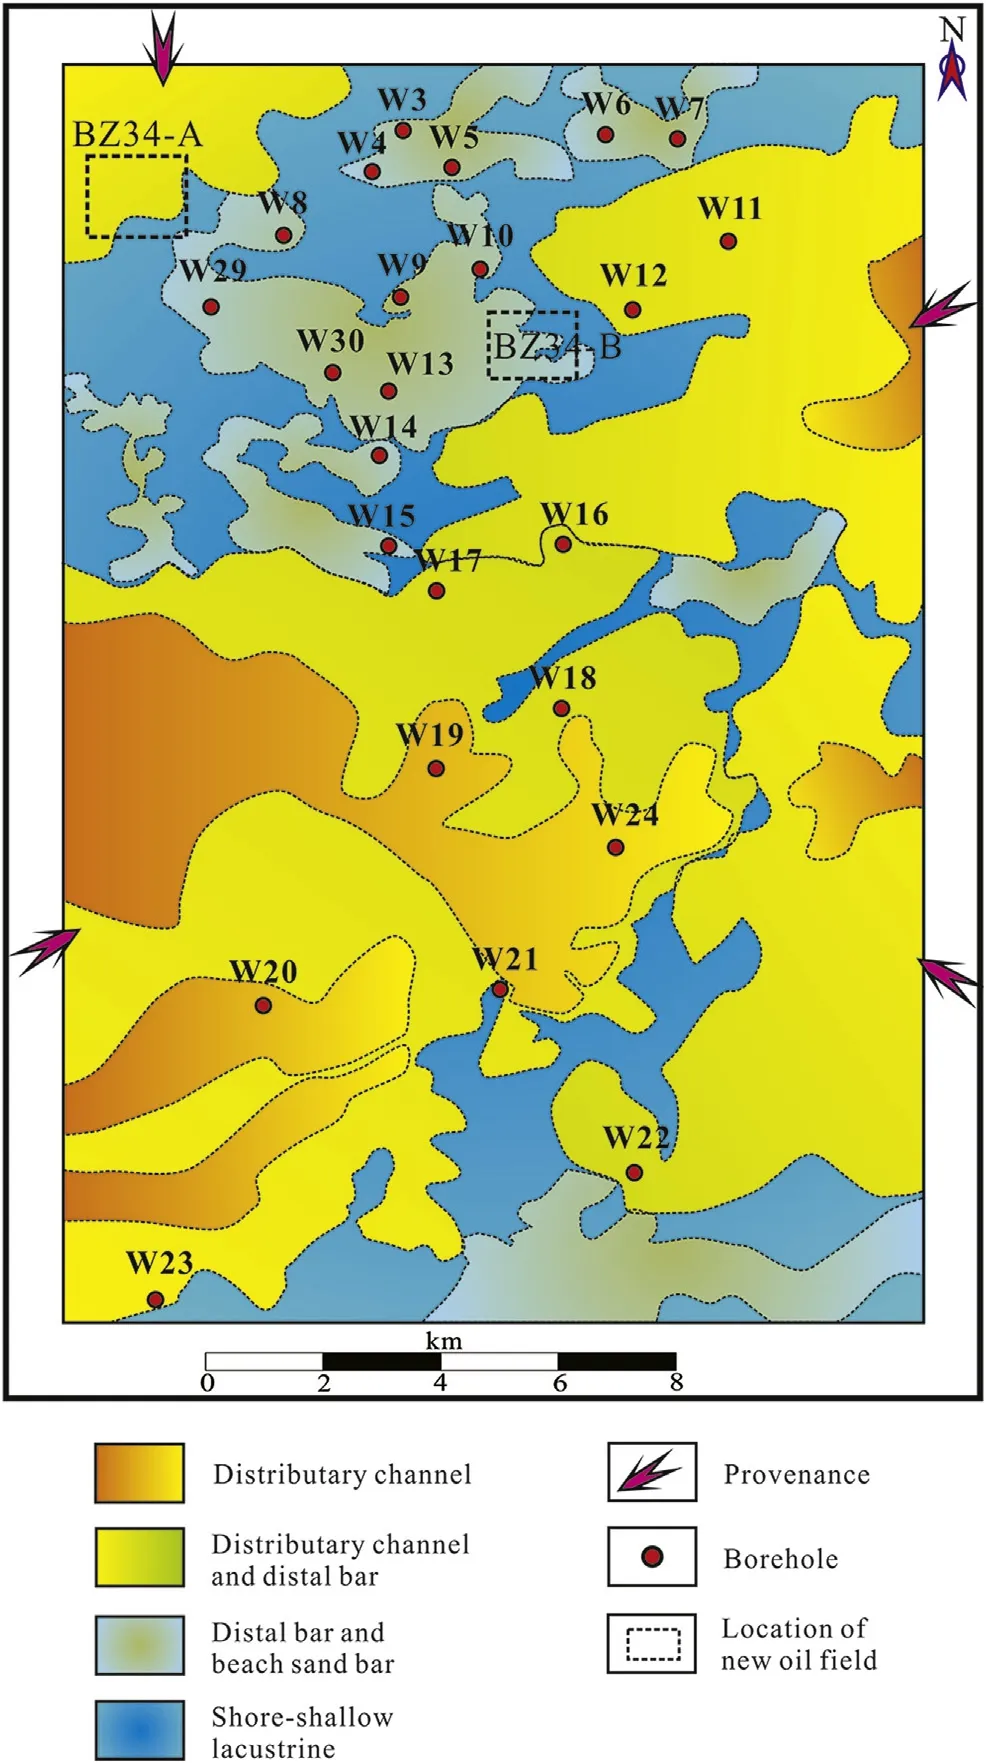
Fig.20 Micro-facies of PSS1 in BZ34 block,Huanghekou Sag,Bohai Bay Basin,northern China according to the prediction results of sandstones.
4)According to 1-D forward seismic model results,we find that high amplitude corresponds to development of thicker sandbodies,while lower amplitude corresponds to lack of sandbody development,and medium and high amplitude responds to large mudstones interbedded with medium and thinner sandstones.The forward seismic response shows a good corresponding relationship between seismic reflection features and actual geological models.
5)PSS1 was used to exemplify sandbodies in detail based on establishing the geologic-seismic models which indicated that coincident degree of sandbody prediction using this method is 95.5%after comparing the explanation results with actual drilling well.Different sand—mudstone combinations contain corresponding sedimentary micro-facies(or combination of multiple micro-facies),and therefore,sandbody analysis based on amplitude strength,also reflects the concept of sedimentary facies.
Acknowledgements
This work was funded by the National Science and Technology Major Project(Exploration Technologies for Offshore Hidden Oil/Gas)(Project No.:2016ZX05024-003-003).
 Journal of Palaeogeography2018年1期
- Journal of Palaeogeography的其它文章
- Late Triassic sauropodomorph and Middle Jurassic theropod tracks from the Xichang Basin,Sichuan Province,southwestern China:First report of the ichnogenus Carmelopodus
- Trace fossils of an amalgamated storm-bed succession from the Jurassic of the Kachchh Basin,India:The significance of time-averaging in ichnology
- Oxygenation in carbonate microbialites and associated facies after the end-Permian mass extinction:Problems and potential solutions
- Evolution of sedimentary facies and fossil communities in the Middle Permian Maokou Formation in Zigui County,Hubei Province,South China
- A redescription of the ichnospecies Koreanaornis anhuiensis(Aves)from the Lower Cretaceous Qiuzhuang Formation at Mingguang city,Anhui Province,China
- Deeply concealed half-graben at the SW margin of the East European Craton(SE Poland)—Evidence for Neoproterozoic rifting prior to the break-up of Rodinia
