Intensifi ed East Asian summer monsoon and associated precipitation mode shift under the 1.5°C global warming target
WANG Tao,MIAO Jia-Peng,SUN Jian-Qi,FU Yuan-Hai
a Nansen-Zhu International Research Center,Institute of Atmospheric Physics,Chinese Academy of Sciences,Beijing 100029,China
b Collaborative Innovation Center on Forecast and Evaluation of Meteorological Disasters,Nanjing University of Information Science and Technology,Nanjing 210044,China
c University of Chinese Academy of Sciences,Beijing 100049,China
d Climate Change Research Center,Chinese Academy of Sciences,Beijing 100029,China
Abstract In this study,the East Asian summer climate changes under the 1.5°C global warming(1.5 GW)target in 30 simulations derived from 15 coupled models within the Coupled Model Intercomparison Program phase 5(CMIP5)are examined.Compared with the current summer climate(1975-2005),both surface air temperature and precipitation increase signifi cantly over the East Asian continent during the 1.5 GW period(averageperiod 2021-2051).In northeastern China this is particularly pronounced with regional averaged precipitation increases of more than 7.2%,which is greater than that for the whole East Asian continent(approximately 4.2%).Due to stronger enhancement of precipitation north of 40°N,the leading empirical orthogonal function(EOF)mode of summer precipitation over the East Asian continent changes from tripolar-like mode to dipole mode.As there is stronger surface warming over the East Asian continent than that over surrounding ocean,the land-sea thermal contrast is enhanced during the 1.5 GW period.As a result,the monsoon circulation in the lower troposphere is significantly strengthened,which causesthe increased summer precipitation over the East Asian continent.In addition,larger interannual variabilitiesof East Asian summer monsoon circulation and associated precipitation are also suggested for the 1.5 GW period.
Keywords:East Asian summer monsoon;Precipitation;1.5°C global warming target;CMIP5
1.Introduction
The East Asian summer monsoon(EASM)is a subtropical monsoon system,whose domain includes eastern China,Korea,Japan,the adjacent marginal seas,and the South China Sea(Tao and Chen,1987;Wang and Lin,2002;Ding and Chan,2005;Ding et al.,2007).It leads to heavy rainfall during summer and provides up to two-thirds of the annual precipitation for most regionsof East Asia(Ding,1992;Gong and Ho,2003).Therefore,the EASM has tremendous infl uences on water resources,agriculture and human society throughout East Asia.
The EASM and associated precipitation has large interannual variabilities.Usually,changes in EASM intensity lead to a position shift of the major monsoon rainfall belt,which can be affected by the El Ni~no-Southern Oscillation(ENSO)(Wang et al.,2000;Wang,2002),Arctic sea ice(Guo et al.,2014),and some natural external forcings(Peng et al.,2010;Cui et al.,2014).
On an interdecadal timescale,signifi cant weakening of the EASM was found in the late 1970s(Wang,2001,2002).This had associated monsoon precipitation increases in the Yangtze River Valley region and precipitation decreases in northern China,showing a named southern fl ood and northern drought pattern(Ding et al.,2008,2009;Zhao et al.,2010).In addition,due to changes in background circulation,monsoon precipitation increases in the Huang-Huai region and decreases in the Yangtze River Valley from the end of 1990s have been observed(Zhu et al.,2011).As a result of these observations,the interdecadal variability of the EASM and its associated precipitation have become more prominent in the last 60 years(1950-2012)(Ding et al.,2015).
These interdecadal changes in EASM can be attributed to natural factors,such as the Pacifi c Decadal Oscillation(Qian and Zhou,2014;Yu et al.,2015;Zhu et al.,2015)and the Atlantic Multidecadal Oscillation(Wang et al.,2009;Zhu et al.,2016).However,more evidence indicates the tremendous impact of anthropogenic forcings,including increased greenhouse gases emissions and anthropogenic aerosols,on the EASM and its associated precipitation(Mahmood and Li,2012;Wang et al.,2013;Song et al.,2014).Therefore,more work is needed to detect the anthropogenic signal and related processes that are causing long-term changes of EASM.Understanding how the EASM and its associated precipitation respond to the expected global warming is especially critical in the 21st century.
In recent years,more attention has been paid to the projection of climatechangesin East Asia(Jiang et al.,2004;Sun and Ding,2010;Jiang and Tian,2013).Based on multi model results from the Coupled Model Intercomparison Program phases 3(CMIP3)and 5(CMIP5),changes in temperature(e.g.,Jiang et al.,2009;Xu et al.,2009;Chen et al.,2011;Wang et al.,2017a),precipitation(Gao et al.,2012;Chen and Sun,2013;Niu et al.,2015;Wu et al.,2016),and their extremes(Chen et al.,2012;Jiang et al.,2012;Wang et al.,2012;Chen,2013)by the middle and end of the 21st century,have been documented.As noted by Chen et al.(2011),summer temperature over China could increase by 3.7°C by the end of the 21st century under the A1B scenario.Besides,a more pronounced increase in precipitation can be found over the Huang-Huai region,Shandong Peninsula and Northwest China(Gao et al.,2012).China could experience increased amounts of fl ooding due to more frequencies of heavy rainfall at the end of 21st century(Chen et al.,2012).In addition,an atlas was also created by Dong et al.(2012),which shows the substantive results from the CMIP5 experiments'data on climate changes over the next 100 years.
To prevent dangerous anthropogenic interference with the climate system,a 2°C global warming target was used as a desirable temperature target in the Copenhagen Accord in 2009.Focusing on this target,possible climate changes over East Asia have been investigated(Suiet al.,2015;Jiang et al.,2016).In December 2015,the Paris Agreement agreed to pursueeffortsto limit thetemperatureincreaseto 1.5°Cabove pre-industrial levels.However,there is still a relative lack of scientifi c knowledge about the implications of 1.5°Cof global warming(hereafter abbreviated to 1.5 GW)(Hulme,2016;Mitchell et al.,2016;Henley and King,2017;Kong and Wang,2017).Therefore,to find out what the possible responses of EASM under the 1.5 GW target are,we investigate changes in the East Asian summer climate using CMIP5 multi model results.
In the remainder of this paper,Section 2 describes the models,data,and the method employed;Section 3 compares the simulated East Asian summer climate,including surface air temperature,precipitation and circulation,in the 1.5 GW period,with simulated current climate;Section 3 focuses on thepotential mean climateand interannual variability changes;and conclusions are given in Section 4.
2.Model,data,and method
Two sets of simulations from 15 coupled models within CMIP5 are analyzed in this study(Taylor et al.,2012).The historical simulations are forced by both the anthropogenic forcings(greenhouse gases,anthropogenic aerosols,and land use)and natural forcings(total solar irradiance and volcanic aerosols).The 21st century simulations are run under the Representative Concentration Pathway(RCP)mid-low-range(RCP4.5)emission scenarios which are employed in this study.Details for the 15 CMIP5 coupled models adopted in this study can be found in Table 1.In addition,the observed precipitation data used in this study is from the Climatic Research Unit Time-Series Version 3.24.01 data set(UEACRU et al.,2017).
The timing of 1.5 GW for each model is based on 31-year running averages of the global mean temperature with reference to 1869-1899(same method as Wang et al.,2017b).As shown in Table 1,the timing periods for 1.5 GW in these 15 CMIP5 coupled models are very different,implying the model-dependent responses of the climate system to possible further anthropogenic forcings.The average period for 1.5 GW is 2021-2051.To investigate the impacts associated with 1.5 GW,we mainly analyze the differences of the simulated East Asian summer(June-August)climatebetween the 31-year period centered at the timing of 1.5 GW and the current period(1975-2005).A standard t-test is applied hereto determine their signifi cance level.In addition to the single model analysis,the multi model ensemble(MME)results are also analyzed in this study.

Table 1 Details of 15 CMIP5 coupled models and their periods to reach 1.5 GW.
The empirical orthogonal function(EOF)analysis is used to investigate the shifting of the summer precipitation pattern over the East Asian continent during the 1.5 GW period.To examine the changes in intensity of EASM circulation,we use the EASM index defined as area-mean velocity at 850 hPa over the region of 110°-125°E,20°-40°N(Wang,2002).
3.Results
3.1.Surface air temperature and precipitation
During the 1.5 GW period,surface air temperature increases signifi cantly over the East Asian region(Fig.1).In the continental areas the surface air warming is stronger than that over the surrounding ocean.Such surface warming characteristics are captured by all models employed.In addition,the MME indicates that the warming maximums are located in western China.For the East Asian continent and the northwestern Pacifi c Ocean,surface air warming becomes stronger with increasing latitude.In addition,the magnitude of terrestrial warming is generally greater when compared with warming over the ocean at same latitude.
At the same time,summer precipitation is also enhanced over most regions of East Asia(Fig.2).Most modelssimulate increased summer precipitation over the Qinghai-Tibetan Plateau and higher-latitude regions,although the inter-model discrepancies are very large.CNRM-CM5,GISS-E2-R,and MRI-CGCM3 simulate signifi cantly decreased summer precipitation in the Yangtze River Valley.The MME suggests summer precipitation increased over most of the East Asian continental regions except for southeastern China.In addition,the maximum positive anomalies for summer precipitation are located over northeastern China and the Qinghai-Tibetan Plateau.Compared with the current climate,the summer precipitation increases by approximately 10%over these regions(Fig.3).For the northern part of the Indo-China Peninsula,the summer precipitation also increases by 5%.
Statistical analysis showed that regional averaged summer precipitation over the East Asian continent(20°-50°N,80°-140°E)will increase by ~1%to ~7%,depending on the model used,during the 1.5 GW period(Fig.4).The mean increase is more than 4.2%.In contrast,most models simulate a larger increase in averaged summer precipitation over Northeast China(40°-55°N,120°-140°E).The CNRM-CM5,GFDLCM3,and HadGEM2-CC models showed that the regional averaged precipitation will increase by more than 10%.The mean value of all the models reaches up to 7.2%,higher than the value for the whole East Asian continent.
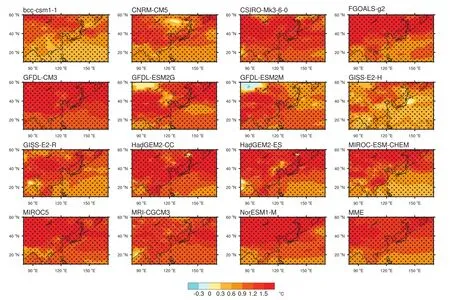
Fig.1.Simulated differences between a 1.5 GW rise and the current climate(1.5 GW-current)in summer surface air temperature(Areas with confidence level exceeding 95%are denoted with dots).
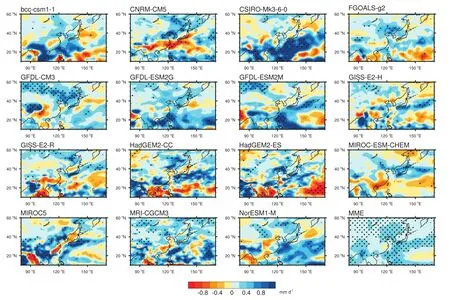
Fig.2.Simulated differences(1.5 GW-current)in summer precipitation(Areas with confidence level exceeding 95%are denoted with dots).
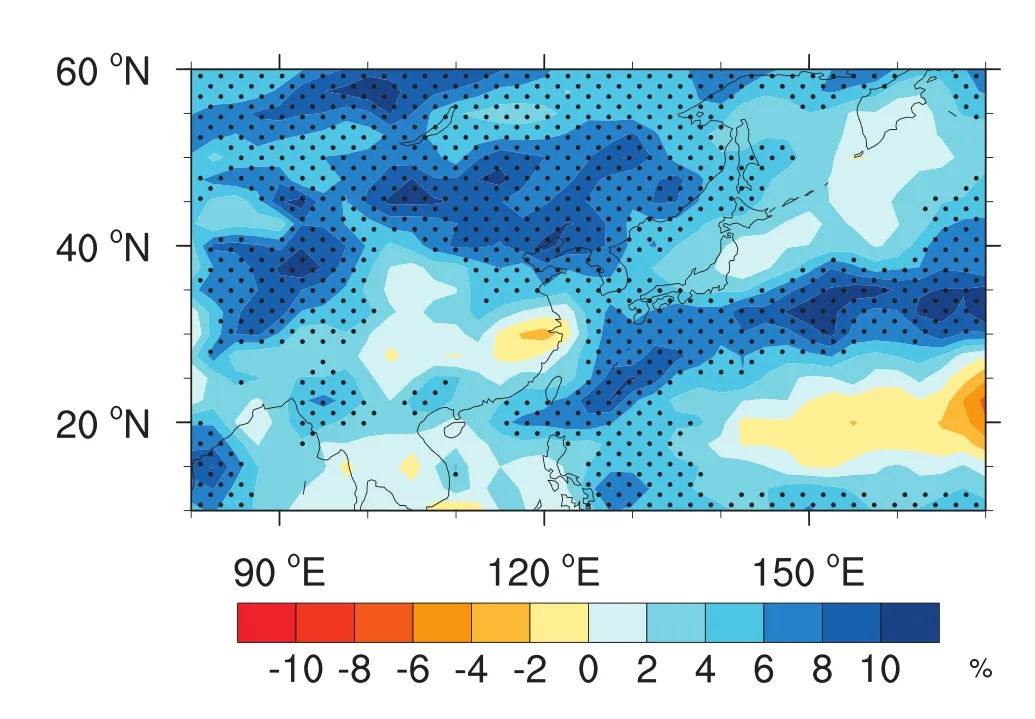
Fig.3.Simulated changes((1.5 GW-current)/current×100%)in summer precipitation(Areas with confidence level exceeding 95%are denoted with dots).
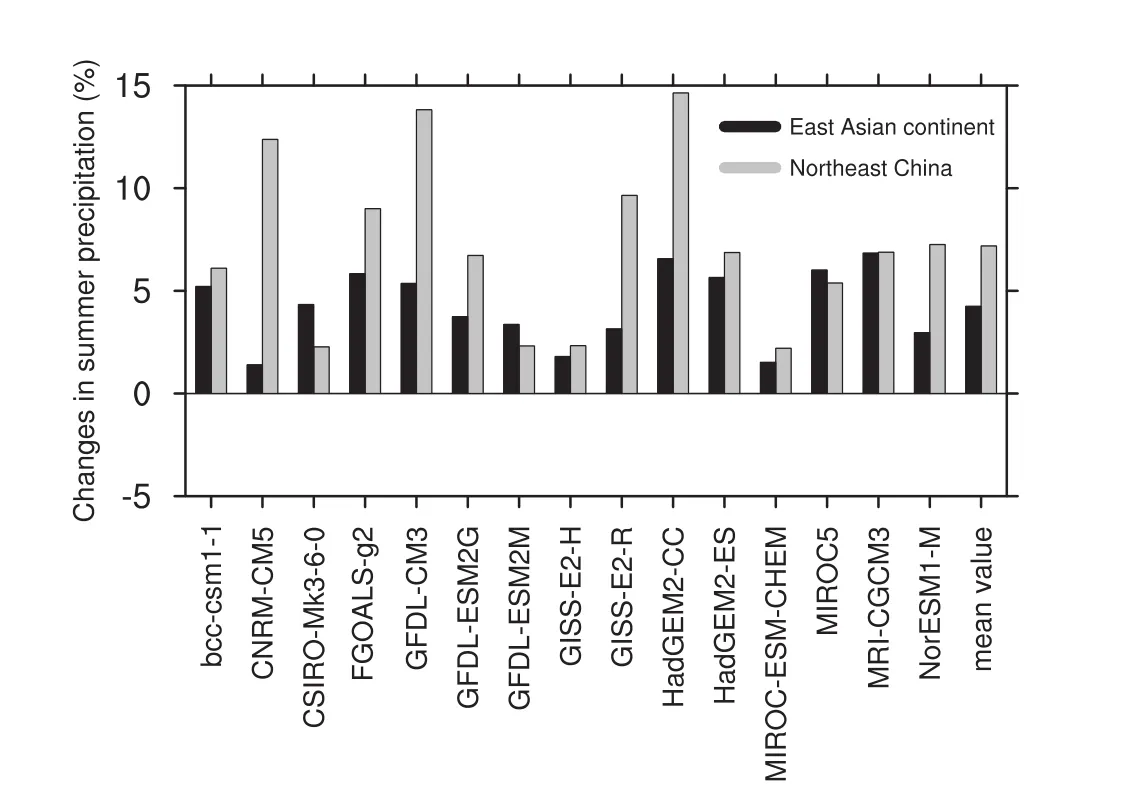
Fig.4.Simulated changes((1.5 GW-current)/current×100%)in regional averaged summer precipitation(unit:%)for the East Asian continent(20-50°N,80-140°E)and Northeast China(40-55°N,120-140°E).
Due to stronger increase in summer precipitation north of 40°N,the main EOF modes of summer precipitation anomalies over the East Asian continent shift during the 1.5 GW period.As shown in Fig.5a,the leading EOFmode in the observation is a tripolar-like precipitation anomaly pattern with positive anomalies in the Yangtze River Valley and negative anomalies over northern and southern China.Its explained variance is 19.0%.The observed second EOF mode is a dipole precipitation anomaly pattern,demonstrating reverse precipitation anomalies over northern and southern parts of China(Fig.5b).Here,the explained variance is 14.8%,slightly less than the leading mode.The MME for the current climate reproduces similar leading and second EOF modes of summer precipitation anomaly patterns in the observation(Fig.5c and d).Their explained variances are also close to the observed values.This suggests that the MME can capture the distribution characteristics of observed precipitation over the East Asian continent.For the 1.5 GW period,the MMEsimulatesdifferent EOFmodes.The leading EOFmode is replaced by the dipole precipitation anomaly pattern(Fig.5e),which is the second EOF mode in the current climate.Its explained variance reaches up to 26%,increasing by more than 10%and implying a significant raised likelihood of a north-south distribution of summer precipitation over the East Asian continent north of 40°N in the 1.5 GW period.The tripolar-like precipitation anomaly pattern becomes the second EOF mode and its explained variance is lowered to 13.6%(Fig.5f).
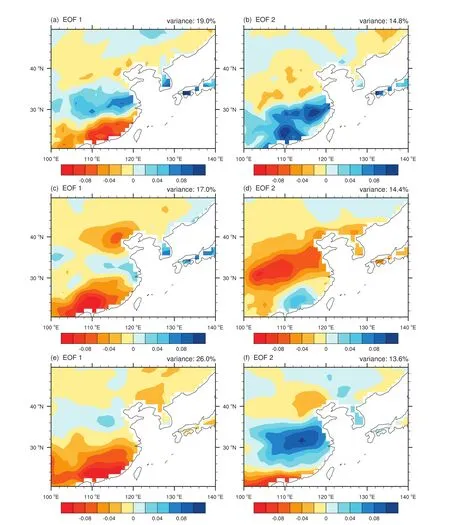
Fig.5.Leading and second EOFmodesof anomaloussummer precipitation in theobserved(a,b),CMIP5 current climate(c,d),and CMIP5 1.5 GW period(e,f).
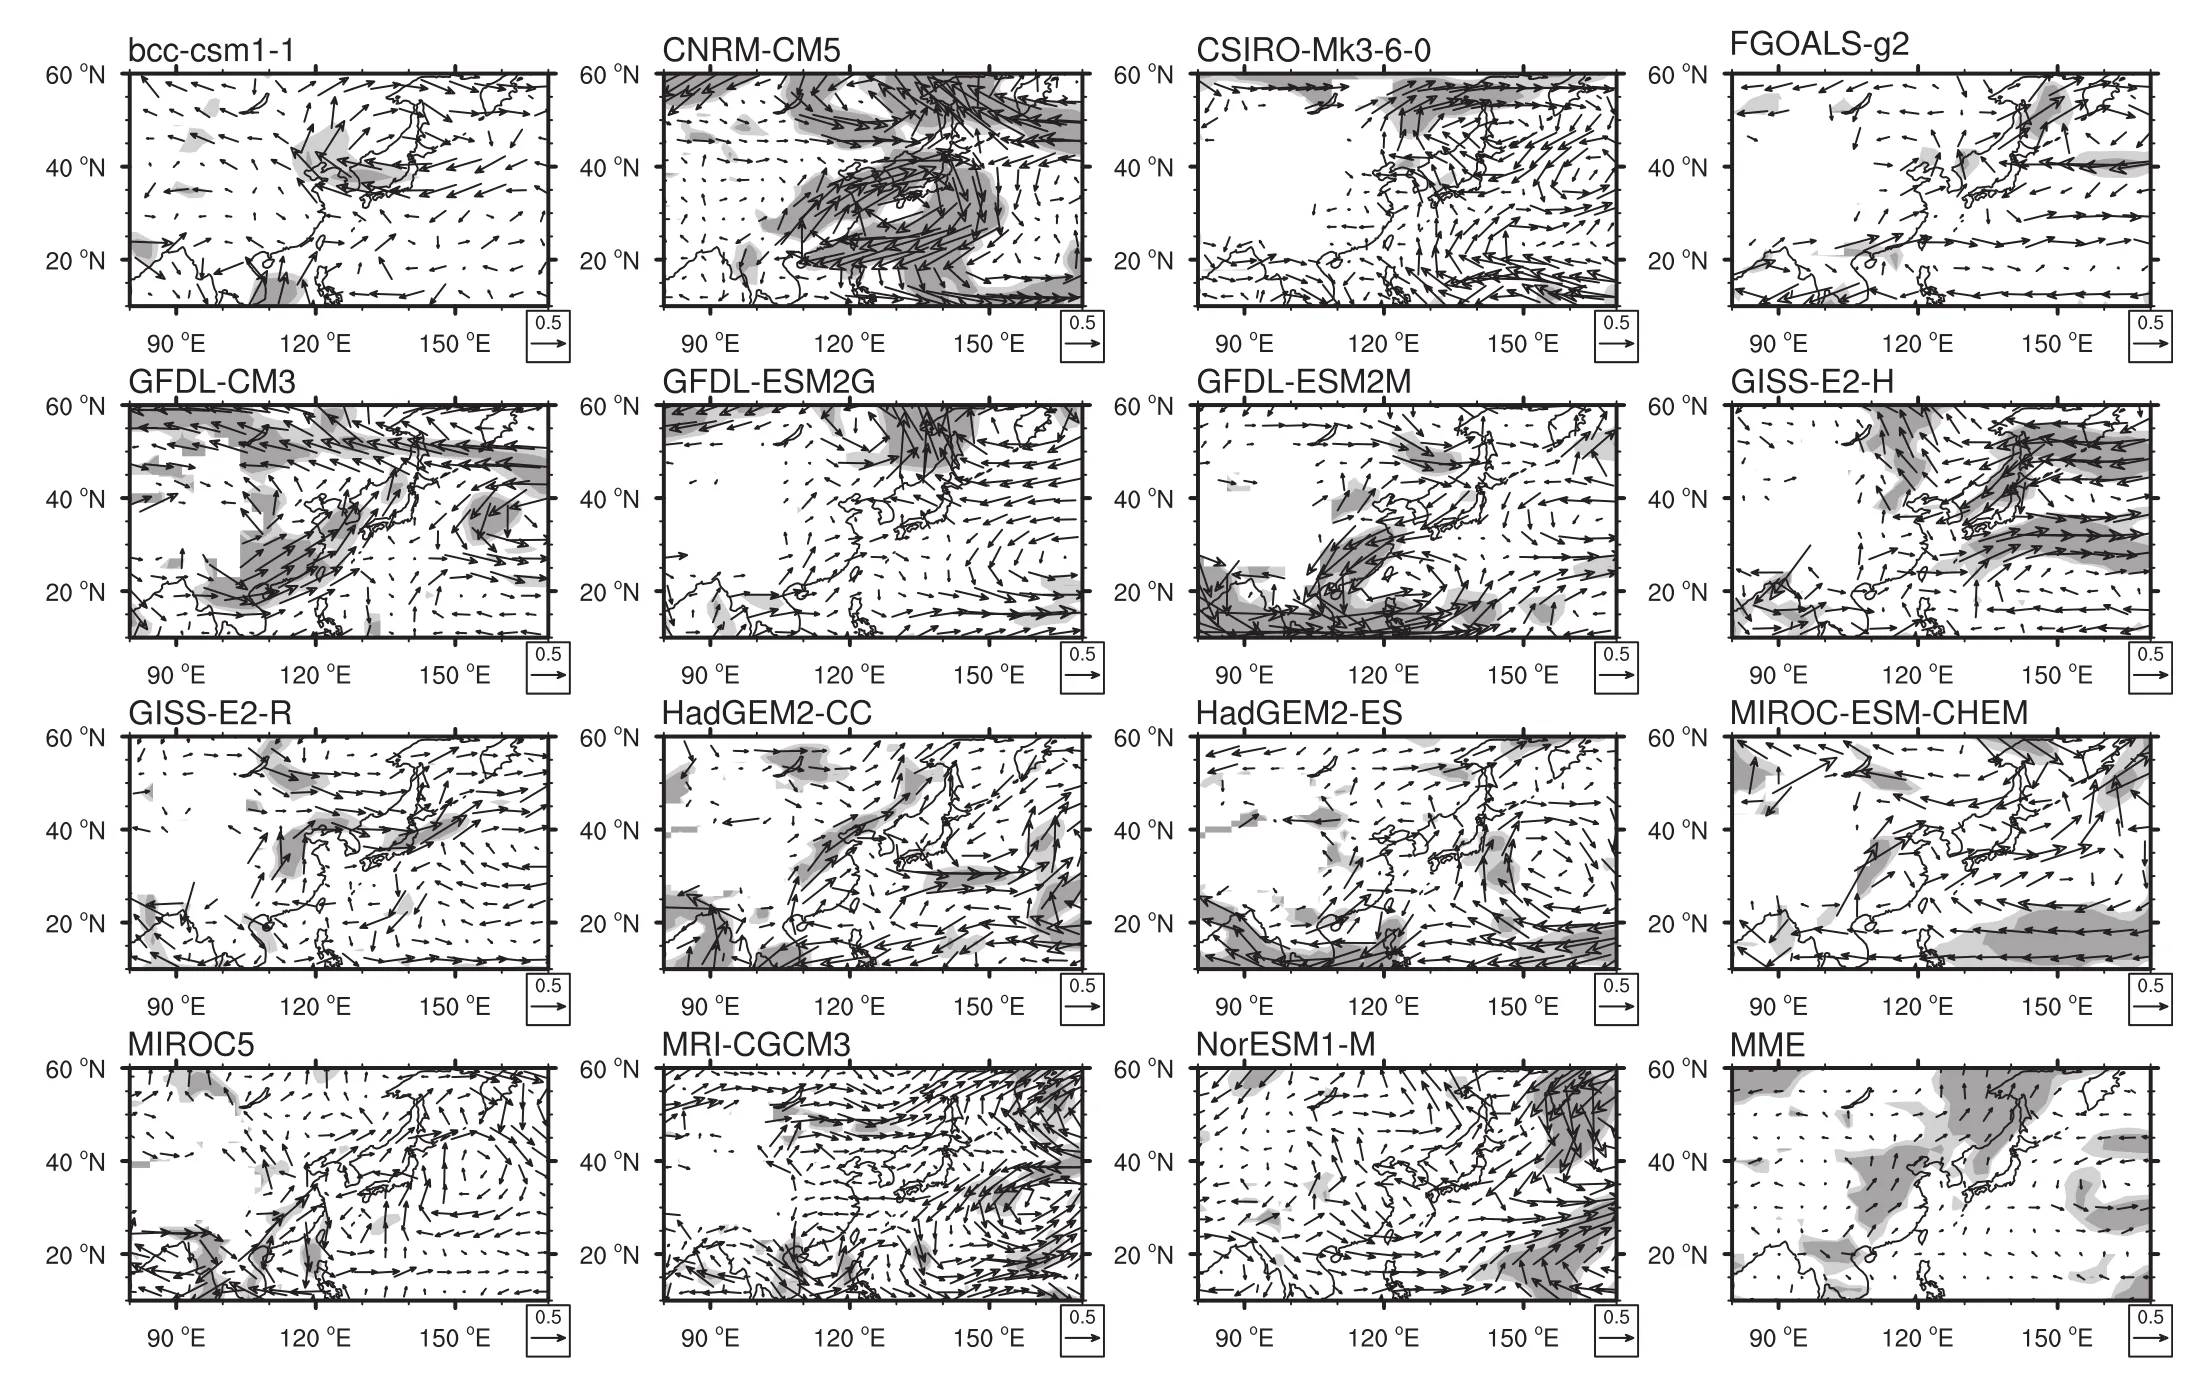
Fig.6.Simulated differences(1.5 GW-current)in summer wind fi elds at 850 hPa(unit:m s-1.Areaswith confidencelevel exceeding 90%/95%areshaded with light/gray).
3.2.Monsoon circulation
Changes in EASM circulation is the main factor causing precipitation anomalies in East Asia.Most models simulate a stronger EASM circulation for the 1.5 GW period(Fig.6).Southerly wind anomalies can be seen over the East Asian continent.Some differences between the models also exist.For example,the GFDL-ESM2M and MRI-CGCM3 models simulate northerly wind anomalies over southern China,whereas the MME shows significantly strengthened summer monsoon circulation over most regions of the East Asian continent.Therefore,the rainfall belt shifts more northward and summer precipitation increases over northern China,especially over northeastern China during the 1.5 GW period.Additionally,anomalously cyclonic circulation can be found over the northwestern Pacific.Together with C-shape positive summer precipitation anomalies there(Fig.3,MME),this anomalously cyclonic circulation suggests that the location of the western Pacifi c subtropical high will be more east when compared with the current climate.
Due to stronger surface warming over the East Asian continent compared with the surrounding ocean,as mentioned above,most modelssimulatenegativesealevel pressure(SLP)anomalies over the continental regions and positive SLP over the northwestern Pacifi c(Fig.7).Although there are some differences in the distribution and magnitude of the SLP anomalies,enhanced land-sea thermal contrast can be found in these models and cause stronger EASM circulation during the1.5 GWperiod.On thecontrary,GFDL-ESM2M and MRICGCM3 simulate negative SLP anomalies over the northwestern Pacifi c and weak positive SLP anomalies over some continental regions.Thus,the land-sea thermal contrast is reduced,which explains the emergence of northerly wind anomalies over southern China in these two models.
On the average,signifi cant negative SLP anomalies are evident over northwestern China and west of Lake Baikal in the MME(Fig.7).At the same time,significant positive SLP anomaliescan befound over the Qinghai-Tibetan Plateau,the Indo-China Peninsula,and tropical northwestern Pacific.This SLP anomaly pattern indicates an increased south-north land-sea thermal contrast and can result in the strengthened summer monsoon circulation in the lower troposphere.
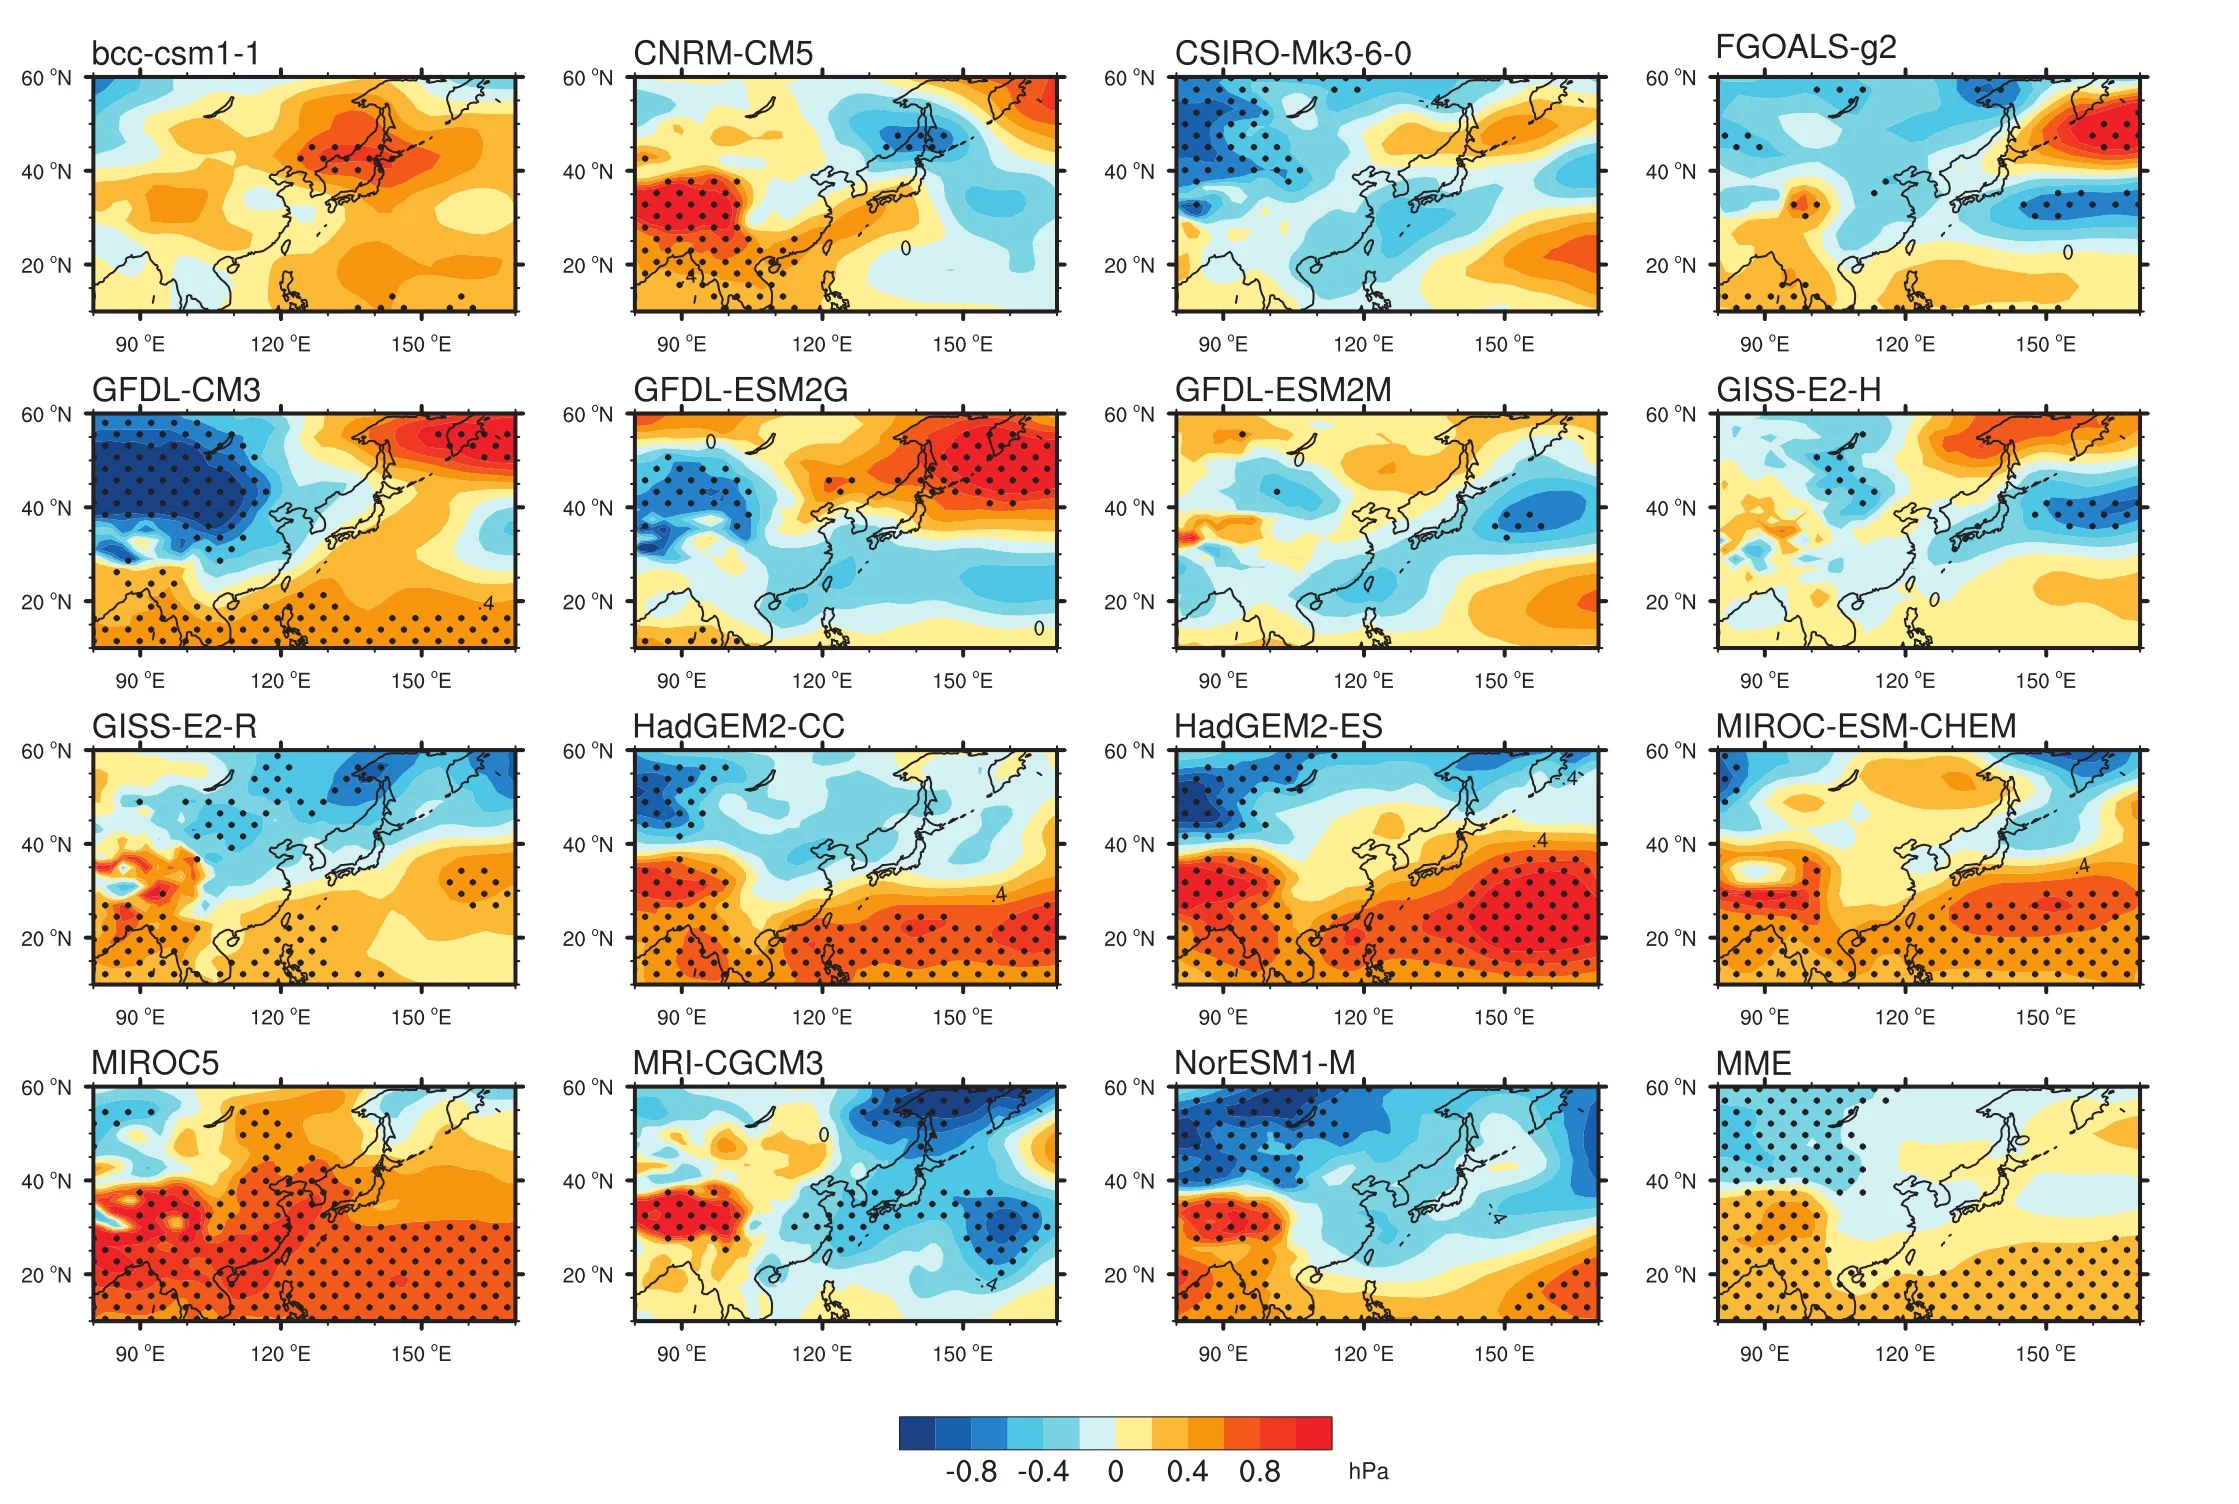
Fig.7.Simulated differences(1.5 GW-current)in summer sea level pressure(Areas with confidence level exceeding 95%are denoted with dots).
In the upper troposphere,changesin the East Asia westerly jet(EAJ)arevery different between modelsduring the1.5 GW period(Fig.8).CSIRO-Mk3-6-0,FGOALS-g2,GFDLESM2G,GFDL-ESM2M,and MRI-CGCM3 simulate a stronger EAJ.Yet,CNRM-CM5 and GISS-E2-R simulate a weakened and northward shifted EAJ.MIROC-ESM-CHEM simulates a significantly weakened EAJ.Other models do not simulatesignificant changesin EAJduring the1.5 GWperiod.For the MME,positive westerly wind anomalies can be found only over the entrance of the EAJ(Fig.8,MME).Associated secondary circulation can cause enhanced ascending motion,which explains the increased precipitation over the Qinghai-Tibetan Plateau and southern part of the Indo-China Peninsula(Fig.3).
3.3.Interannual variability of the EASM
The interannual variability of EASM responses to the 1.5 GW is a very important issue.Compared with the current climate,changesof standard deviationsof the EASM index for the 1.5 GW period vary among models and ranging from 40.1%(GFDL-ESM2G)to-34.7%(MRI-CGCM3)(Fig.9).Their mean value is very small,~2%.Standard deviations from four models(GFDL-CM3,GFDL-ESM2M,HadGEM2-CC,and MRI-CGCM3)decrease by more than 10%when compared with the current climate.However,standard deviations from seven models(bcc-csm1-1,FGOALS-g2,GFDL-ESM2G,GISS-E2-R,HadGEM2-ES,MIROC-ESMCHEM,and MIROC5)increase by more than 10%.This suggests that interannual variability of the EASM circulation is likely to be larger in the 1.5 GW period than in the current climate.
For the regional averaged summer precipitation over the East Asian continent and Northeast China,the mean values of their standard deviations increase by 12.2%and 14.5%,respectively,during the 1.5 GW period relative to the current climate(Fig.10).Consistent responses are found in most of the models suggesting that the interannual variability of the terrestrial summer precipitation over East Asia is also enhanced during the 1.5 GW period.
4.Conclusions and discussion
In thisstudy,to investigate responsesof East Asian summer climate under 1.5 GW target,the multi model results from CMIP5 were analyzed.Results showed that both surface air temperature and precipitation signifi cantly increase over most regionsof East Asia during the1.5 GWperiod(averageperiod 2021-2051 based on the 15 CMIP5 coupled models).Compared with the current climate,regional averaged summer precipitation is projected to increase by about 7.2%over Northeast China,which is higher than the increase predicted for the entire East Asian continent(4.2%).Due to higher precipitation north of 40°N,the leading EOF mode for the East Asian summer precipitation changes from a tripolar-like mode to a dipole mode,suggesting higher frequencies of north-south precipitation anomaly distribution in the near future.
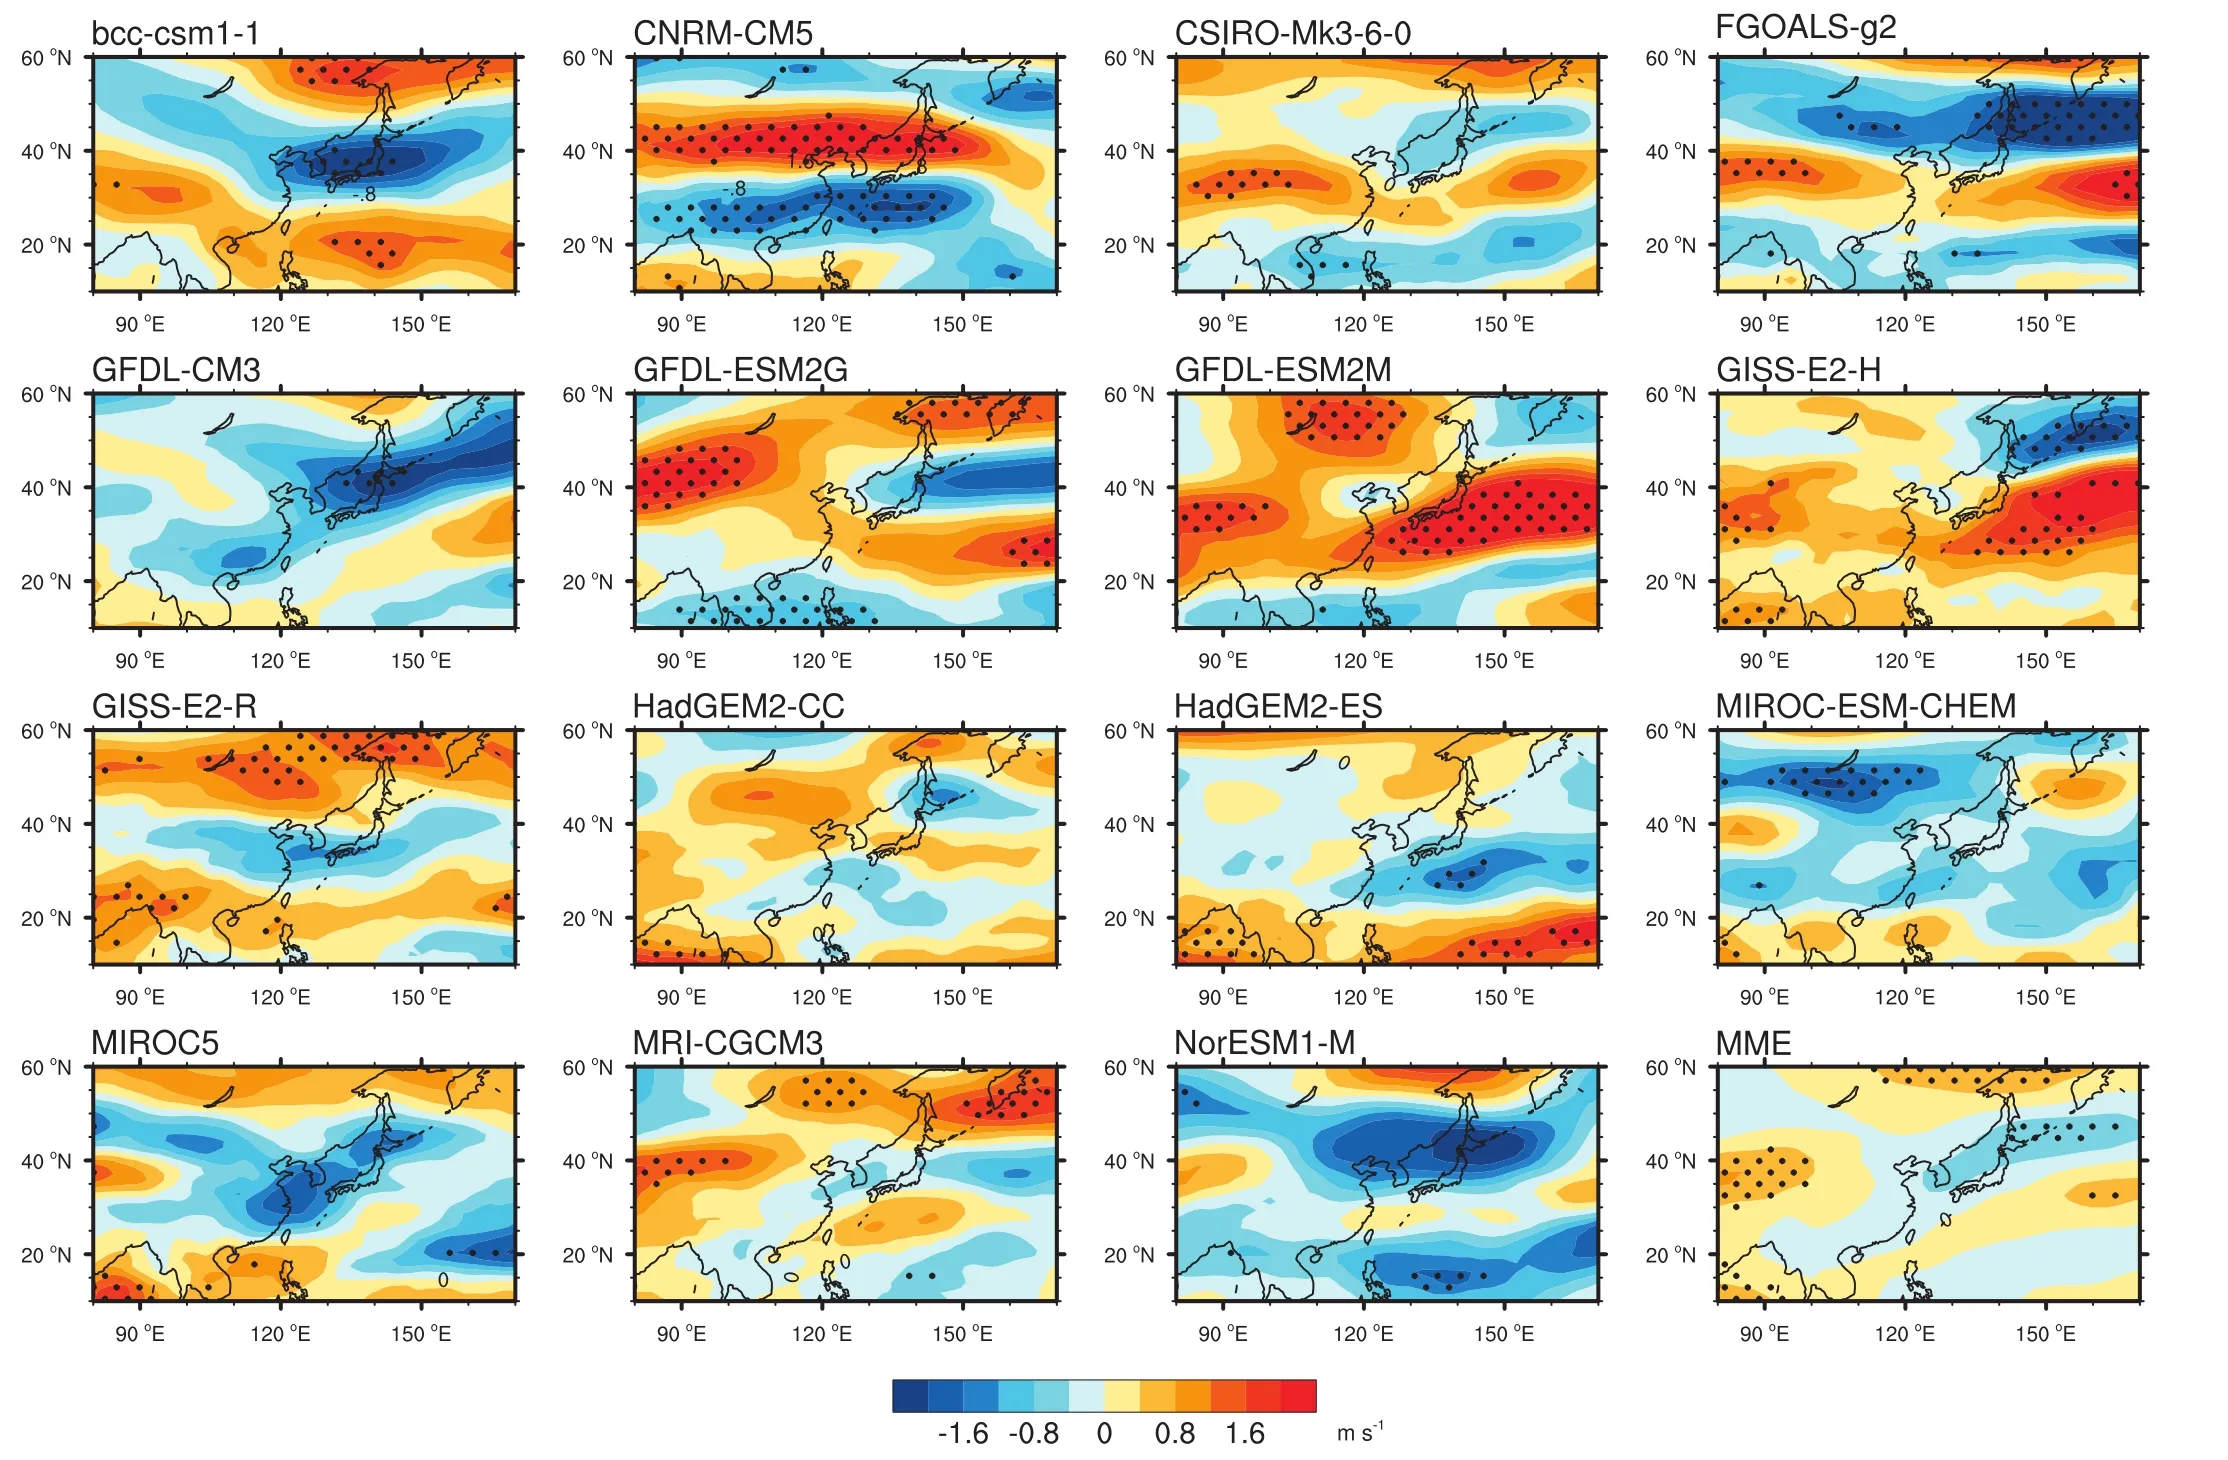
Fig.8.Simulated differences(1.5 GW-Current)in summer zonal wind at 200 hPa.Areas with confidence level exceeding 95%are denoted with dots.
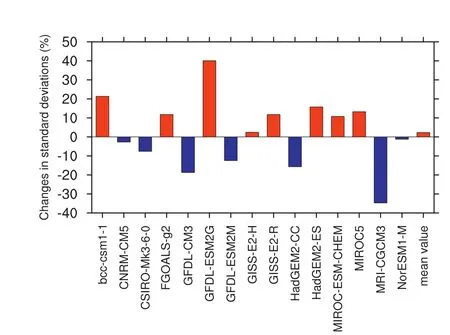
Fig.9.Simulated changes((1.5 GW-current)/current×100%)in standard deviations of the EASM index.
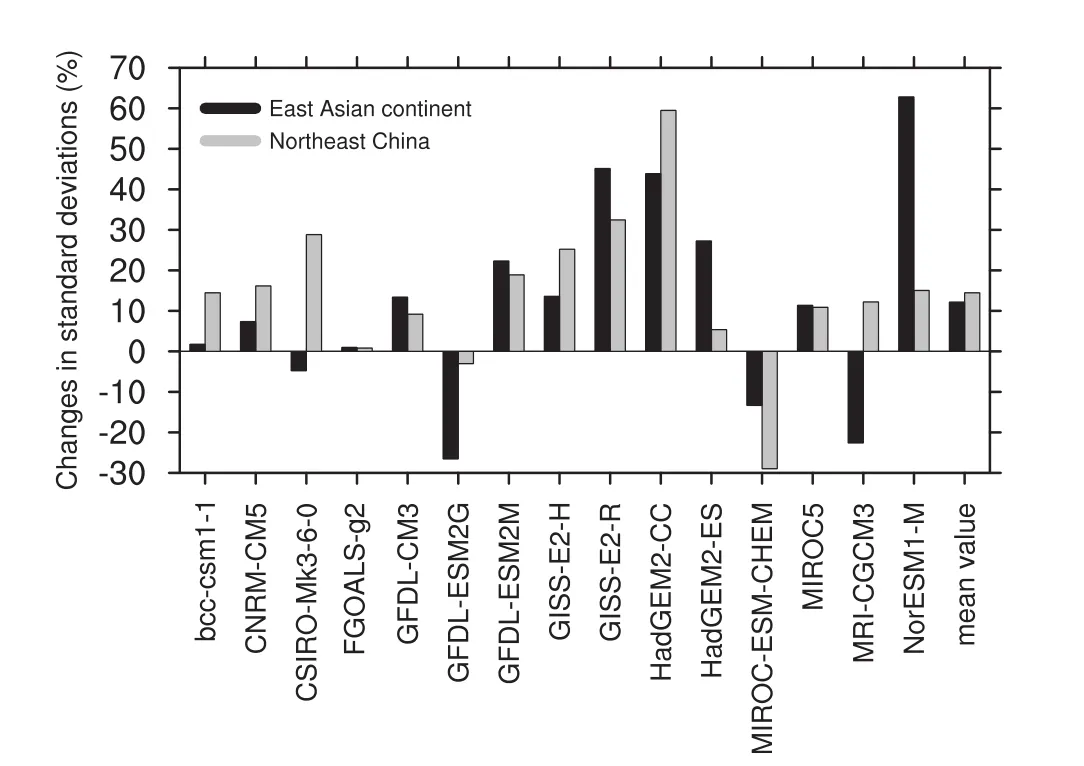
Fig.10.Simulated changes((1.5 GW-current)/current×100%)in standard deviations of regional averaged summer precipitation for the East Asian continent(20-50°N,80-140°E)and northeastern China (40-55°N,120-140°E).
During the 1.5 GW period,increased summer precipitation and possible precipitation mode shift are closely linked to changes of EASM circulation.Due to stronger warming over the East Asian continent compared with the surrounding ocean,the land-sea thermal contrast isenhanced.As a result,southerly wind anomalies are evident over East Asia in the results of MME and most other models.The monsoon circulation in the lower troposphere is significantly strengthened.This mainly contributesto the increased summer precipitation over East Asia,particularly for regions north of 40°N.However,the EAJ does not show a signifi cant response to the 1.5 GW rise.In addition,larger interannual variabilities of EASM circulation and associated precipitation are also suggested to occur during the 1.5 GW period.
During the1.5 GWperiod,theregional averaged surfaceair temperature over the East Asia increasesby about 2°C.Thisis lower than that over North Asia(~2.7°C),further confirming stronger temperature rises at higher latitudes than at lower latitudes(Xuetal.,2017).Changeinsummer precipitationover the East Asia is also smaller than that over the North Asia(~9%).From the 1.5 GW period to the 2°C global warming period,summer precipitation changes little over the East Asia,whereas the surface air temperature increase by more than 0.5°C(Xu et al.,2017).It suggests a faster warming over the East Asian continent than the global averaged.
In the CMIP5,there are four different RCP emissions scenarios(RCP2.6,RCP4.5,RCP6.0,and RCP8.5).For the different RCPemissions scenarios,the timing periods to reach 1.5 GW are very different.The stronger the RCP emissions scenario,the earlier we will reach the period of 1.5 GW.However,based on some preliminary analysis,spatial distributions of differences in mean climate(e.g.,temperature and precipitation)between along-term 1.5 GWperiod(e.g.,longer than 31-year climatology)and pre-industrial are almost the same in different RCPemissionsscenarios,particularly for the MME.In this study,therefore,only the simulations under the mid-low-range RCP scenario(i.e.,RCP 4.5)are employed.However,a suffi cient analysis of the output from all the RCP emissions scenarios is necessary and will be complete in the future.
Acknowledgments
Thisresearch wassupported by the National Key R&D Programof China(2017YFA0603802),theNational Natural Science Foundation of China(41661144005 and 41320104007),and the CAS-PKU Joint Research Program.We would like to thanks the IPCC for providing the CMIP5 datasets(http://www.ipccdata.org/sim/gcm_monthly/AR5/Reference-Archive.html).
 Advances in Climate Change Research2018年2期
- Advances in Climate Change Research的其它文章
- Response of North Pacifi c and North Atlantic decadal variability to weak global warming
- Changes in surface air temperature over China under the 1.5 and 2.0°C global warming targets
- Changes in temperature extremes over China under 1.5 °C and 2 °C global warming targets
- Analysis on the synergistic effect of sustainable development of coal industry under 1.5°C scenario
- China's nuclear power under the global 1.5°Ctarget:Preliminary feasibility study and prospects
- Development path of Chinese low-carbon cities based on index evaluation
