
Response of North Pacifi c and North Atlantic decadal variability to weak global warming
2018-07-26 09:46:50WUShengLIUZhengYubCHENGJunLIChun
WU Sheng*,LIU Zheng-Yub,CHENG Jun,LI Chun
a Laboratory for Climate and Ocean-Atmosphere Studies(LaCOAS)and Department of Atmospheric and Oceanic Sciences,School of Physics,Peking University,Beijing 100871,China
b Atmospheric Science Program,Department of Geography,Ohio State University,Columbus 43210,USA
c Key Laboratory of Meteorological Disaster,Ministry of Education(KLME)/Joint International Research Laboratory of Climate and Environment Chenge(ILCEC),Climate Dynamics Research Center,Nanjing University of Information Science and Technology,Nanjing 210044,China
d Physical Oceanography Lab,Ocean University of China,Qingdao 266100,China
Abstract The Pacifi c Decadal Oscillation(PDO)and the Atlantic Multidecadal Variability(AMV)are the two dominant low-frequency modes in the climatesystem.Thisresearch focused on theresponseof thesetwo modesunder weak global warming.Observational datawerederived from the Hadley Center Sea Ice and Sea Surface Temperature dataset(HadISST)and coupled model outputs from the Coupled Model Intercomparison Project Phase 5(CMIP5).Changes in PDO and AMV were examined using four models(bcc-csm1-1,CCSM4,IPSL-CM5A-LR,and MPIESM-LR)with long weak global warming scenarios(RCP2.6).These models captured the two low-frequency modes in both pre-industrial run and RCP2.6 run.Under weak global warming,the time scales of PDO and AMV signifi cantly decreased while the amplitude only slightly decreased.Interestingly,the standard deviation of the North Pacifi c sea surface temperature anomaly(SSTA)decreased only in decadal time scale,and that of the North Atlantic SSTA decreased both in interannual and decadal time scales.The coupled system consists of a slow ocean component,which has a decadal time scale,and a fast atmospheric component,which is calculated by subtracting the decadal from the total.Results suggest that under global warming,PDO change is dominated by ocean dynamics,and AMV change is dominated by ocean dynamics and stochastic atmosphere forcing.
Keywords:Pacific decadal oscillation;Atlantic multidecadal variability;RCP2.6
1.Introduction
Decadal climate variability,such as Pacific decadal oscillation(PDO,Mantua et al.,1997)and Atlantic multidecadal variability(AMV,Delworth et al.,1993),has received increasing attention in climate research because of its importance for near-term climate forecast(Hawkins and Sutton,2009;IPCC,2013)and its role in modulating anthropogenic global warming(Kosaka and Xie,2013;England et al.,2014).Signifi cant progresses have been achieved to understand decadal climate variability(Liu,2012),yet several questions remain.Oneimportantquestionishow thesedecadal variability modeschangein responseto global warming.Recent studiesof future climate projections suggest that,in response to strong global warming,decadal variability exhibits signifi cant changes.In particular,thetime scaleand amplitude of decadal variability in the North Pacifi c SST(PDO)and Atlantic meridional overturning circulation(AMOC)(Fang et al.,2014;Cheng et al.,2016;Zhang and Delworth,2006;Wang and Li,2017)can be reduced substantially.Previous analyses are preliminary because of the limited data in the analysis;therefore,the robustness of the response of decadal variability to global warming remainsto befurther studied,particularly in thecase of weak global warming comparable with 1.5°C global warming.Theconnection between the Pacific and Atlantic has been investigated.The western tropical Pacifi c sea surface temperature is similar to Atlantic multidecadal variability(Sun etal.,2017).Hereweanalyzetheresponseof PDOand AMV to the weak global warming scenario(RCP2.6)in several global climate models of long simulations.
This paper is outlined as follows.Section 2 describes the data and method used in the study.Sections 3 and 4 discuss PDO and AMV responses.Section 5 presents the conclusion and discussion.
2.Data and method
2.1.Data
As benchmarks in the observation,PDO and AMV will derived from the sea surface temperature anomaly(SSTA)of the Hadley Centre Sea Ice and Sea Surface Temperature dataset(HadISST),which contains monthly mean values in 1870-2012 and has a horizontal spatial resolution of 1°×1°(Fig.1c and d).PDO and AMV patterns are derived as the regression of PDO and AMV indices on the global SST(Fig.1a and b).Four coupled climate models will be used,all of which are derived from the multimodel dataset of the world climate research program's CMIP5(http://www.ipcc-data.org/sim/gcm_monthly/AR5/Reference-Archive.html)(Table 1).These models are selected because they have the model output of long global warming projection simulations.For each run,we use pre-industrial(PI)run as the control and examine changes in PDO and the AMV in the control and future projection simulation under the weak global warming scenario of the Representative Concentration Pathway(RCP2.6).This scenario represents the future climate under weak global warming with low emission of greenhouse gases(i.e.,radiative forcing at 2100 reach about 2.6 W m-2)and mean global warming temperature of about 1.1-1.8°C(this condition is comparable with the 1.5°C warming case).The SST fi eld of the models is interpolated into the same grids(1°×1°)as observation for ease of comparison.The density fi eld of the models isinterpolated into thesamegrids(1°×1°)to calculate the speed of Rossby wave.
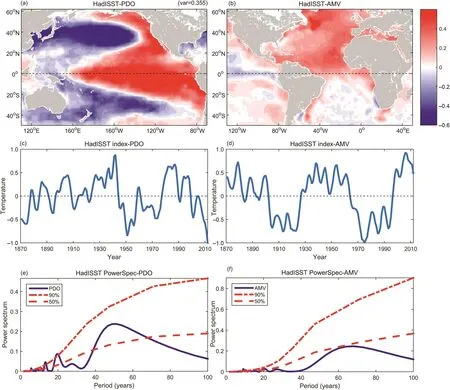
Fig.1.Observed spatial regression pattern,time series,and power spectra for PDO(a,c,e)and AMV(b,d,f)metrics(1870-2012).
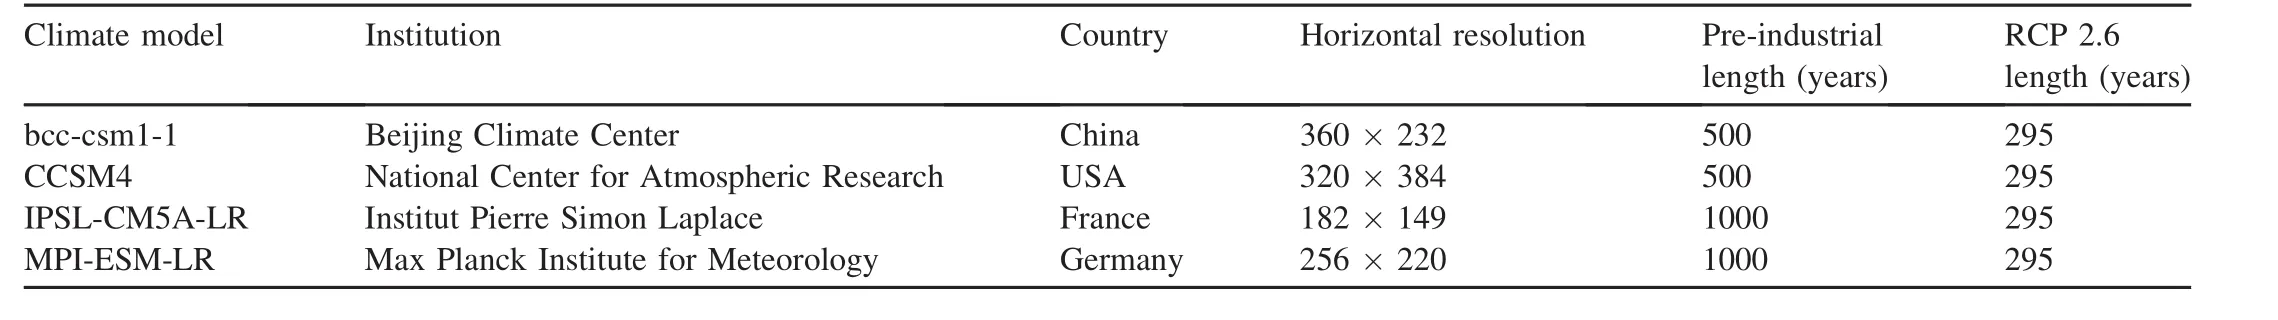
Table 1 CMIP5 models used in this study.
2.2.Statistical techniques
We first derivethemean annual data from the monthly SST data.We then high passthe interannual variability by applying a three-year running mean twice(Zhang et al.,1997).The low passed variability is then derived as the anomalous fi eld minus the annual climatological mean.
The PDOindex isderived asthe principlecomponent of the leading empirical orthogonal function(EOF)mode of thelowpassed SST variability over the North Pacific(110°E-100°W,20°N-70°N),and EOFisnormalized by itsstandard deviation(Mantua et al.,1997).The AMV index is derived as the average area of the low-passed SST anomaly over the North Atlantic(80°W-0°,0°-70°N)(Enfield et al.,2001).These two indices are then normalized(Fig.1c and d),and the patterns of PDO and AMV are obtained as the regression of the annual mean SSTA on the PDO and AMV indices,respectively(Fig.1a and b).A spectral analysis is applied to the PDOor AMV index(Fig.1eand f),and the major period is identifi ed as the frequency of the peak power.
For the simulations of each model,we analyze two 200-year periods(years 1-200,and 201-400)from the PI control run and one 200-year period(2101-2300)of the RCP2.6 run.Multimodel ensemble statistics are obtained for various purposes.For the power spectra,we obtain the index from each CMIP5 model and calculate the power spectra for each index.We average the individual normalized power spectra and produce ensemble mean power spectra.Our 200-year time series is the same as that for the decadal variability of AMOC in the study of Cheng et al.(2016)and is twice the length in the PDO analysis of Wang and Li(2017).
3.Observation
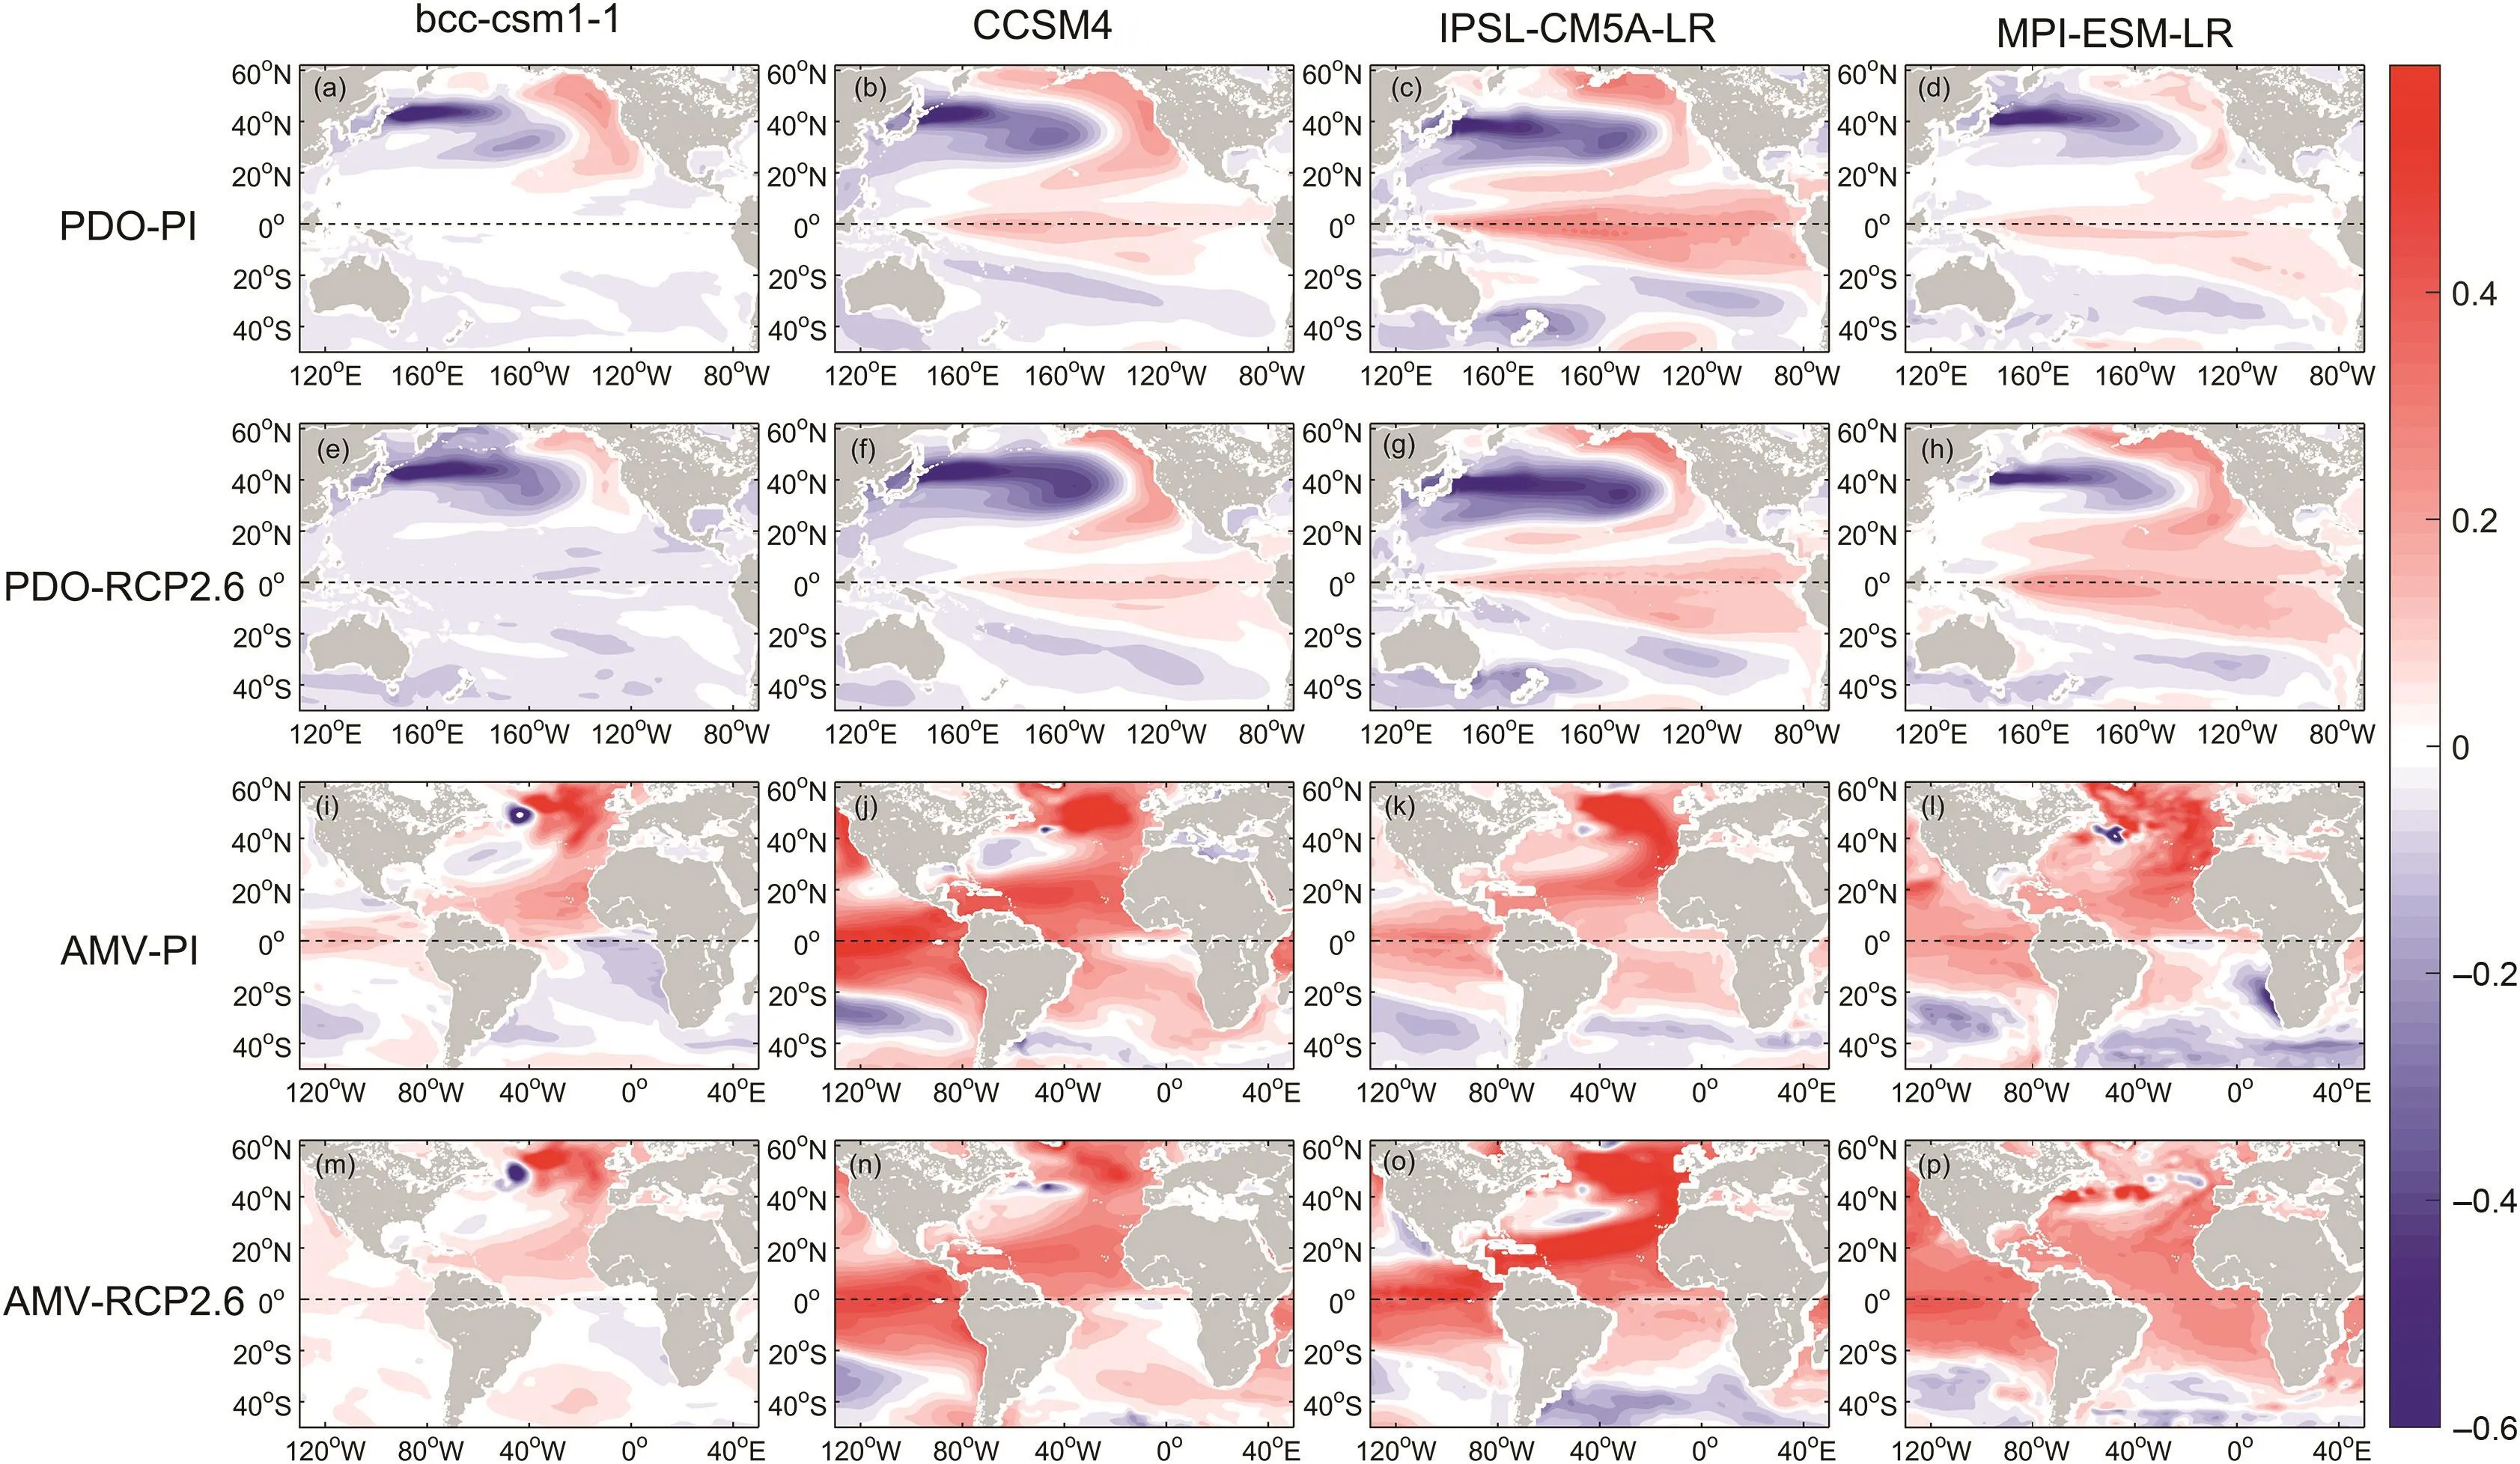
Fig.2.Spatial patterns of PDO and AMV of the four CMIP5 models in PI and in RCP2.6.
We fi rst show PDO and AMV in the observation as benchmarks.PDO is defi ned as the fi rst leading EOF mode of the North Pacifi c SSTA(Fig.1a).The spatial pattern of PDO(regressing SSTA on the fi rst PC time series)resembles an ENSO-like pattern(Zhang et al.,1997;Mantua et al.,1997).The positive phase of PDO has negative SSTA in the central North Pacific and surrounded by positive anomalies along the west coast of North America and toward the tropics.The maximum regression amplitude is in the central North Pacifi c,and the regression amplitude of tropics is around 0.75 of the maximum(Fig.1a).The PDO index and power spectra are shown in Fig.1c and e.The two peaks in the PDO power spectra correspond to bidecadal and multidecadal,respectively,and the major periods are the 20-year and 50-year periods.
AMV is defi ned as the average of the North Atlantic SSTA.The spatial pattern of AMV is characterized by a horseshoe pattern(Fig.1b)(Deser and Blackmon,1993;Kushnir,1994).The AMV index and power spectraare shown in Fig.1d and f.The AMV phase changes on multidecadal timescales,and the peak of the power spectra is around 70 years.
4.Response to weak global warming
Few studies have investigated the response of PDO to future global warming by using climate models.However,the data length has been limited to~100 years,which is too short to assess the response of decadal variability with high statistical signifi cance,especially for multi-decadal variability(Fang et al.,2014;Wang and Li,2017).Here,we choose four CMIP5 coupled climate models,which have available model outputs of long global warming simulations(Table 1).We choose RCP2.6 simulations to represent the scenario of weak global warming.Our analysis uses at least 200 years of data,although this time period is still insuffi ciently long to achieve high statistical signifi cance,to represent a significant increase in data length for decadal variability study in comparison with previous works.
The model simulations reproduce the observed spatial patterns of PDO and AMV reasonably well in both PI and global warming cases(Fig.2).The model PDO,however,shows too weak amplitude in the tropics,refl ecting the underestimation of extratropical-tropical interaction in the model(Newman,2007).Several differences are noted among the four models.The tropical regression coeffi cient is near to zero in the bcc-csm1-1 model,and the three other models can reproduce the tripole structure.Another defi ciency is the location of the maximum of PDO,which lies in the central North Pacific in the observation but in the Kuroshio Oyashio Extension(KOE)region in the models.
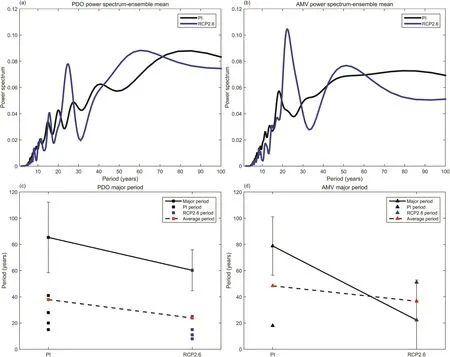
Fig.3.Ensemble mean power spectrum and the major period(max in power spectrum)of PDOand AMV from the simulationsof the PIand RCP2.6 in the four CMIP5 models.Theblack and blue solid dotsin(c)PDO and(d)AMVare the periodscorresponding to the peaksof thepower spectrum.Error bar are calculated by single run.
The change in the dominant time scale of decadal variability is determined by comparing the power spectra between the PIand RCP2.6 simulations.First,we study the response of PDO.For each model,the power spectra of the PDO index are calculated for two 200-year sections for the PIcontrol run and for a single 200-year section for the RCP2.6 run.The ensemble mean for the PI and RCP2.6 are shown in Fig.3a.The visual comparison of the spectra between PI and RCP2.6 runs shows a tendency of peak power shift from low frequency to high frequency.This change in frequency is evident in the change in themajor period,which isdefi ned hereastheperiod for the peak power spectra.In the major period,the ensemble mean power spectra decrease from ~85 years in PI to ~60 years in RCP2.6(Fig.3c).To assess the robustness of this frequency shift,we calculatethespread of the major periodsof all single 200-year sections in PI and RCP2.6(marked as a vertical bar for PI and RCP2.6,respectively;Fig.3c).The spread of the major periods of PDO show some overlaps between PIand RCP2.6.Nevertheless,a clear evidence of period reduction is obtained.The major period of 60 years in the ensemble is at the lower margin of the ensemble spread of the PIruns,and themajor period of 85 yearsof theensemble PIis above the upper margin of spread of RCP2.6(Fig.3c).The shortening of the PDO also occurs in the next four major frequencies,which represent the frequencies of the second,third,fourth,and fi fth largest spectral peaks.The reduction of the period from the PI to RCP2.6 run is true for all the corresponding periods on the next four frequencies.We calculate the average period by using all the spectral peaks.The average period also decreases under weak global warming.
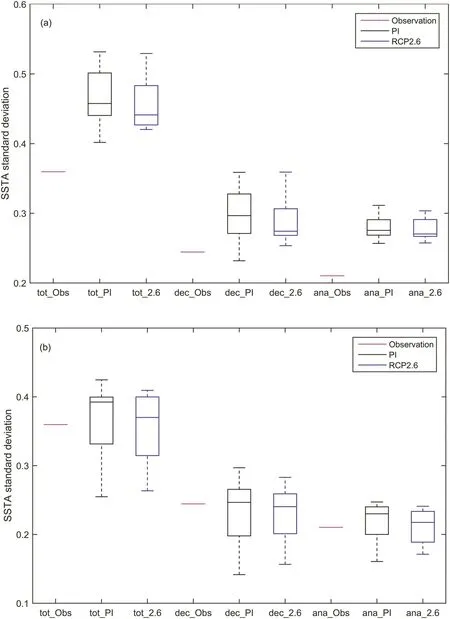
Fig.4.Distribution of the average of the North Pacific(a)and North Atlantic(b)SSTA standard deviation fieldsin observation,PI,and RCP2.6.The “tot”means total standard deviation,“dec”means decadal standard deviation,and “ana”means interannual standard deviation.Boxplot boundariesare set at the25th and 75th percentiles(p25 and p75,respectively).
The shortening of the AMV is a function of time scale and is more signifi cant than that of the PDO.The overall shortening can be seen by comparing the ensemble mean spectra between the PIand RCP2.6 groups(Fig.3b).Themajor period of the ensemble mean spectra is reduced from~80 years to~25 years(Fig.3d)and isbeyond the ensemblespread.Similar reduction is also seen in the next few frequencies.The reduction of period of AMV ison the SSTand surface climate.This shortening of the AMV period is consistent with the shortening of the major period of the decadal variability of the AMV that has been discussed by Cheng et al.(2016).And the average period is same as the major period.Therefore,our study suggeststhat the shortening of decadal AMOCmay have its signature on the SST and in the surface climate fi eld.
Therefore,both the PDO and AMV become shorter in response to weak global warming,and the decrease is more signifi cantfor thelatter.Thisconclusionremainsvalid if weuse Empirical Mode Decomposition(EMD)method,which can remove the trend caused by CO2changes in the RCP2.6 runs.
Finally,we study the response of the intensity of the PDO and AMV to global warming in terms of the SSTA standard deviation of the North Pacifi c and the North Atlantic.To test the significance of the results,we cut the long pre-industrial runs(1-500 years)to 100 years(i.e.,1-100,101-200,201-300,301-400,and 401-500).The RCP2.6 runs of 2101-2200,2151-2251,and 2201-2300 are then selected to study the change in the SST standard deviation of the North Pacifi c and the North Atlantic.We calculate the total SSTA and low-passed SSTA standard deviation as total standard deviation and decadal standard deviation,and the residual is the interannual standard deviation.The mean field is calculated for boxplot.Fig.4 shows the standard deviations of the PDO(a)and AMV(b)for total variability(left),decadal variability (middle),and their difference (right),which represent the intensities of total,decadal,and interannual variabilities,respectively.In the North Pacific,the total variability and decadal variability are both reduced,as evident by the reduction of the standard deviation of the total variability(left column)from PI to RCP2.6.The total variability is also compared with the observation,and the model shows a stronger variability in the North Pacific but a comparable magnitudeof total variability with theobservation in the North Atlantic.For the Pacific(Fig.4a),thevariability isreduced for the total variability and decadal variability but not interannual variability.By contrast,in the Atlantic(Fig.4b),the variance is reduced in the total,decadal,and interannual variabilities.
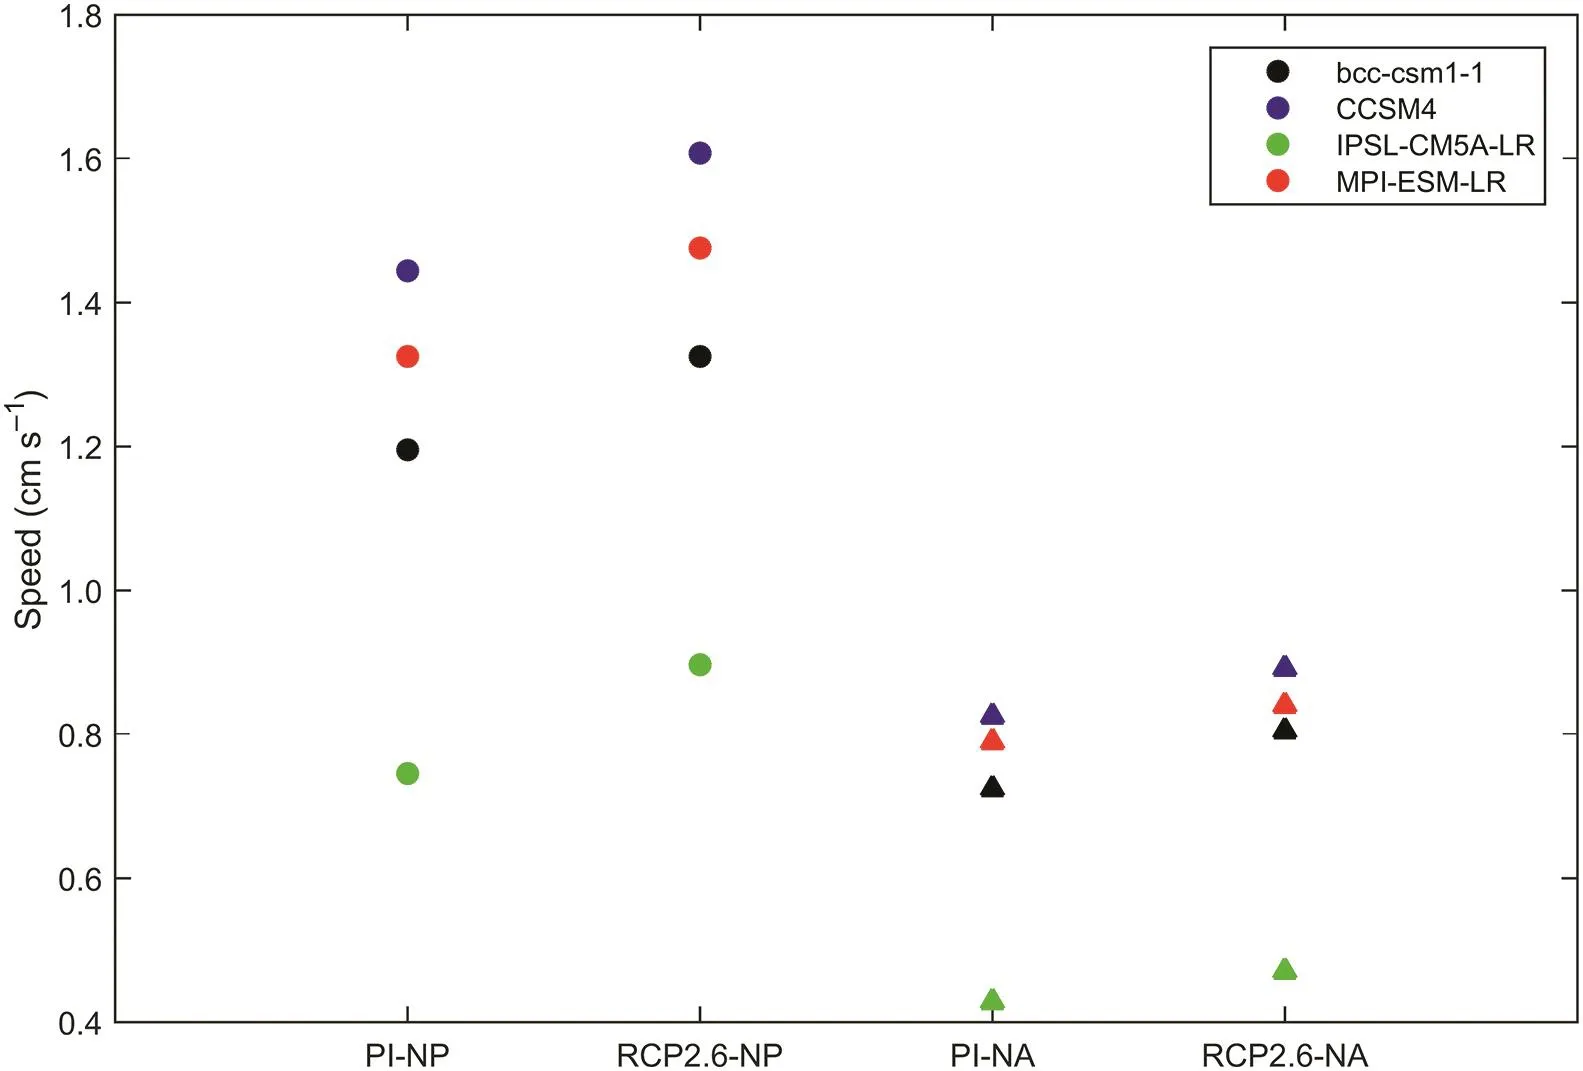
Fig.5.Rossby wave speed of the North Pacifi c(NP)and the North Atlantic(NA)in PIand RCP2.6 in the four CMIP5 models.Circles and triangles show the change of Rossby wave speed in the North Pacific under and North Atlantic,respectively,under weak global warming.
Overall,the shortening and weakening of the PDO are consistent with those reported in previous studies(Fang et al.,2014).Our analysis shows that the weakening seems to be detectable even under weak warming scenario.However,the interannual variability remains largely unchanged in the Pacifi c.This fi nding suggests that the reduction of PDO is unlikely caused by the reduction of atmospheric random variability,which exhibits a white spectra and therefore does not seem to be reduced at the interannual time scale.The speed up of Rossby waves caused by the enhanced stratifi cation may be responsible for the acceleration of the PDO and could also be related to its weakening.The speed of Rossby wave increases under weak global warming both in the North Pacifi c and the North Atlantic in the four CMIP5 models(Fig.5).In the Atlantic,both the decadal variance and interannual variance are reduced,suggesting that the weakening of the AMV may be contributed by the reduction of atmospheric random forcing,whose weakening leads the weakening at all timescales.Several workssupport thisresult,which pointsout that the atmosphere signal leads the observed AMV by about 15 years(Li et al.,2013;Sun et al.,2015).However,this variability seems to be different from that of AMOC(Cheng et al.,2016).As such,further studies are needed to understand the relation between AMV change and surface climate variability.
5.Conclusions and discussion
In this preliminary study,we discuss the response of two dominant low-frequency modes in the ocean under weak global warming by using four CMIP5 models.The major conclusion isthat even under theweak global warming caseof RCP2.6,both PDO and AMV show signifi cant responses,that is,shortening of time scale and weakening in amplitude.This fi nding suggests that both modes might be very sensitive to global warming.The shortening of time scale is especially clear for the AMV.Further analysisof thevariancein different frequency bands shows that the Pacifi c variability is reduced only in the decadal variability,not in interannual variability,whereas the Atlantic SST variability is reduced in both decadal and interannual bands.Hence,the PDO and AMV show different response mechanisms.Further studies are needed to understand the mechanism of climate response.A comprehensive study of the response and mechanism of PDO and AMV for all global warming scenarios must also be conducted.
Acknowledgments
This work is supported by the Chinese MOST(2017YFA0603801)and NSFC(41630527).
 Advances in Climate Change Research2018年2期
- Advances in Climate Change Research的其它文章
- 1.5°C target:Not a hopeless imagination
- Impact of and adaptation strategiesfor sea-level rise on Yangtze River Delta
- Development path of Chinese low-carbon cities based on index evaluation
- China's nuclear power under the global 1.5°Ctarget:Preliminary feasibility study and prospects
- Analysis on the synergistic effect of sustainable development of coal industry under 1.5°C scenario
- Changes in temperature extremes over China under 1.5 °C and 2 °C global warming targets