Changes in surface air temperature over China under the 1.5 and 2.0°C global warming targets
FU Yun-Hi*,LU Ri-Yu,GUO Dong
a Climate Change Research Center,Chinese Academy of Sciences,Beijing 100029,China
b National Key Laboratory of Numerical Modeling for Atmospheric Sciencesand Geophysical Fluid Dynamics,Instituteof Atmospheric Physics,Chinese Academy of Sciences,Beijing 100029,China
Abstract
Keywords:Temperature;Warming;1.5 °C target;2.0 °C target;China
1.Introduction
The 21st Conference of the Parties in Paris in December 2015 agreed to take steps towards limiting the global mean annual surface air temperature increase to well below 2°C above pre-industrial levels,and to pursue efforts towards a target of 1.5°C.As of August 2017,195 members of the United Nations Framework Convention on Climate Change signed the Paris Agreement,and 160 of these membersratifi ed it.Decision makers need reliable information on the impacts caused by these warming levels for climate mitigation and adaptation measures.The Intergovernmental Panel on Climate Change has accepted the invitation to generate a special report on the impacts of global warming of 1.5°C by 2018.As part of an ambitious and urgent plan,a wide-ranging analysis on the effects of limiting global warming to 1.5°C is required.
Various studies have been conducted regarding the 2.0°C target(Joshi et al.,2011;Jiang and Fu,2012;Zhang,2012;Zhang et al.,2013;Vautard et al.,2014;Sui et al.,2015;Jiang et al.,2016).For instance,by analyzing the results simulated by Coupled Model Intercomparison Project Phase 3(CMIP3)models,Jiang and Fu(2012)pointed out that the 2.0°Cglobal warming isprojected to occur in 2064,2046 and 2049 under the SRES B1,A1B and A2 in multi-model ensemble(MME),respectively,but would occur in a 30-40-year period in the individual models.For the Representative Concentration Pathways(RCPs),the globally averaged temperature would cross the 2.0°C threshold sometime between 2030 and 2060 under RCP4.5 and RCP8.5(Zhang,2012;Vautard et al.,2014;Sui et al.,2015;Jiang et al.,2016).
Regional climates are the result of complex processes that vary strongly with location and therefore respond differently to changes in global-scale infl uences.The CMIP3 MME suggested that the annual mean surface air temperature(SAT)averaged over China would be elevated by 2.7-2.9°C when the 2.0°C target occurred,but the scope of warming is quite large(approximately 2.3-3.0°C)among the individual models(Jiang and Fu,2012).These authors also showed that the warming is stronger towards the north and on the Qinghai-Tibetan Plateau.Based on the simulations of the Coupled Model Intercomparison Project Phase 5(CMIP5)models,the MME showed that the annual mean SAT averaged over China would increase by 2.6°C under a 2.0°C global warming(Sui et al.,2015),and Northwest China shows the fastest warming trend and followed by Central North China and Northeast China(Zhang,2012).
Unlike the 2.0°C target,the 1.5°C target is relatively unexplored,and there isa relative lack of scientifi c knowledge about the implications of 1.5°C warming(Hulme,2016;Mitchell et al.,2016;Schleussner et al.,2016;Zhai et al.,2017;Zhang et al.,2017).The CMIP5 MMEs showed that the global mean 1.5°C warmings related to the pre-industrial level(1861-1900)would occur by approximately 2036,2028,2033 and 2025 under RCP2.6,RCP4.5,RCP6.0 and RCP8.5,respectively(Hu et al.,2017).At the moment,the mean temperature over Asiawould increaseby 2.3°C,with stronger warming in high latitudes than in low latitudes,and it would be 0.5-1.0°C lower than that under the 2.0°C target(Xu et al.,2017).A warming of 0.5°C(from 1.5°C to 2°C)would lead to signifi cant increases in the temperature and precipitation extremes in most regions(Wang et al.,2017).
However,these studies have focused solely on global-scale rather than China.The possible changes over China related to thepre-industrial level that areassociated with the1.5°Ctarget have not yet been investigated in detail.Zhou et al.(2016a)showed widespread significant changes in temperature extremes are consistent with warming in observations.In addition,the surface warming over global dry lands is 20%-40%higher than over humid lands in the past century(Huang et al.,2017).According to the differential warming over land and ocean and dry-and wet-land,it isbelieved that theimpactsof a 0.5°C warming mitigation over China deserve to be quantitatively assessed,which would provide a better insight into the benefi ts of limiting from 2.0 to 1.5°C to the regional stakeholders(e.g.,hydrologists,ecologists,resource planners).Thus,we will investigate the possible changes in the SAT over China under the 1.5 and 2.0°C targets to provide a regional perspective under the global warming targets.
The organization of this paper is as follows.In Section 2,the datasets and methods used in this study are described.The changes in the SAT averaged over China under the 1.5 and 2.0°C targets are shown in Section 3.Section 4 shows the spatial characteristics of the changes.Section 5 provides conclusions and discussion.
2.Data and methods
We analyzed the results of 22 models in the World Climate Research Programme's CMIP5 multi-model archive for their historical climate simulation(HIST)and futureclimate change under RCP2.6,RCP4.5,RCP6.0 and RCP8.5.Table 1 lists the detailed features of the models,and additional details are documented at http://cmip-pcmdi.llnl.gov/cmip5/index.html?submenuheader=0.
For the models, 145-year historical simulations(1861-2005)are used,and only one realization is chosen for each model.The simulations for 2006-2100 under RCP2.6,RCP4.5,RCP6.0 and RCP8.5 in all modelsare used for future global warming projections.The warming threshold in this study is relative to the pre-industrial climate,and the years 1861-1900 are used as the quasi-pre-industrial baseline to calculate the years in which global warming would reach the 1.5 and 2.0°C targets under the various RCP pathways.All simulation data have been interpolated onto a common 2.5°× 2.5°grid to enable the MME analysis and the comparison between the individual simulations.The MME is obtained by simply averaging the available models with equivalent weights.
3.Changesin SATaveraged over China under the 1.5 and 2.0°C targets
Fig.1a shows the projected changes in the global mean annual SAT relative to the pre-industrial reference period(1861-1900)in the MMEs.Generally,the 1.5°C warming targets would occur in 2029 under RCP2.6,2027 under RCP4.5,2031 under RCP6.0 and 2025 under RCP8.5.The times are almost the same as those in Hu et al.(2017)and Shi et al.(2018),except the target is hit approximately 7 years earlier than that in Hu et al.(2017)under RCP2.6.In addition,the globally averaged temperature would not exceed 2.0°C above the pre-industrial level under RCP2.6.The global warming would pass the 2.0°C threshold in 2048,2054 and 2039 under RCP4.5,RCP6.0 and RCP8.5,respectively.
Unfortunately,there is a large diversity among the times when the 1.5 and 2.0°C thresholds are crossed in the individual models(Fig.2),which is consist with Shi et al.(2018).Under the low emission scenario(RCP2.6),the 1.5°Ctarget is projected to occur in 16 models(approximately 73%)at times ranging from 1998 to 2051,showing a spread of 54 years(Fig.2a).Only eight models project the 2.0°C target thatwould occur in a 73-year period(2014-2086).Under RCP4.5,the 1.5°C target would occur in all models within a 52-year period ranging from 1998 to 2049(Fig.2b).At the same time,the 2.0°C target would occur within 72 years(2013-2084)in 18 models.The RCP6.0 is also a medium stabilization scenario that stabilizes the radiative forcing at 6.0 W m-2in 2100 without ever exceeding that value(van Vuuren et al.,2011).Under this pathway,the global warming would reach 1.5°C within a 63-year period from 1998 to 2060,and cross 2.0°C within a 70-year period from 2010 to 2079 in all models(Fig.2c).Under the highest emission scenario(RCP8.5),the models show a relatively narrower spread in the years when the 1.5 and 2.0°C thresholds are crossed than those under the other three pathways(Fig.2d).The global warming would exceed the 1.5°C target in the years ranging from 1998 to 2041,and cross the 2.0°C threshold in the years from 2012 to 2055 for all models,both within a 44-year period.
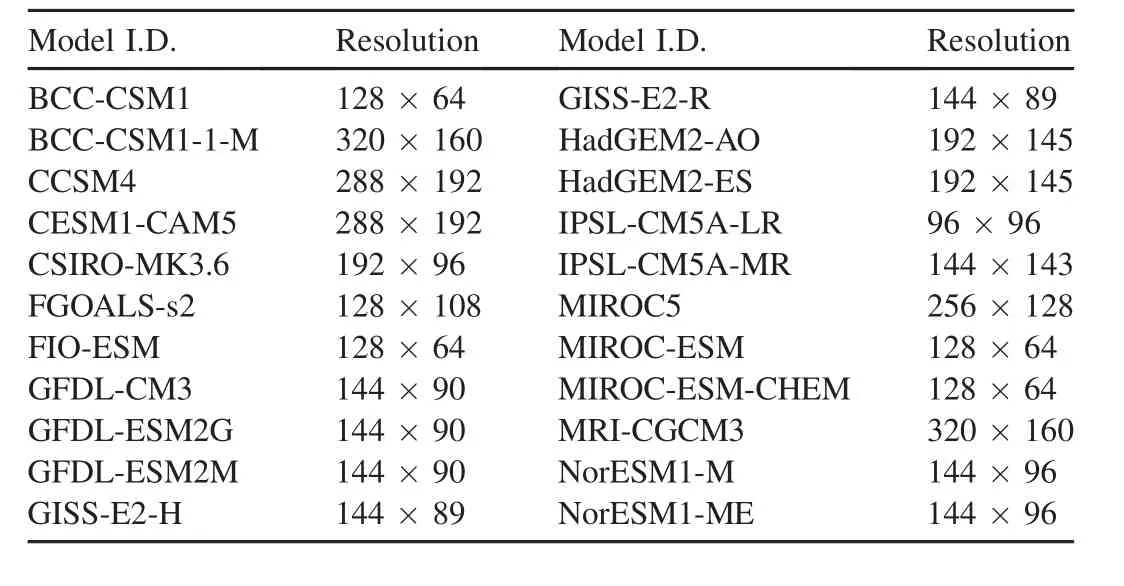
Table 1 Descriptions of the models used in this study.
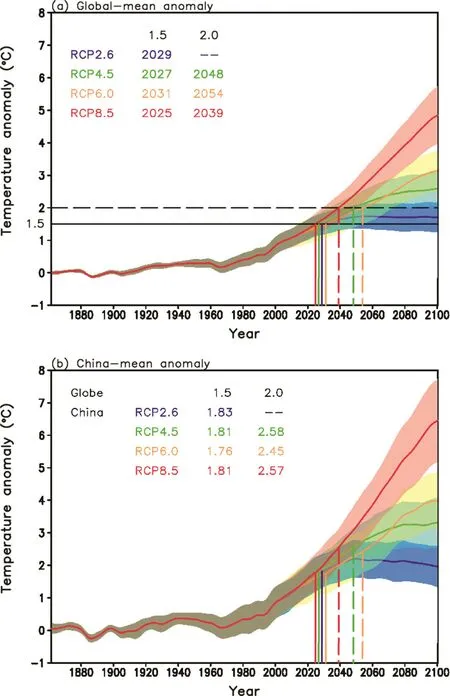
Fig.1.(a)The 31-year slipping changes in annual mean global SAT(relative to thepre-industrial baseline1861-1900)under RCP2.6,RCP4.5,RCP6.0 and RCP8.5 in MME.(b),same as in(a),but for the annual mean SAT averaged over China(Shading indicates the dispersion of one standard deviation from MME result).
Under the global 1.5°C target,the average warming over China would be approximately 1.8°C relative to the preindustrial level in the MMEs for all RCP pathways(Fig.1b).Under the 2.0°C target,the annual mean SAT over China would increase by approximately 2.6°C in the various pathways.These results suggest that the warming over China is faster than the global mean,which is consistent with previous studies(Jiang and Fu,2012;Hu et al.,2017;Shi et al.,2018).
For both the 1.5 and 2.0°C targets,the average warming over China are quite concentrated among the individual models under the various pathways,although certain diversity exists(Fig.2).Under RCP2.6,the average warmings over China are projected to be within the range of 1.5-2.0°C under the 1.5°C target in almost all models,no matter when the targets are reached(Fig.2a).For the 2.0°C target,the average SAT would increase by 2.6-2.9°C in six of the eight models that cross the 2.0°C threshold.Under the other three pathways,the SAT over China would increase by 1.5-2.2°C in almost all models under the 1.5°C target,except for two models under RCP4.5 and RCP6.0 and one model under RCP8.5 which do not project the global 1.5°C warming(Fig.2b-d).Under the 2.0°C target,the warmings would be within the range of 2.2-2.9°C in 17,18,and 20 of the models under RCP4.5,RCP6.0 and RCP8.5,respectively.
We calculated the probability density function(PDF)of the projected warming averaged over China under the 1.5 and 2.0°C targets to further quantitatively evaluate the warming rates among the individual models(Fig.3).Under the 1.5°C target,the largest PDF values are approximately 2.0,1.8,1.7 and 1.9°C under RCP2.6,RCP4.5,RCP6.0 and RCP8.5,respectively(Fig.3a).The diversity is very small among the values.Thisresult suggeststhat with aglobal 1.5°Cwarming,the SAT averaged over China has the largest probability to increase by 1.7-2.0°Crelative to the pre-industrial level.The shapes of the PDF curves are very similar.The mean values are approximately 1.8°C for all RCP pathways,and the standard deviations(StDs)are approximately 0.2,0.2,0.3,and 0.2°C under RCP2.6,RCP4.5,RCP6.0 and RCP8.5,respectively(Table 2).The concentrated mean values and StDs further certify the unanimous results among the various pathways.The StDs are only approximately 11%of the mean values,indicating a very weak dispersion among the models.
Under the 2.0°C target,the largest PDF values are approximately 2.7,2.5,2.4 and 2.6°Cunder RCP2.6,RCP4.5,RCP6.0 and RCP8.5,respectively(Fig.3b).The warming is most pronounced under RCP8.5,followed by RCP4.5 and RCP6.0,but with a difference of only approximately 0.1°C.The models that evolved in the PDF calculations are the models that are very sensitive to global warming,and thus result in strong warming under RCP2.6(Fig.2a).Therefore,the average warming over China is most likely increase by 2.4-2.7°Cwhen global warming crossesthe 2.0°Cthreshold.In addition,the mean values are 2.6,2.5,2.5 and 2.6°C,which are very consistent with each other under the various pathways,whilethe StDsare0.3,0.3,0.3 and 0.2°Cunder thefour pathways,all of which are only approximately 12%of the mean values,suggesting little diversity among the models(Table 2).
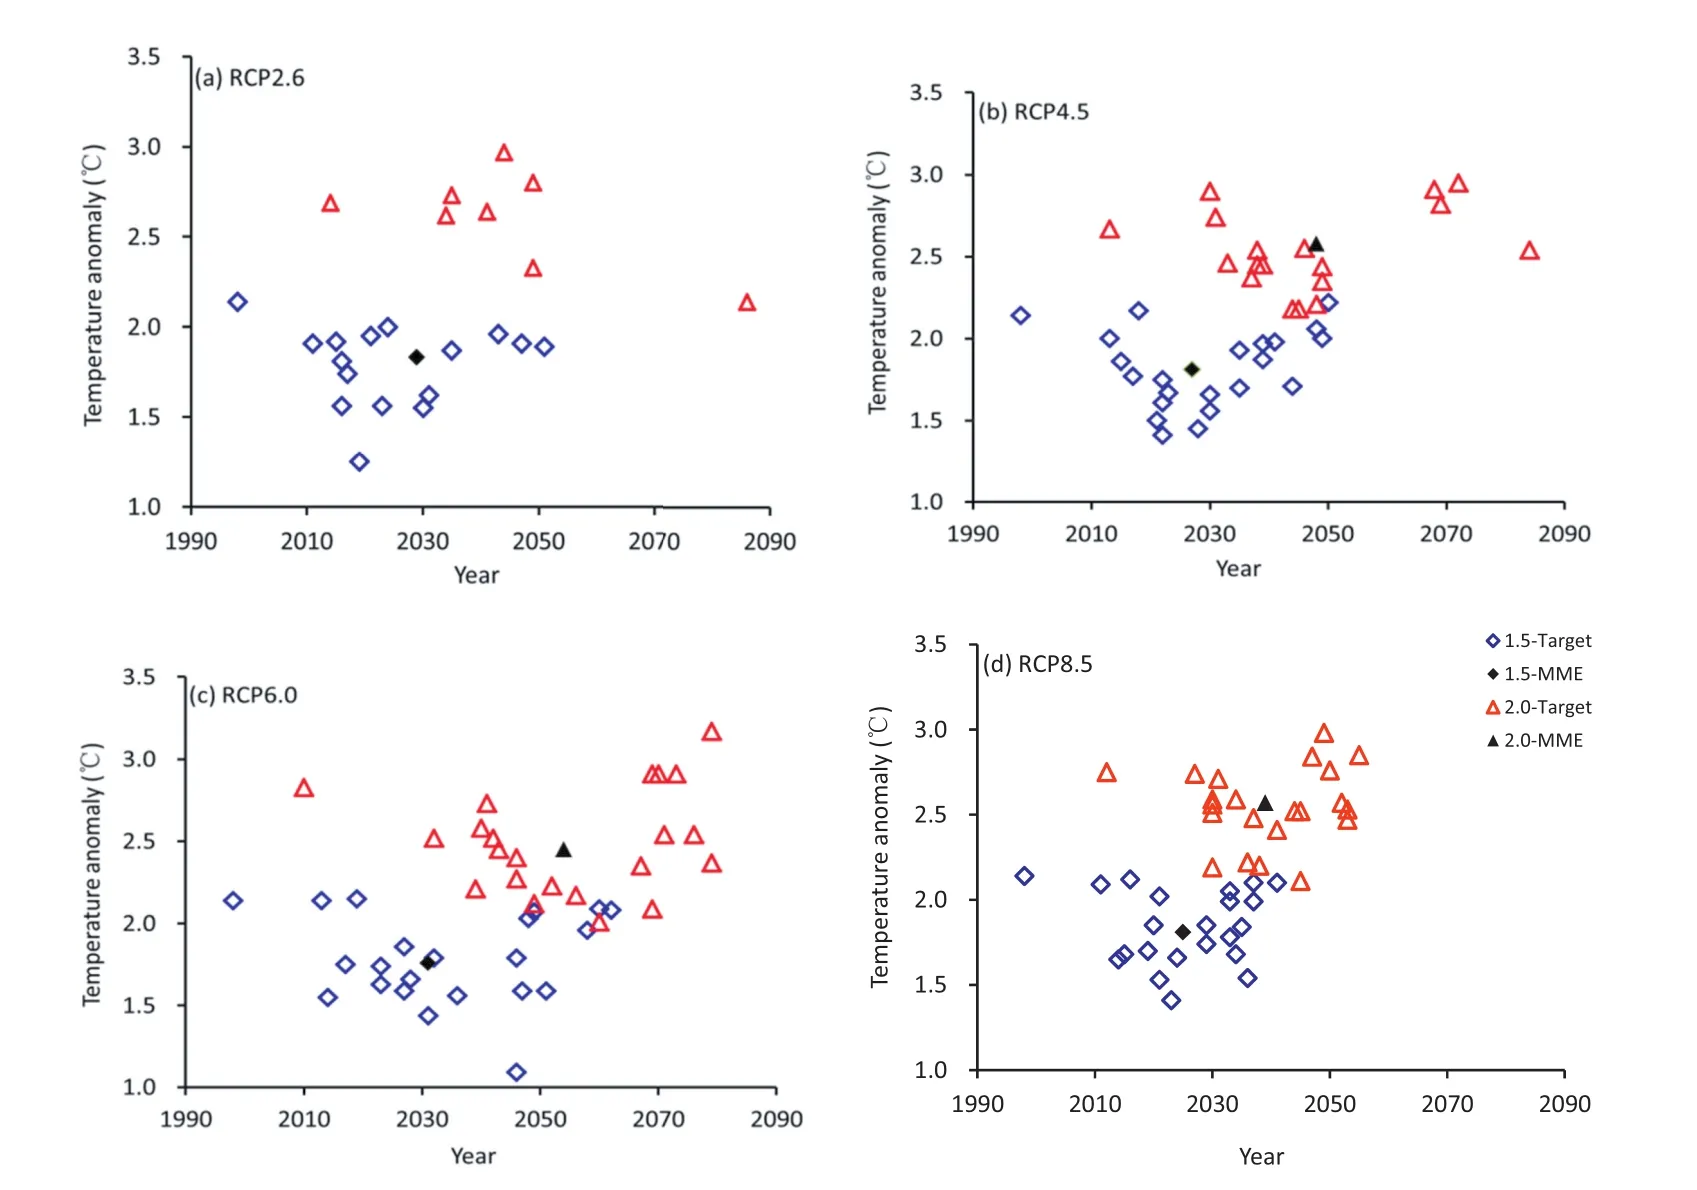
Fig.2.Scatter diagram of the target times and the corresponding changes in the annual mean SATs averaged over China under the 1.5 and 2.0°C targets in individual models and MMEs under(a)RCP2.6,(b)RCP4.5,(c)RCP6.0 and(d)RCP8.5.
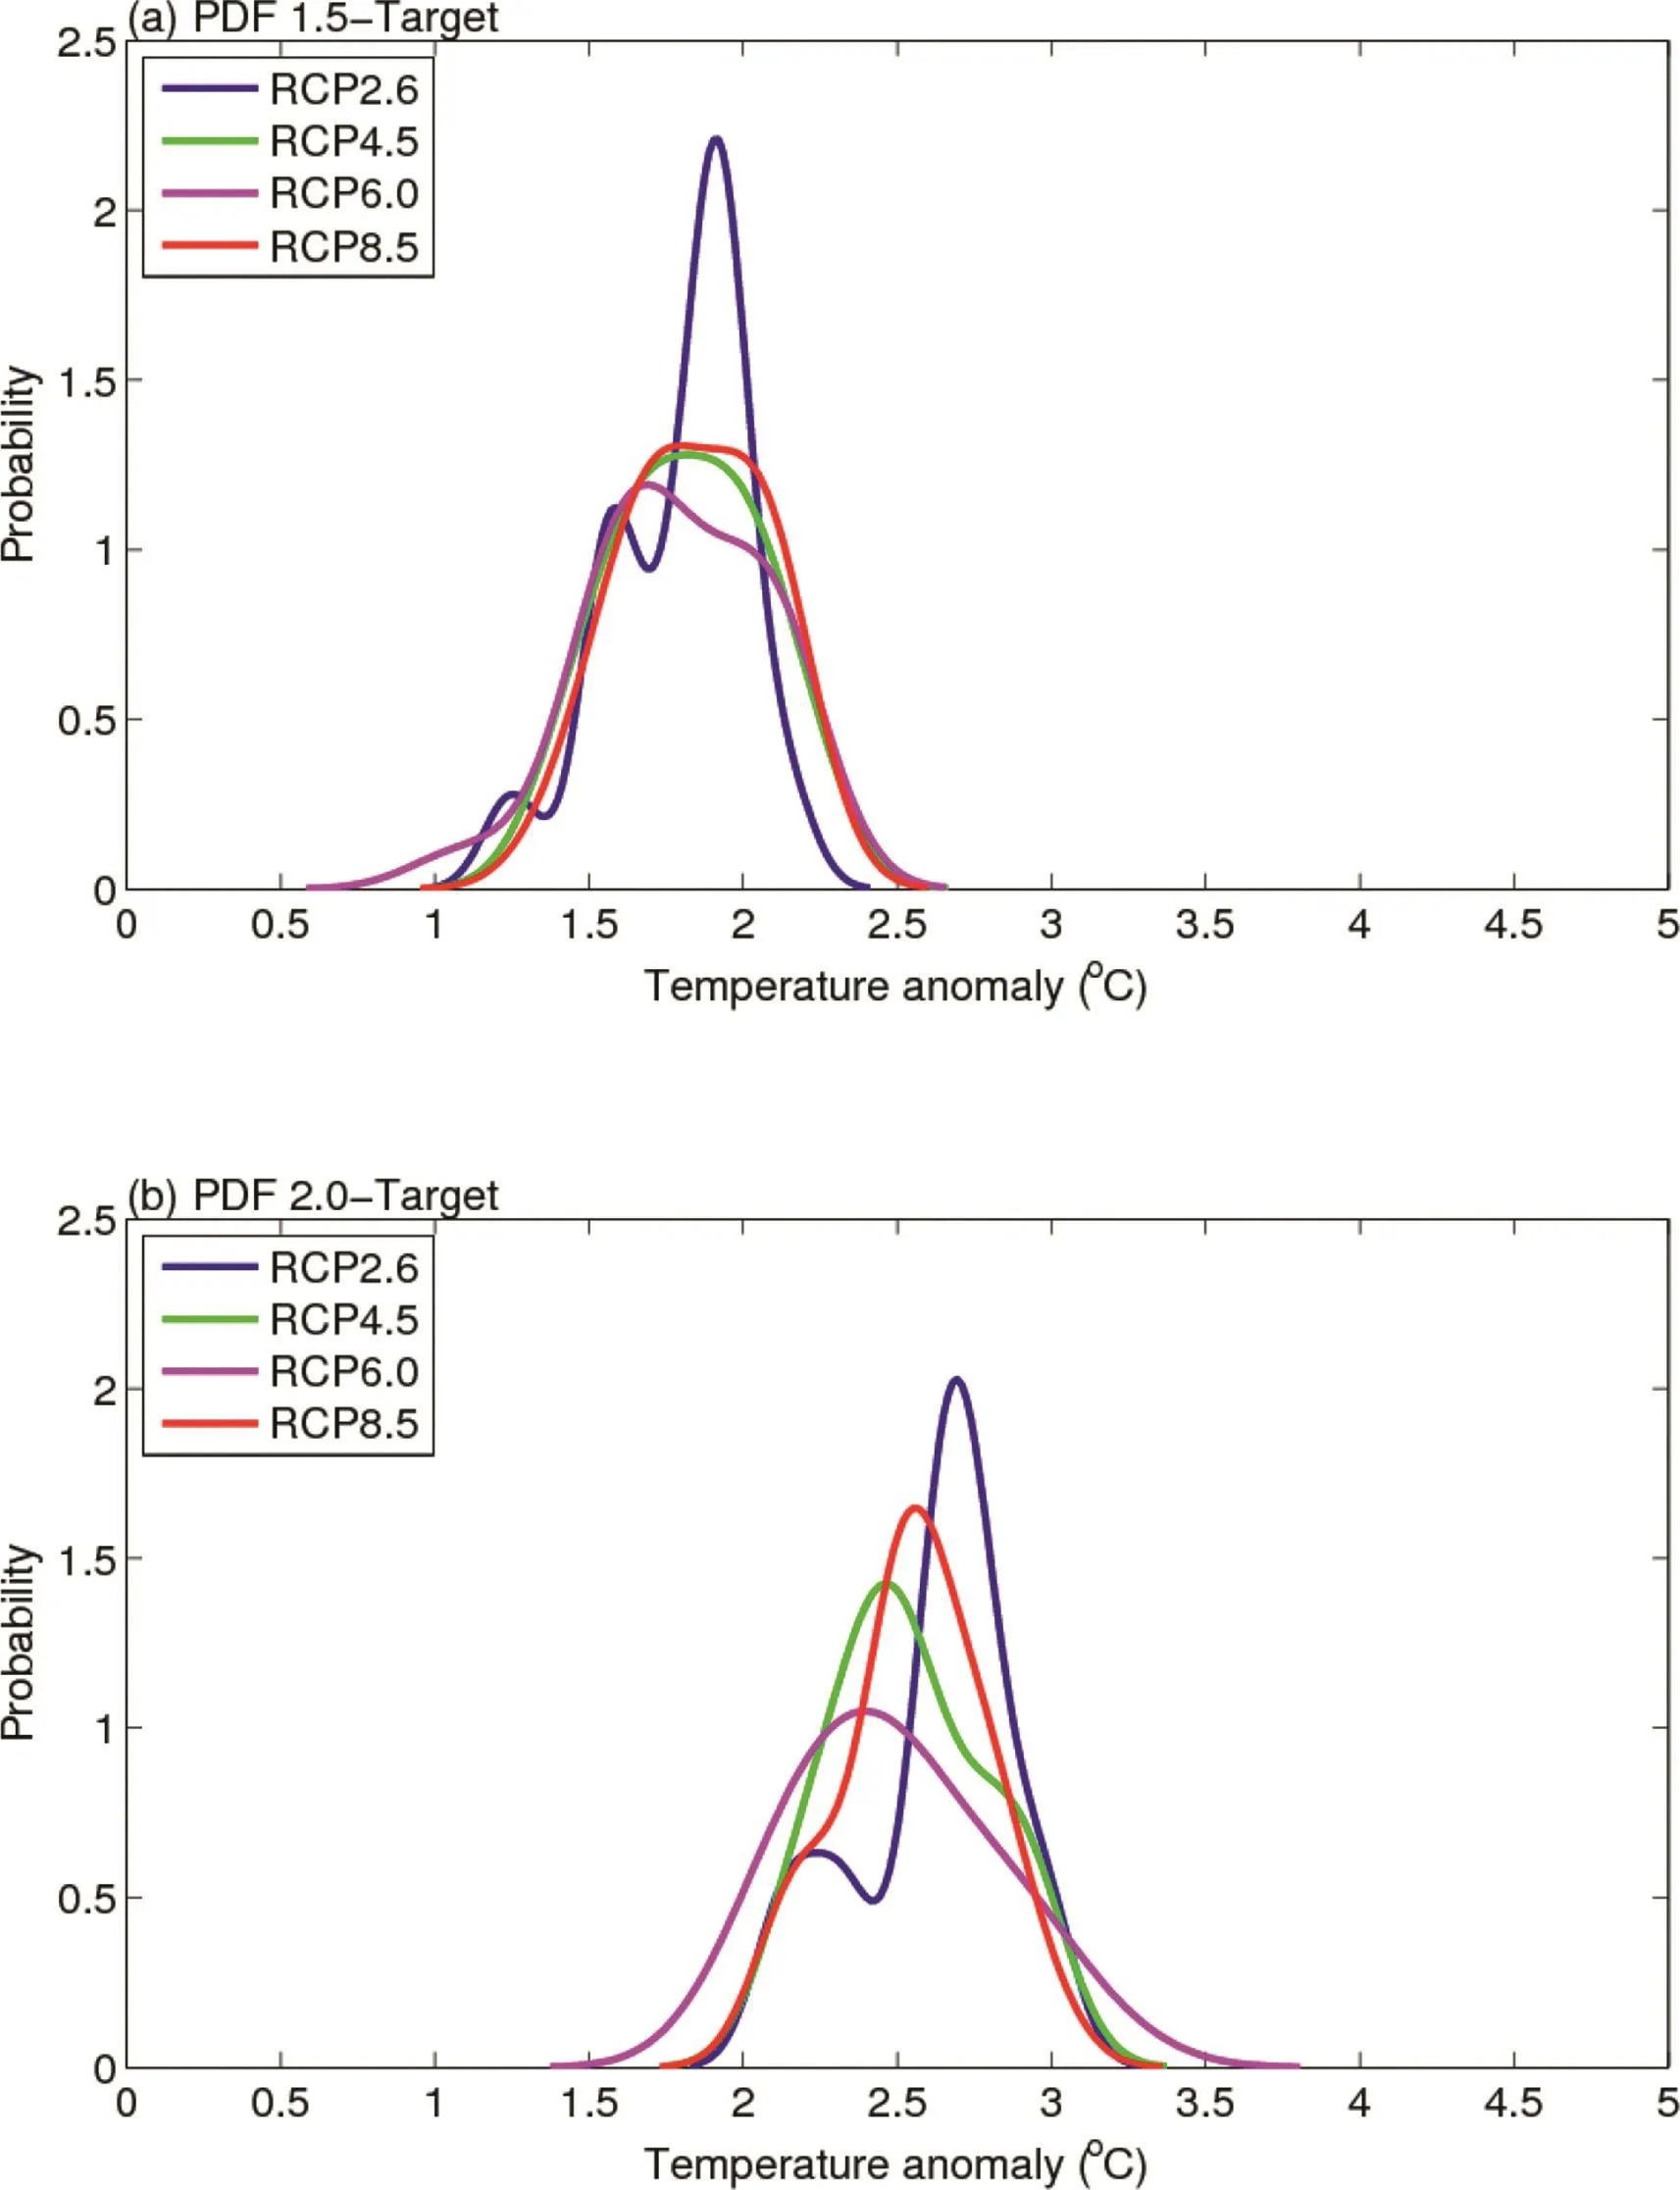
Fig.3.Probability density functions(PDFs)of thechangesin the annual mean SAT averaged over China in individual models under RCP2.6,RCP4.5,RCP6.0 and RCP8.5 for the(a)1.5 and(b)2.0°C targets.
In summary,the above results suggest that the scopes of changes in the average temperature over China are quite narrow under the various pathways for both the 1.5 and 2.0°C targets.Increases of 1.7-2.0°C(2.4-2.7°C)are most likely when the global warming exceeds the 1.5°C(2.0°C)threshold,although the times have a large spread of 40-60(40-80)years among the individual models under the four pathways.Hu et al.(2017)and Shi et al.(2018)also pointed out that the changes in the SAT show little distinction among thedifferent scenarioswhen global warming rises by thesame value.
4.Spatial characteristics of changes in the SAT under the targets
Under the 1.5°C target,the projected large-scale warming would increase from southeastern toward northwestern China under RCP2.6,shows clear spatial distinctions over China(Fig.4a),which resembles the spatial pattern of observed SAT change that occurred during the second half of the 20th century (Ren et al.,2012).Notably,there is a southwest-northeast oriented boundary from northern Yunnan province to northern Shandong province,which marks the striking difference in the distribution of the warming rate.The boundary is almost the same as the boundary of the East Asian summer monsoon(Fu and Liu,2007;Li et al.,2013)and theboundary along the dry-wet transition zone in northern China(Li and Ma,2013).Generally,the annual SAT change would be much higher than 1.5°C relative to its pre-industrial level north of the boundary,but would not reach 1.5°C south of it.The strongest warming is greater than 2.5°C over northern Xinjiang and the Tibetan Plateau,which are the most sensitive regions to global warming(Jiang and Fu,2012).It is believed that thisboundary is caused by the differences in thewarming ratesover dry-and wet-lands.Huang et al.(2017)showed that the dry-land warming rate is approximately 1.5 times that of wet-land under the 1.5°C target.We also found that the projected SAT would most likely increase by 1.9-2.1°C over the north region and 1.3-1.5°C over the south region under the 1.5°C target(Fig.5a),and the warming rate over the former region isapproximately 1.4-1.5 timesthat of the latter region.Huang et al.(2017)demonstrated that the high sensitivity of the SATover dry-land mainly results from the limited soil moisture and vegetation,and any extra heating will be used to raise the SAT.They also pointed out that both cirrus cloud and less anthropogenic aerosols over dry-land help to warm dry-land surface by affecting the radiative forcing.On
the other hand,Zhou et al.(2015;2016b)suggested that the faster warming over northwestern China is likely attributable to enhanced longwave radiative forcing associated with a stronger water vapor feedback over drier ecoregions in response to the positive global-scale greenhouse gas forcing.Under the other three pathways,the projected changes in the SAT show almost the same spatial characteristics over China as that under RCP2.6(Fig.4b-d).

Table 2 The mean values and standard deviations(StDs)of warming over China in individual models under the 1.5 and 2.0 °C targets(unit:°C).
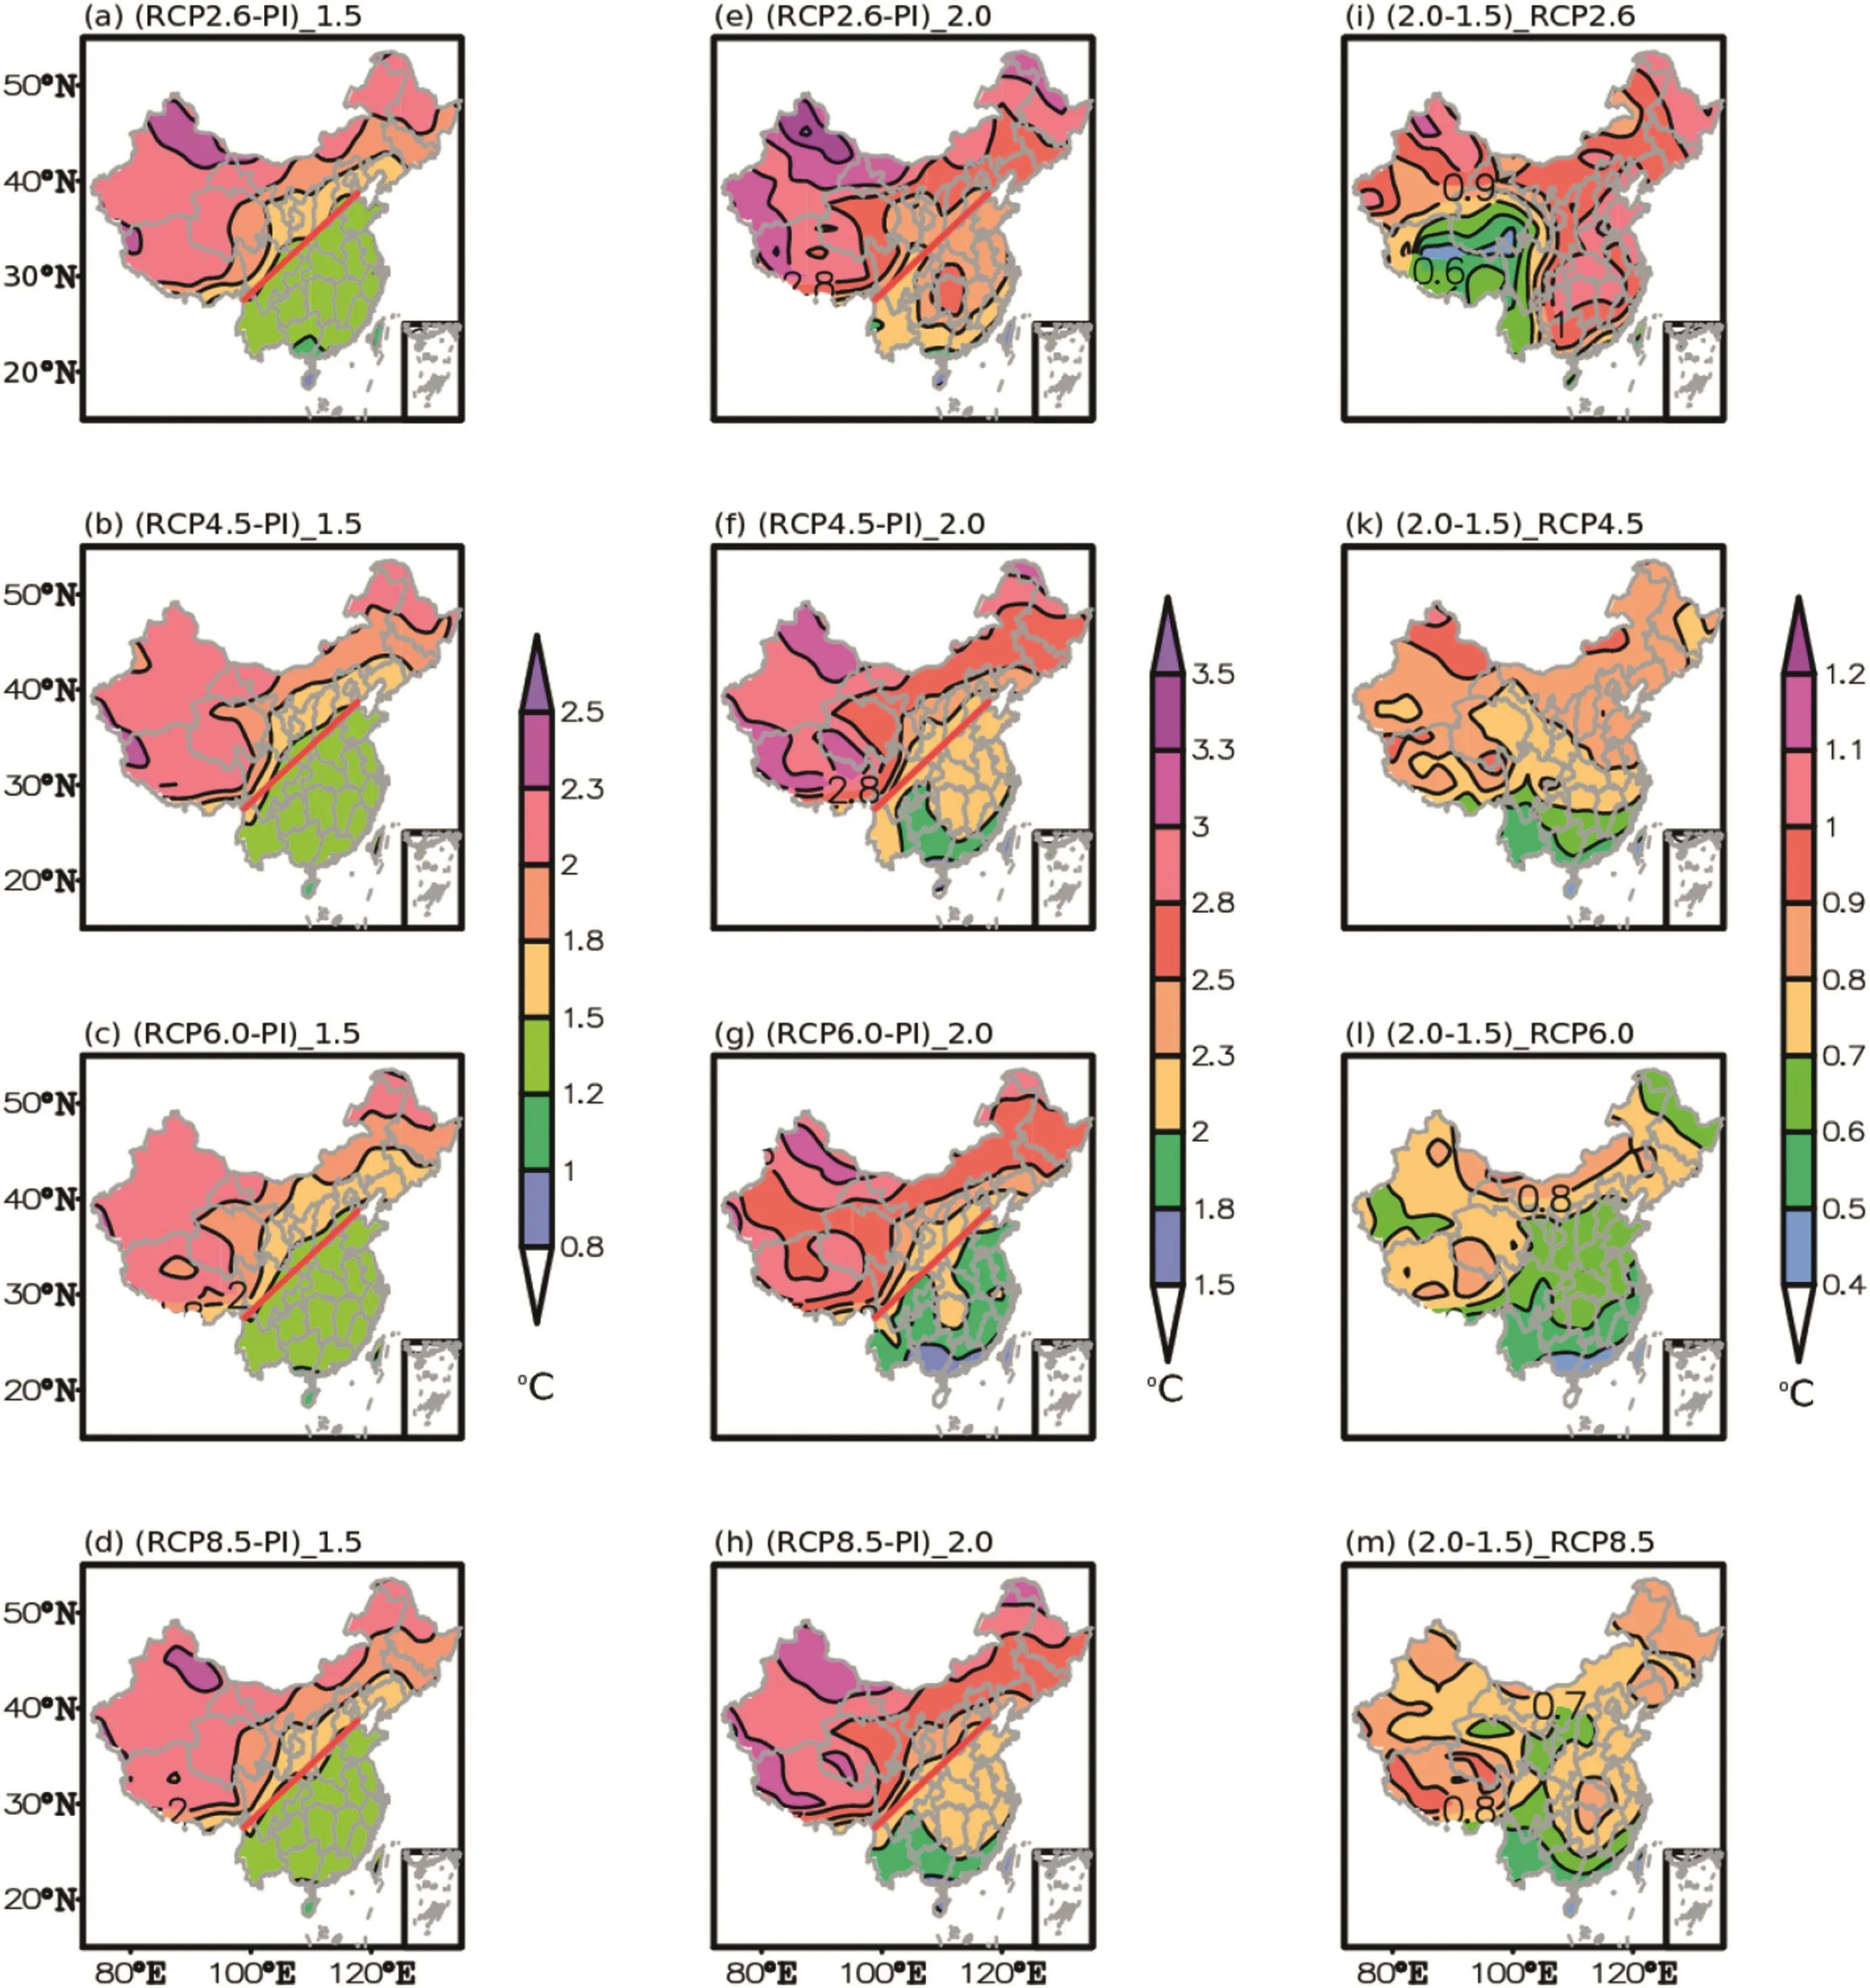
Fig.4.Left panel:changes in the annual mean SAT over China under(a)RCP2.6,(b)RCP4.5,(c)RCP6.0 and(d)RCP8.5 for the 1.5°C targets.Middle panel:sameasin left panel,but for the2.0 °Ctargets.Right panel:sameasin left panel,but for thedifferencesbetween the 1.5 and 2.0 °Ctargets.Thered linesin(a-h)show the location of the boundary(All changes are signifi cant at the 5%level).
Under the 2.0°C target,the changes in the SAT show similar spatial patterns as those under the 1.5°Ctarget,with a stronger warming ratein northwest part of China and aweaker rate in southeast part(Fig.4e-h).Except for a few local regions in South China,the warming would cross the 2.0°C threshold over all of China under the various pathways.It would be greater than 2.5°C north of the boundary,with the strongest warming being approximately 3.5°C over northern Xinjiang and the Tibetan Plateau.However,the warming does not reach 2.3°C south of the boundary.
The differences in the warmings between the two targets indicate that the differences in the SATwould be greater than 0.5°C over almost all of China under the various RCP scenarios(Fig.4i-m),and these changes are higher than the global mean.Generally,the SAT would increase faster over high-latitude regions and the Tibetan Plateau in northwest part of China,and would exceed 0.9°C in those regions,although some distinctions exist among scenarios.
Fig.5 shows the PDFs of the changes in the SAT averaged over theregionsnorth and south of theboundary,which can be used to quantitatively compare thewarming rates over the two regions.Under the 1.5°C target,a clear shift is evident(Fig.5a).The largest PDF values are approximately 1.9-2.1°C in the north region and approximately 1.3-1.5°C in the south region.It suggests that the projected SAT has the largest probability to increase by 1.9-2.1°C over former region and by 1.3-1.5°C over latter region.The warming rate over dry region is approximately 1.4-1.5 times that over wet region,which is consistent with the fi nding in Huang et al.(2017).Otherwise,the shapes of the PDF curves are almost the same as each other under the various RCP pathways for both regions,except for the curve under RCP2.6 because of the fewer samples included in the calculation.The mean valuesareapproximately 2.0°Cand 1.4°C,whilethe StDsare approximately 0.2-0.3°C for both regions(Table 3),which further indicate the limited differences among the various pathways and limited dispersion among the models.
Under the2.0°Ctarget,thereisalso aclear shift in the PDF curves of the warmings rates north and south of the boundary,and thisshift issimilar to that under the 1.5°Ctarget(Fig.5b).The SAT would have the largest probability to increase by 2.6-2.7°C over north region and by 2.0-2.2°C over south region under the medium and high emission scenarios.The warming rate over former region is approximately 1.2-1.3 times that of latter region.There are only eight sensitive models evolved in the calculation under RCP2.6,and thus result in a relatively stronger warming(2.9 and 2.4°C).In addition,the curve shapes are very similar.All the mean values are within the ranges of 2.7-2.8°C and 2.0-2.2°C over the two regions,and the StDs are approximately 0.3°C under the various RCP scenarios(Table 3),which further confi rms the consistency of the results.
Thus,the above results show that there is a clear boundary that clearly marks the distinction between the warming rates over northwest and southeast partsof China.Thewarming rate north of the boundary is approximately 1.4-1.5(1.2-1.3)times that south of the boundary under the 1.5°C(2.0°C)target.Over the former region,the projected warming would be 1.9-2.1°C(2.6-2.7°C)relative to its pre-industrial level under the 1.5°C(2.0°C)target;while the projected warming over the latter region would be 1.3-1.5°C(2.0-2.2°C)under the 1.5°C(2.0°C)target.Furthermore,these changes in the SATareindependent of the RCPpathwaysand the timeswhen the thresholds are crossed.
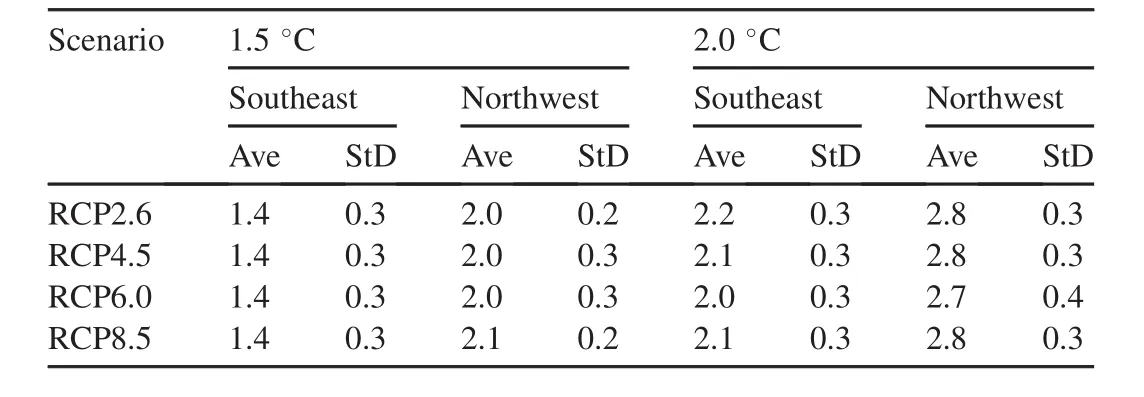
Table 3 The mean values and StDs of warming over southeastern and northwestern China in individual models under the 1.5 and 2.0 °C targets(unit:°C).
5.Conclusions and discussion
This study investigated the projected changes in the annual mean SAT(relative to the pre-industrial period,1861-1900)over China under the 1.5 and 2.0°C targets,by analyzing the outputs of 22 CMIP5 models in HIST and under RCP2.6,RCP4.5,RCP6.0 and RCP8.5.
The MME results show that the SATaveraged over China would increase by approximately 1.8°C(2.6°C)under the various RCP pathways for the 1.5°C(2.0°C)target.The MME global warming would not reach 2.0°C under RCP2.6.In the individual models,the scope of changes in the SAT averaged over China is quite narrow.The SAT would have the largest probability to increase by 1.7-2.0°C under the 1.5°C target for all RCP pathways,even though the target is reached in a 40-60 year period.The StDs of the SAT are only approximately 11%of the mean values,which indicates that the results in the individual models are consistent.Similarly,the warming over China is most likely increase by 2.4-2.7°C under the 2.0°C target,even though the times show a spread of 70 years under almost all pathways.
The projected warming increases from southeastern toward northwestern China,and there is a clear boundary that marks the distinction between the warming rates over the two sides.Under the 1.5°C target,the warming north of the boundary is approximately 1.4-1.5 times that south of it.The SAT would most likely increase by 1.9-2.1°Cover the former region,but only 1.3-1.5°C over the latter region.Similarly,thewarming north of the boundary is approximately 1.2-1.3 times the warming south of the boundary under the 2.0°C target.The SAT would increase by 2.6-2.7°C and 1.9-2.1°C over the two regions.All warmings are independent of the RCP pathways and the global target times.
The above MME results are based on all models having equivalent weights,even though some models show false warmings.For instance,the 1.5°C global warming target is simulated to occur in 1998 in FGOALS-s2(Fig.2).These results might have a negative infl uence on the results.Therefore,we attempted to examine the infl uence of these“bad”models on the present results.By comparing the historical simulationsand the observed SAT,approximately onethird models that have the highest skill in representing the observed SAT characteristics are remained,and these are called the “best”models.The MMEs of the “best”models show that the times that the global warming reach the 1.5°C(2.0°C)threshold lag by approximately 10(10-20)years from the results in the MMEs of all models(Figure not shown).However,the warming averaged over China is almost the same as that in the MME of all models.The SAT over China would increase by approximately 1.8°C(2.6°C)under the various pathways for the 1.5°C(2.0°C)target.Therefore,the “bad”models have almost no infl uence on the projected changes in the SAT over China under the global warming targets,but cause the targets to be reached much sooner.
Acknowledgments
We thank two anonymous reviewers and Professor Gao Xuejie for their various constructive and detailed comments,which have greatly helped us to improve the presentation of this paper.This research was supported by the National Key R&D Program of China(2017YFA0603802)and the National Natural Science Foundation of China(41675084).
 Advances in Climate Change Research2018年2期
- Advances in Climate Change Research的其它文章
- 1.5°C target:Not a hopeless imagination
- Impact of and adaptation strategiesfor sea-level rise on Yangtze River Delta
- Development path of Chinese low-carbon cities based on index evaluation
- China's nuclear power under the global 1.5°Ctarget:Preliminary feasibility study and prospects
- Analysis on the synergistic effect of sustainable development of coal industry under 1.5°C scenario
- Changes in temperature extremes over China under 1.5 °C and 2 °C global warming targets
