
Online complex nonlinear industrial process operating optimality assessment using modi fied robust total kernel partial M-regression☆
2018-05-25 11:26:24FeiChuWeiDaiJianShenXiaopingMaFuliWang
Fei Chu *,Wei DaiJian Shen Xiaoping Ma Fuli Wang
1 School of Information and Control Engineering,China University of Mining and Technology,Xuzhou 221116,China
2 State Key Laboratory of Integrated Automation for Process Industries,Northeastern University,Shenyang 110819,China
3 College of Information Science and Engineering,Northeastern University,Shenyang 110819,China
1.Introduction
In modern industrial processes,optimization of process operating performance has become a crucial issue and has received tremendous attention from both academia[1–4]and practice[5]recently because,in the face of growing competition,it represents the natural advantage for maximizing the economic profits.However,it is well known that the industrial process operating performance may deviate from the preliminary designed optimal operating point due to the disturbances and uncertainties.Therefore,process operating optimality assessment becomes important for industrial processes.
Operating optimality assessment is an issue to answer the question“How optimal the current operating performance is?”[6],in other words it is to decide whether the operating performance is optimal or non-optimal and to get a measure on how far the current operating performance is from the optimum under the normal operating conditions[7].Namely,based on the assessment results,managers and operators can further adjust the industrial production and improve process operating performance.
In recent years,some works have been published on the operating optimality assessment gradually[5–8].Ye et al.[5]proposed a probabilistic framework of operating safety and optimality assessment for multi-mode industrial processes,where an optimality assessment index is de fined and used to evaluate the process operating optimality.However,the assessment index is constructed based on the value of optimized objective function,such as plantcost,profits,productquality,the difficulty of calculating plant cost/profits online,and delay of production quality test,which makes the approach not suitable for the practical industrial application online,especially for the timeconsuming and large-scale complex industrial processes.Recognizing that the output-related process variation information is different between different performance grades but are maintained consistent in one performance grade,Liu et al.[7,8]proposed a performancesimilarity-based online assessment approach.They divided the training data into several steady performance grade based on the levels of an economic index,and then the process variation information of each steady performance grade was extracted by the featured extraction methods,such as principal component analysis(PCA)and total projection to latentstructures(T-PLS)[10,11],and used for operating optimality assessment.Although the PCA-based and T-PLS-based assessment methods are similar to some extent,the latter can overcome the low anti-interference ability and weak sensitivity drawbacks presented by the former,by removing the unrelated process variation with respect to the operating performance.Further in,Liu et al.proposed several improved versions of the performance-similarity and T-PLS-based online assessment approach to handle the nonlinearity issue[12],non-Gaussian multimode processes[13],and the misalignment between the actual process measurements and corresponding economic index[5].
However,for real industrial process,the obtained process data may be subjected to outliers[14],which originates from sensor faults,missing data,process disturbances,heavy tails of noise distribution functions,malfunction of instruments,and so on;since PLS is known to be very sensible to outliers[15],the existence of a very small amount of outliers may lead to deceptive results of T-PLS-based operating optimality assessment methods.The approaches for operating optimality assessment listed above did not consider this issue,despite Liu et al.mentioning the outliers in reference[7].Based on the assumption that the data corresponding to a performance grade mainly distribute in an ellipse center area of the dataset,while the edge area of the ellipse is occupied by the outliers,the outliers were merely detected and removed from the modeling datasets by calculating the sample-similarity between each sample and the ellipse center of its data set before the assessment model for each performance grade were established.Nevertheless,for process with strong nonlinearities,the above assumption is usually not valid,and outliers are hard to be detected absolutely especially for processes with heavy-tail noise.Further,if tight sample-similarity threshold is used,too much “outliers”will be detected and removed,leading to insuf ficient samples especially for some performance grades which naturally lack samples.Meanwhile,outliers may contain some important process variations related to the operating performance,which should be extracted to establish exhaustive assessment models for each performance grade.
To minimize the adverse effects of outliers,several robust PLS methods have been proposed[14].Among different robust PLS methods,a version of iteratively reweighted least squares algorithm for PLS has been obtained by Cumms and Andrew,called iteratively reweighted PLS.This method uses regression residuals to examine whether an object is an outlier or not,and calculates weight values to suppress the outliers in the model building step.Compared with other robust PLS methods,reweighted least squares algorithms possess low computational effort[15].Yet,this method is not resistant to bad leverage points(outliers in the space of input variables)[16].To solve this problem,partial robust M-regression(PRM)is proposed.With an appropriate choosing–weighting scheme,bad leverage points are also down-weighted at the same time.Further,a nonlinear version PRM[15],kernel Partial Robust M-regression,KPRM,is proposed which can cope with nonlinear robust problem.To the best of the author's knowledge,however,there have been few reports concerning robust nonlinear T-PLS method despite that the nonlinear robust problem is much more important in practical industrials.
In this paper,we explore the issue of operating optimality assessment for complex industrial process based on performance-similarity considering nonlinearities and outliers simultaneously,and a general enforced online performance assessment framework is proposed,which consists of of fline training,online assessment and non-optimal cause identification.In practical,the process operating optimality performance is closely associated with optimal index(such as plant cost,profits or product quality),and in the of fline training,the training samples can be divided into different data sets according to the level of optimal index,and each data set roughly represents one performance grade;then,total projection to latent structures algorithm will be used to extract the process variations with respect to the optimal index to establish the performance assessment models for each performance grade.Considering the nonlinearities and robustness simultaneously,the primary version of T-PLS is not a good choice.A more powerful T-PLS algorithm is needed,which can cope with nonlinearities and minimize the adverse effects of outliers concurrently,establishing exhaustive assessment models for each performance grade.In the present study,we propose a novel modi fied robust nonlinear T-PLS method,called Total Kernel Partial M-regression(T-KPRM),by extending the choosing–weighting scheme to the kernelbased nonlinear T-PLS algorithm.T-KPRMalgorithm can also be treated as a post-processing method to decompose the KPRM kernel principal space and residual space,in which,with an appropriate choosing–weighting scheme,both bad leverage points and high residual points have been down-weighted.
In the online assessment,based on the understanding that the optimalindex related process variation information differbetween different performance grades,but maintain consistent among the same performance grades,which is also known as performance-similarity[8],the current process operating performance can be evaluated by calculating the performance-similarities between online data and each performance grade modeling data.For the conversion processes between performance grades,the optimal index related process variation would change gradually from one performance grade to another,thus performance-similarities with an ascending rule can also be used to distinct the performance grade conversion.However,the existence of process disturbances and outliers online often make the assessment results not credible.Thus,an enforced online assessment procedure is proposed,and for the non-optimal operating performance,the responsible variables can be identified by the variable contribution-based nonoptimal cause identification method.
The contribution of the present paper are summarized as follows:(1)a robust and nonlinear version of total projection to latent structure is proposed,and based on it,a novel and robust operating optimal assessment approach is developed which considers nonlinearities and outliers simultaneously;(2)an enforced framework for online performance assessment considering the existence of process disturbance and outliers is proposed,and the online assessment results contain both steady performance grades and the conversations between performance grades.
The remainder ofthis paper is organized as follows:Section 2 gives a brief introduction of the algorithms of T-PLS and KPRM,and then the details of the proposed method based on T-KPRM for robust nonlinear process operating performance assessment that are presented in Section 3.The effect of the proposed method is demonstrated by a real case dense-medium coal preparation process,compared with the method proposed by Liu et al.[8].Finally,the paper ends with concluding remarks in Section 5 and some acknowledgements.
2.Review of T-PLS and KPRM
2.1.T-PLS algorithm
T-PLS proposed by Zhou[9]is considered as an improved version of standard PLS.Through further decomposition,the output orthogonal and correlated part can be separated in the principal space,and large process variation can be separated from noise in residual space.Generally,compared with other improved PLS algorithms,e.g.,orthogonal signalcorrection based PLS and orthogonalPLS,T-PLS have been proven to be more effective in providing more accurate process information for those who are more concerned with certain aspects of the whole process information[17].
Let X∈Rn×mbe the input matrix consisting of n samples with m process variables per sample,and Y∈Rn×vbe the output matrix with v single quality variables per sample.It should be noted that in this paper only the case with single output quality variable is considered,i.e.,the ash of the product coal,and T-PLS algorithm for a single output y∈Rn×lbe the outputmatrix with v single quality variables per sample.It should be noted that in this paper only the case with single output quality variable is considered,i.e.,the ash of the product coal,and T-PLS algorithm for a single output y∈Rn×1is used;for the multiple output case,one just need to treat all of the output variables and use T-PLS algorithm for multiple outputs of Y simultaneously.It is assumed that X and y are centered to zero and scaled to unitvariance.PLSdecomposes X and y as follows[9],

where T∈Rn×Ais the score matrix,and P ∈ Rm×Aand q ∈ Rp×Aare the loading matrices for X and y,respectively.A is the number ofPLS components,which is usually determined by cross validation.E and f are the residual matrices of X and y,respectively.In the PLS procedure,to obtain the matrix T,the weight matrix W is used.Let R=W(PT W)-1,then T=XR.
The PLS algorithm extracts the scores T to maximize the covariance between X and y.However,the PLS scores contain components orthogonal to y,which are output-irrelevant parts,and the X-residuals in PLS still contain a large variability,as PLS does not extract the X-variance in descending order.In addition,significant variations in the X-residuals may be affecting the product quality as well.This subspace is not modeled in the PLS model simple because it is not excited in the data that are used to build the PLS model.In summary,variations in both PLS scores and residuals can be relevantto the output y.The T-PLS algorithm is proposed to further decomposes the PLS scores and residuals to sort out components that are relevant to the output y.
Then,based on the T-PLS algorithm,the X-scores and X-residuals can be further decomposed as follows,

where ty∈ Rn×1,T0∈ Rn×(A-1)and Tr∈ Rn×Arare three score matrices and Py∈ Rm×1,Po∈ Rm×(A-1)and Pr∈ Rm×Arare the corresponding loading matrices.Eris the new residual matrix after performing PCA on E and can be expressed as Er=E(I-).Aris the number of output unrelated components.For a single output y,T-PLS needs only one score vector tyto predict the quality variable y.
In Eq.(2),tyrepresents the variations only related to y in original T of PLS model,i.e.,the output-related variations in T,to represent the variations orthogonal to y in T,i.e.,the output-unrelated variations in T,Tris the major part of original X-residual E,and Eris the residual part of E after Tris removed.The T-PLS model decomposes input space X into four subspaces.They are the range spaces of Py,Po,Pr,and()(I-PRT)with dimensionsof1,A-1,Ar,m-A-Ar.A new sample vector xnewis partitioned into four portions,

and the scores of xnewcan be calculated as follows,


From the perspective of process operating performance assessment,only the score tyobtained from the of fline modeling and ty,newof online new sample are needed for they represent the output related process variations which can fully re flect the in fluence of process variation on the output,and it is appropriate to evaluate the process operating performance based on them[18].For the detailed procedures for single output T-PLS algorithm please refer to[19].
2.2.KPRM algorithm
The partial robust M-regression(PRM),developed from Iterative weighted PLS algorithm,is a robust version of the PLS1 approach[15].Through iterative computation,the algorithm can adaptively assign different weights to different sample data(the outliers are assigned close to 0 weight,the normal data are assigned close to 1 weight).The weighted method is used to overcome the in fluence of outlier on model and retain the part of useful information from outliers.Then,the outliers will be divided into two types by PRM algorithm.One is a high leverage point,which is far from the input data center of the sample points,and the other is the high residual point,which is the sample point of the large difference between the output value and the actual value.The algorithm uses different weighting methods to calculate the two types ofoutliers.The leverage weightofthe i th sample data wixlatent is computed as

where c=4 represent Euclidean distance,medL1represent the median estimate of L1.tiis the score vector of the i th sample data,c is a tuning constant,taken as f(⋅).the weightfunction f(⋅)is called the “Fair”function,and is one of several possible weight functions cited in the original IRPLS.
The residual weight of the i th sample datais computed as

where riis the residual part between the actual value and predictive value of the i th sample data.~r is a robust estimator of the sample data.

Using both types of outliers,we can obtain the comprehensive weights of the sample data,

the weights of the sample data are updated continuously until the algorithm satis fies the convergence conditions[20].
KPRM algorithm is developed on the basis of the PRM algorithm.The output data matrix y discussed in this paper is a single output variable.In orderto solve the nonlinearproblemofprocess data,a kernelfunctionϕis introduced to map the process data from original low dimensional space to high dimensionalfeature space F.In the high dimensionalfeature space F,the relationship of the process variables is linear.After the kernel function mapping,the sample data matrix will be changed to the characteristic data matrixΦ(X)=[ϕ(x1),ϕ(x2),…,ϕ(xN)]T∈RN×M.The dimension M of the feature space can be any value,and even can be set to in finity.De fine kernel matrix K=Φ(X)ΦT(X).When the kernel function is introduced to calculate,we do notneed to know the concrete formofthe nonlinear mapping function Φ(⋅),and also there is no need for inner product computation in high dimensional space[12].The kernel matrix of high dimensional space can be obtained by calculating the kernel function Ki,jof the original low dimensional space.
The steps of the KPRM algorithm are as follows:
Step 1:The input data matrix X is projected to the high dimensional feature space F by nonlinear mapping function Φ(⋅).
Step 2:Standard kernel matrix K,then the input kernel matrix K,and output matrix y are processed by PRM algorithm.
Step 3:Initialize the weight Wiby using the formulas(11),(13),and(15).
Step 4:Compute weighted input kernel matrix KWand output data matrix yWwhich obtained by weighting the original input kernel matrix X and output data yW.Then the PLS1 regression model is established after the weighted Input and output data,and the score vector is modi fied.
Step 5:Calculate the residual riof each sample data,and update the weight Wiby using the formulas(11),(13),and(15).
Step 6:Through consecutive calculation twice,the relative difference between q is less than a certain threshold(10-2),then the convergence condition is satis fied,and go to step 5,Otherwise go back to step 4.
3.Proposed Approach for Robust Nonlinear Online Operating Optimal Assessment
3.1.T-KPRM algorithm
In this paper,the T-KPRM algorithm is proposed by combining the advantages of T-PLS and KPRM.T-KPPM algorithm can further decompose the high dimensionalprincipalcomponentsubspace and the residual subspace of the KPLS model.In the principal component subspace,the output related part and the output independent part will be separated.Meanwhile,in the residual subspace,the larger residual and the final noise will be separated.Thus,T-KPRM can accurately extract the variable information related to the output from process data and overcome the in fluence of outlier by adaptively assigning different weights to each sample data,obtaining exhaustive assessment models for each performance grade.
Assuming that the process data matrix X∈RN×Jconsists of N samples with J process variables,and the output data matrix y∈RNonly contains one output process variable.The radial basis function is selected as the kernel functionwhere σ is the standard deviation parameter.The steps of the T-KPRM algorithm are summarized as follows,
Step 1 The columns of the input data matrix X are processed by zero mean and unit variance.Similarly,the output data matrix y is standardized.
Step 2 The inputdata matrix X is projected to the high dimensionalfeature space F by nonlinear mapping function Ф:xi∈RN→Φ(xi)∈F,and obtain the kernel matrix K,which is standard.
Step 3 Input kernel matrix K and output matrixyare processed by PRM algorithm.Initialize the weight Wiby using the formulas(11),(13),and(15)and compute weighted input kernel matrix KWand output data matrix yW.Then the PLS1 regression model is established after the weighted KWand yW,and the score vector is modi fied.Calculate the residual riof each sample data,and update the weight Wiby using the formulas(11),(13)and(15)until the convergence condition is satis fied.
Step 4 The inputdata matrix is KW,the outputdata matrix is yw.Extract convergence of uifromoutputmatrix yW,where i=1,KWi=KW,yWi=yW.(i)Make any column in the yWiequal to ui.(ii)Calculate the score vector of KW,ti=KWiui,ti←ti/‖ti‖.(iii)qi=(iv)Calculate the score vector of yWi,ui=yWiqi,ui←ui/‖ui‖.(v)Determine whether uimeet the convergence condition,if the condition is satis fied,then turn to step 5,otherwise go back to(i);
Step 5 Calculate the load matrix of KWi,pi=Extract all the main elements,compute T,P,U,Q.(i)Make KWi+1=KWi-yWi+1=yWi-.(ii)Command i=i+1,repeat steps 5 and 6 until the main element A is extracted[4],the number of principal components can be determined by cross validation method.(iii)T=[t1,…,tA],P=[p1,…,pA],U=[u1,…,uA],Q=[q1,…,qA].Then,KW=TPT+E,yW=UQT+f.
Step 6 The main element TPTis processed by PRM algorithm:TPT=+and the residual E is processed by PRM algorithm:
If the output data matrix y is a single output variable,the T-KPRM model is as follows,

where the score tyrepresents the direct parts related to yWin T.tyis also the most important variable in the evaluation model.The score tyrepresents the orthogonal parts related to yW,while Tris part ofa larger variance in E,and Eris the final residual part.
When a new sample is introduced,the score matrix will be calculated as

where knewis the kernel function of a new sample data xnewand calculated as

and the mean centering of knewis

with 1t=1/n⋅[1,1,…,1]T∈Rn.
The score vector tyobtained by the T-KPRMalgorithmcan be used to establish an of fline assessment model of industrial process[7],which contains the information related to the comprehensive economic bene fit.
3.2.Off-line modeling of performance grade
Before establishing the evaluation model,the historical data can be divided into severaldata sets according to the comprehensive economic bene fit,and each data setwillrepresentthe corresponding performance grade.For complex industrialprocesses,it is appropriate to set up 3 to 4 performance grades[5].Setting too many performance grades,will make the performance grades very complicated,while setting too few performance grades,will reduce the accuracy of the assessment results.In this paper,four kinds of performance grades,i.e.,poor,general,suboptimal,and optimal,are used and numbered as 1,2,3,and 4 for simplicity,and they correspond to the levelofcomprehensive economic bene fit from low to high respectively.The modeling data sets for each performance grade are denoted as(Xc,yc),c=1,2,3,4,where Xc=[xc(1),xc(2),…,xc(Nc)]T∈RNc×J,yc∈RNc,and Ncis the number of sample data.The of fline evaluation model,and c=1,2,3,4.The score vector form of fline evaluation model calculated by the T-KPRM algorithm is expressed as follows,,i=1,2,…,Nc,where c is the number of performance grades.
3.3.Enforced online performance assessment strategy
In the online evaluation part,taking into account that the single sample data is not suf ficient to characterize the production process performance and is vulnerable to interference of disturbances and noises,thus an online sliding data window with width H is introduced as the basic analysis unit[8].The performance-similaritiesbetween the sliding data window and the corresponding performance grade are calculated at the current moment,and the similarity will be used to evaluate the process operating performance.In order to distinguish the deterministic performance grade and the performance grade conversion,the performance-similarity threshold ε(0.5<ε<1)will be used.When the maximum value of the performance-similarityis greater than the thresholdε,the process performance grade can be determined as p.The performance grade conversion is the performancesimilarity change gradually from the previous performance grade to the next one,and the value of the similarity will show a gradual increasing trend.Then,if the similarity is less than the threshold ε and its value meets the trend of increasing gradually,we can determine the process operates on a performance grade conversion process.
However,despite the sliding window is used,the online assessmentresults maybe inexplicable or even non-actual due to process disturbances and uncertainties.Therefore,the online assessment strategy should be exhaustive and robust to the process disturbances and uncertainties.In this paper,we proposed a modi fied and enforced online operating performance assessment strategy based on three predetermined rules.The main idea is based on the continuity of for the process industries,e.g.chemical process,the industries process operation performance may change fromone performance grade to another performance grade,e.g.change from the optimal performance grade to sub-optimal performance grade.However,the change cannot be finished in an instant,generally,the industrial process performance changes gradually from one grade to another one,the industrial process will go through a conversion performance grade,thus the adjacent online performance assessment results cannot be two different certain performance grades.Ofcourse,we can'tcompletely rule outindividual extreme cases,which rarely appear in the practical industrial process and not be considered in this paper.Generally speaking,we can take all of the assessment results of moment k-1,k and k+1 to determine the ultimate assessment result of the current moment k.
The enforced online operating performance assessment strategy is summered as follows,
Step 1 Construct the online sliding data window Xon,k=[xon,k-H+1,…,xon,k]T,where H is the width of data window,for the initial running moment the data window can be constructed by copying the latest sample data.
Step 2 Normalize xon,kwith the mean and standard deviation of each performance grade.Calculate the standard online window data matrix,c=1,2,3,4 by using of fline modeling.
Step 3 Extract the scoresfrom,whereis the mean centering of
Step 4 Calculate the Euclidean distance between the online data window and the corresponding performance grade c bywhereis the mean of scoreaccording to T-KPRM algorithm,and useto compute the similarity between the sliding data window and the corresponding performance grade c,suppose

where
Step 5 Then the online assessment result is determined by the following three predetermined rules.
Rule 1 Firstly,determine whetherthe discriminate formulais satis fied,ifsatis fied,the currentprocess at moment k can be temporarily determined to belong to a certain process performance grade p.then we need to determine whetherthe assessmentresultofmoment k consist with that of moment k-1,if the assessment result of moment k is consist with that moment k-1,it can be if nally determined that the current process is belong to a certain process performance grade p.Otherwise,we need further determine whether the assessment results of moment k+1 and k-1 are the same,ifthe assessmentresult of moment k+1 is the same with moment k-1,it can be determined thatthe assessmentresultofmoment k is unreliable,and the assessment result of moment k should be consistwith those ofmoment k-1and k+1.Ifthe assessment result of moment k+1 is different with that of moment k-1,but consist with that of moment k,it can be determined that the assessment result of moment k and k+1 is reliable,and the performance grade of the process is changing,from certain grade to grade conversion or from grade conversion to certain grade.In the rare instances,the process may jump from one certain grade to another for the existence of strong disturbance,which is not considered in this study.
Rule 2 If rule 1 is unsatis fied and the condition p=arg maxis satisif ed,it can be temporarily determined that the current process belongs to the performance grade conversion which is the performance-similarity change gradually from the previous performance grade to the next one.l is a positive integer and can be de fined according to production experience.Then we need to determine whether the assessment result of moment k consist with that of moment k-1,ifthe assessmentresult ofmoment k consists with thatmoment k-1,itcan be finally determined that the above assessment result is reliable.Otherwise,we need further determine whether the assessment results of moment k+1 and k-1 are same,if the assessmentresultofmoment k+1 is same with moment k-1,it can be determined that the assessment result of moment k is unreliable,and the assessmentresultof moment k should consist with that of moment k-1.
Rule 3 If both rule 1 and 2 are unsatis fied due to the in fluence of process disturbances and uncertainties,e.g.the assessment results of moment k-1,k and k+1 are all different,the if nal assessment result of moment k and k+1 is considered unchanged and consist with the previous assessment results of moment k-1.
Through the above three predetermined rules,we can effectively determine the certain performance grade or the performance grade conversion of the current moment.The enforced online assessment procedure is shown in Fig.1.
3.4.Non-optimal cause identification
When the process operating performance is non-optimal,itis meaningfulto find the corresponding causes variables.In the data-based fault diagnosis,the application of the contribution plots[21]method is common.Especially for the linear model,the method can be used to find out the relevant variables which are responsible for fault.However,the traditional contribution plots method is not suitable for the model established by kernel function.Recently,Peng et al.[22]proposed a contribution plots method based on T-KPLS to identify the faulty variables.In this section,the method of non-optimal cause identification based on T-KPRM is used.By calculating the partial derivative of the Euclidean distance which is between the online sliding data window and optimal performance grade,we can obtain the variable contribution,and the variable with the largest contribution is chosen as the cause variable for non-optimal operating performance.

Fig.1.Procedure of the online assessment and non-optimal cause identification.
The distancebetween the online sliding data window and optimal performance grade can be re-expressed as follow,

whereandare the of fline evaluation model matrix and mean centered kernel vector of online sliding data window with respect to optimaloperating performance grade,respectively.Then the contribution of variable j tois calculated as

whereis the j th variable of the sample data windowrepresents the trace of a matrix.
4.Simulation Study:Dense Medium Coal Preparation Process
Dense medium coal preparation process,also known as heavy medium coal preparation process has been widely used to upgrade run-of-mine coal in the modern coal industry by separating gangue from product coal to produces metallurgical coal or power station coal[23,24].In order to ensure the stability of product quality and maximum the comprehensive economic bene fit,the dense medium coal preparation process is expected to under long-term stable optimal operating performance.However,dense medium coal preparation process always suffers from some process disturbances and uncertainties,such as fluctuation of the raw coal property and deviate from the preliminary designed optimal operating point.Thus,developed suitable online operating performance assessment and nonoptimal cause identification methods are crucial for the optimal operation of dense medium coal preparation process.In this study,a dense medium coal preparation process is introduced as the research background,and the actual process data collected from this process is used to illustrate the feasibility and effectiveness of the proposed approach.
4.1.Plant description
The coal preparation plant utilizes the heavy medium cyclone to carry out coal sorting,raw coal,and circulating medium are fed into the mixing barrel at the same time,and the mixture is sorted by two products dense medium cyclone,then the over flow and under flow respectively are removed medium,dehydrated and related treatment.Finally,clean coal,middings and gangue products are obtained.While the medium is recovered,concentrated,and ultimately be recycled by medium system.The whole sorting process is divided into the coal flow process and the media flow process.The sensors used in the process include the density meter,the magnetic material,the liquid level meter,and so on.The density meter is used to monitor dielectric barrel suspension density,the liquid level gauge is used to monitor the liquid level of dielectric medium barrel,the magnetic content meter is used to monitor the coal slime content of sorting process.In addition,the whole system with all kinds of solenoid valve controls medium,water,and other flow.The density of heavy medium suspension is the main control object in the process of heavy medium separation.The control of the medium density contains density feedback and ash feedback.The density feedback is used to closed-loop control the density of heavy medium suspension,and the stability of the suspension density is ensured by the control method of the water supply,the diversion,and the adding media.Ash feedback is used to monitor the quality of the product,adjustthe given value ofheavy mediumsuspension density based on ash results and ensure the stability of the product quality[25,26].Fast ash test is the original coal ash indexing which is the basic index of coal quality in coal separating plant.The smaller the ash index is,the less the coal dust is,and the better the quality of coal is.Fig.2 shows the schematic diagram of dense medium coal preparation process.
4.2.Of fline modeling for performance assessment
We select five process variables and one output variable for online operating performance assessment of the dense medium coal preparation process.These five process variables are main density/g·L-1,main liquid level/m,main pressure/MPa,magnetic concentration/g·L-1,coal slime content/%,respectively.Then,the one output variable is:ash index of product coal/%.A total of 9900 samples are collected for establishing operating performance model.According to the practical production process,the dense medium coal preparation process is divided into four kinds ofperformance grade and corresponding performance grade conversion.Table 1 lists the division criterion for assessment in dense medium coal preparation process.

Table 1 The division criterion for assessment
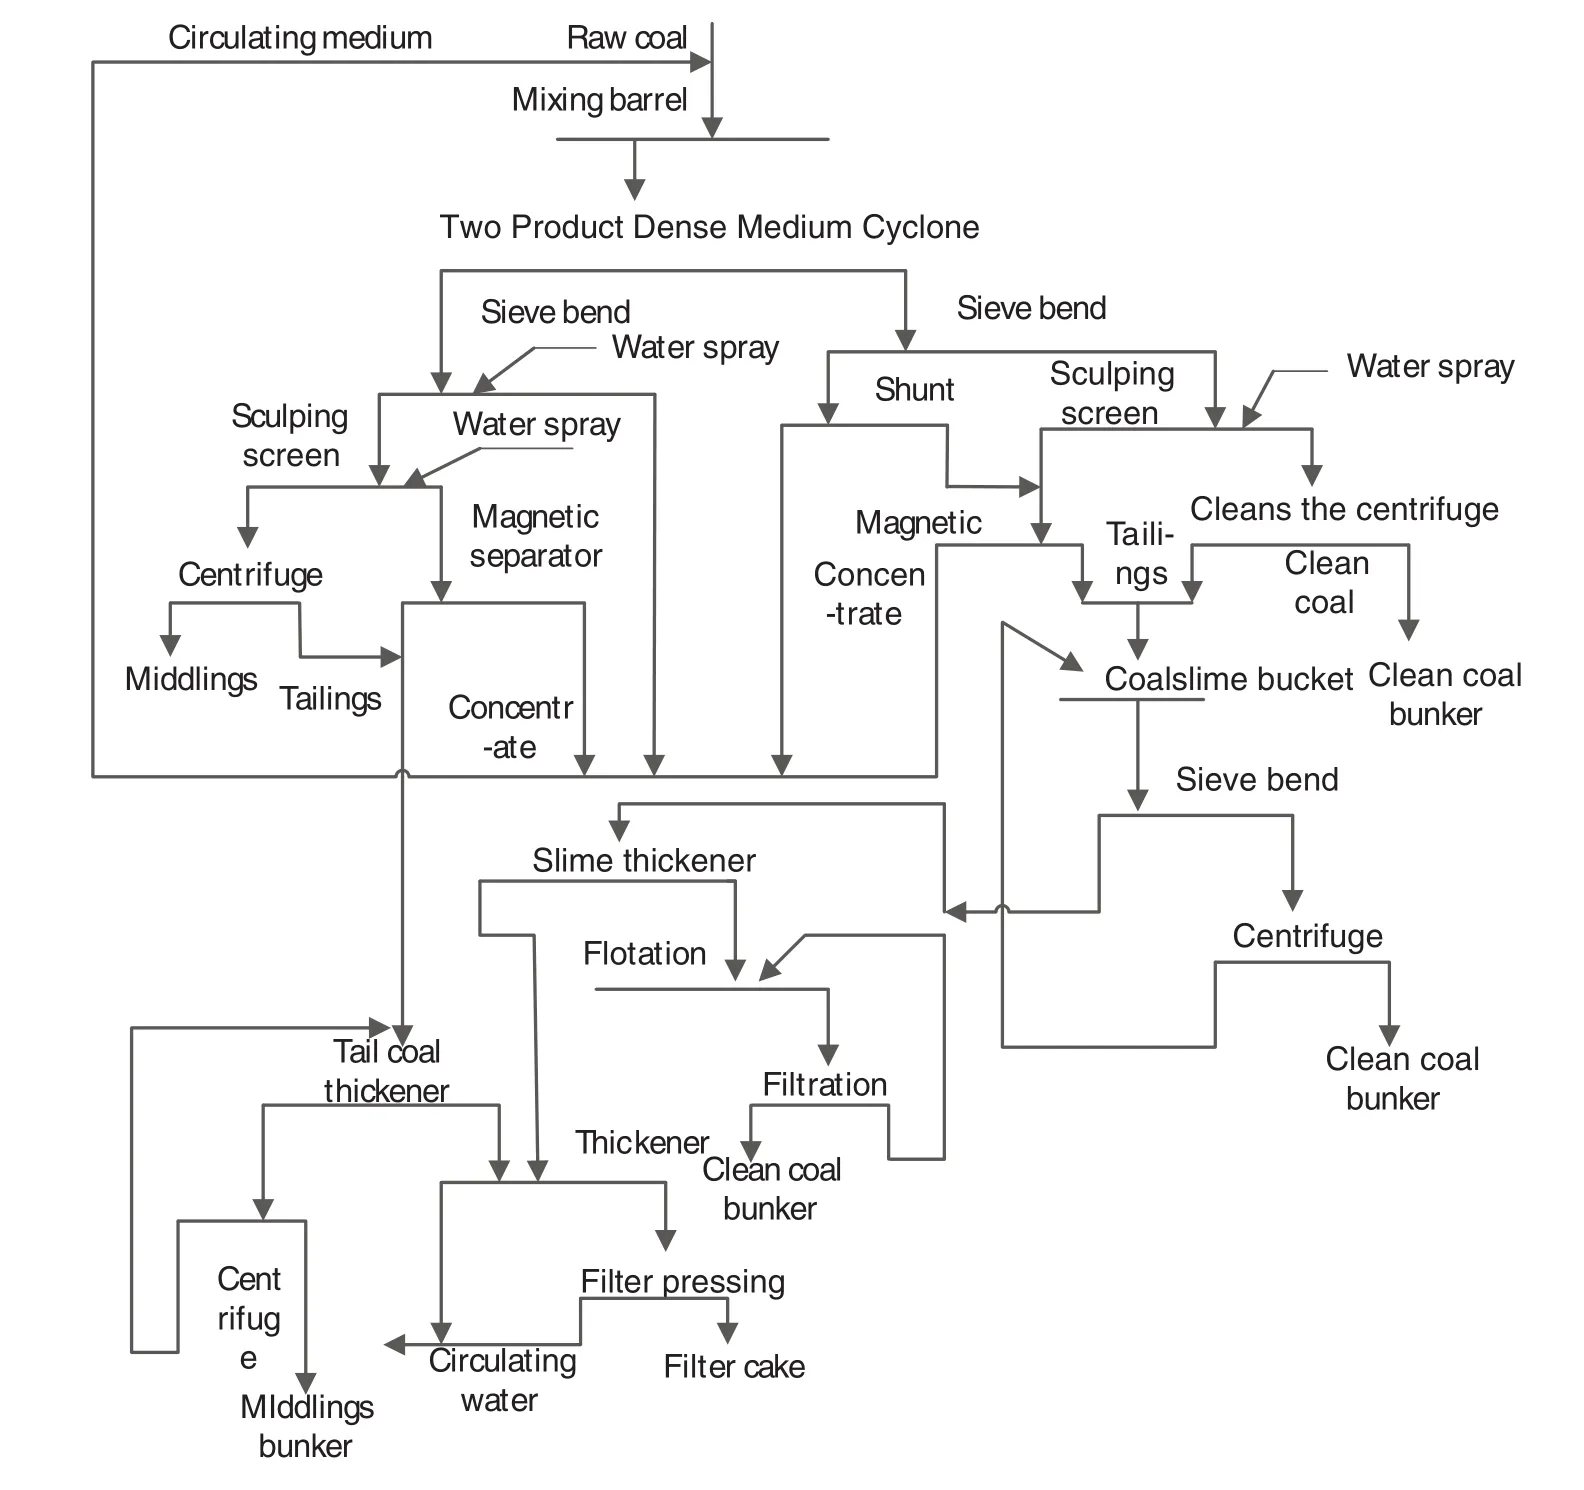
Fig.2.Process flow diagram of heavy medium coal preparation.
Itisworth to note thatthe ‘Optimal’in Table 1 isde fined according to the ash index 6.0–6.5 for the realprocess under study,which is different with the optimal de fined by an optimization problem.The ‘Optimal’in the table contains the optimal point and near optimal points,thus the‘Optimal’in Table 1 can also be considered as near optimal.In this section,the historical data of performance grade poor,general,suboptimal and optimal are collected from the actual process and constitute the modeling datasets(X1,y1),(X2,y2),(X3,y3)and(X4,y4)respectively,and the evaluation modelof each stable performance grade is established by the proposed T-KPRM algorithm.
4.3.Online assessment without outliers
In online assessment part,another 640 samples including four performance grades and the performance grade conversions are collected to verify the effectiveness of the proposed method.Then,the four performance grades:poor,general,suboptimal,and optimal respectively correspond to the number of test samples 103,230,130,and 112.The three performance grade conversions from poor to general,from general to suboptimal,and from suboptimal to optimal respectively correspond to the number of test samples 23,23,and 19.Set the parameters as H=4,l=1,and ε=0.8.In the simulation,the process operating performances in the test samples are poor→conversion→general→conversion→suboptimal→conversion→optimal.The online assessment results are shown in Fig.3.
Fig.3(a)–(d)shows the performance-similarities between the online sliding data window and each of the performance grades.For the sample moment 1–103,the performance-similarities between the online data window and performance grade poor are greater than 0.8,which indicating that the current process operating performance is poor based on the assessment rule 1.Similarly,for the sampling moment 127–355,380–509,and 529–640,the performancesimilarities between the online data window and performance grade general,suboptimal,and optimal respectively are greater than 0.8,thus these illustrate that the corresponding process operating performance is general,suboptimal,and optimal separately.
In addition to the four stable performance grades,at the left sampling moment the process runs into performance grade conversions.For instance,for the sampling moment 104–126,the performancesimilarities between the online data window and performance grade poor are no greater than 0.8,and the successive ascending con-are satis fied.Therefore,it can be identified that the process is operating on the performance grade conversion from poor to general based on the assessment rule 2.Similarly,atthe sampling moment356–378,510–528,itcan be determined that the process operating performance is conversing from general to suboptimal and from suboptimal to optimal respectively.Fig.3(e)shows the assessment results based on the similarities,the vertical axis 1,2,3,4 indicate the performance grade poor,general,suboptimal,and optimal in turn 1.5,2.5,3.5 represent three performance grade conversions respectively.
4.4.Online assessment with outliers

Fig.3.Similarities and online assessment results of the proposed method.
Process data is often subjected to a variety of disturbances(such as sensor failures,process disturbances,etc.),which leads to the existence of outliers.The existence of outliers may make the modeling analysis method lose its proper generalization ability,leading to the decrease ofthe accuracy ofthe assessmentmodels.Thus the robustonline assessmentmethod is needed.In this section,in order to simulate the outliers,we choose to introduce the perturbation to the modeling data sets(X1,y1),(X2,y2),(X3,y3),and(X4,y4).Taking into account that,in the actual production,the number of modeling data sets of optimal and suboptimal performance grades are less than that of poor and general performance grades,5%data of the former modeling data sets are randomly selected to be introduced with disturbances.The way ofintroducing disturbance is that the 5%samples(‘outliers’)selected are divided into two equal parts,and the input of the first part are introduced with 30%disturbance,and the output of the other part are introduced with added 30%disturbance.Meanwhile,10%data of the modeling data of poor and general performance grades are randomly selected to be introduced with disturbance in the similar way as former respectively.The evaluation model( c=1,2,3,4)of each stable performance grade is established by the proposed method(noted as T-KPRM_based).Meanwhile,for comparison,the evaluation model( c=1,2,3,4)of each stable performance grade is also established by the existing method(noted as T-KPLS_based)mentioned in[8].

Fig.4.Similarities and online assessment results with outliers of the existing method(T-KPLS_based).

Fig.5.Similarities and online assessment results with outliers of the proposed method(T-KPRM_based).
Another 603 samples with outliers including four performance grades and the performance grade conversions are collected to verify the robustness of the proposed method.The four performance grades are poor,general,suboptimal,and optimal respectively with the number of test samples 103,211,130,and 96.And the three performance grade conversions are frompoor to general,from generalto suboptimal,from suboptimal to optimal respectively with the number of test samples 23,21,19.Figs.4 and 5 show the evaluation results of the proposed method and the existing method.
It can be seen that the assessment result of the existing method is not available for actual application due to the effect of outliers.On the other hand,the method proposed in this paper can overcome the effect of outliers and shown better robustness.The assessment result of the proposed method is similar with the assessment results without outliers mentioned in Section 4.3,even though there is time delay owingto the small value of the similarities threshold and use of data window,which is acceptable for actual application.

Table 2 The assessment identification accuracy rate of the existing method(T-KPLS_based)

Table 3 The assessment identification accuracy rate of the proposed method(T-KPRM_based)
For further comparison,Tables 2 and 3 presentthe assessment identification accuracy rate ofthe existing method and the proposed method for certain performance grades respectively.The value of the performance-similarities threshold ε is chosen as 0.6,0.7,and 0.8.It can be seen that the assessment identification accuracy rate of the proposed method is much better than the existing method,which indicates that the proposed method is robust to outliers.It can be also seen from Table 3 that bigger similarities threshold may lead to lower identification accuracy of the proposed performance assessment method for the similarities between the online sliding data window and performance grades emerge obvious fluctuations due to the effect of outliers and noises.In the contrary,smaller similarities threshold may lead to time delay as shown in Fig.5.Therefore,the value of the similarities threshold should be reasonably determined according to actual production process,based on an overall analysis of identification accuracy and time delay.For the case used in this study,we suggest the suitable value of performance-similarities threshold is between 0.6 and 0.8.
4.5.Non-optimal cause identification
The non-optimal performance grade means that the industrial process is operating on the other stable performance grade or the performance grade conversion except optimal.The non-optimal cause is usually unchanging when the process operates on a non-optimal performance grade ora performance grade conversion.Thus,the identification result will not be updated until the assessment result changed.
The corresponding non-optimal cause identification results for all the non-optimal operating performances are shown in Fig.6.The Z axis represents the variable contribution rate,the X axis indicate five process variables main density,main liquid level,main pressure,magnetic concentration and coal slime content and the six sampling moments on the Y axis represent respectively correspond to the nonoptimal operating performances.For example,at 515 sample moment,the variable contribution rate of main pressure and main liquid level is higher than the other process variables,thus the major non-optimal cause is main pressure and main liquid level at this moment.For 472 sample moment,the major non-optimal cause is main pressure and main density.In the same way we can find major non-optimal cause at sample moment 50,115,310,and 365 respectively.In summary,the results of online assessment and non-optimal cause identification can guide the operator timely adjust the control strategy of industrial production,improved the performance of the dense medium coal preparation process,and ensure the product coal quality.

Fig.6.Non-optimal cause identification results.
5.Conclusions
In this paper,we proposed a novel approach for operating performance assessment of complex nonlinear industrial process based on modi fied robust total kernel partial M-regression,T-KPRM.The proposed approach T-KPRM can cope with nonlinearities and outliers simultaneously by combing the advantage of T-PLS and KPRM algorithm,and effective extract the optimal-index-related process variation information from process data to establish assessment models for each performance grade.In the online performance assessment part,we propose an enforced online identification framework taking account of the effects of process disturbances and uncertainties,and the process operational performance can be evaluated accurately based on the predetermined assessment rules.Further,the possible responsible cause for non-optimal operating performance can be found by variable contribution-based identification strategy.Finally,the proposed approach is illustrated with a real industrial case of dense medium coal preparation process,and the results show the efficiency ofthe proposed method comparing to the existing method,which have been confirmed by the actual process data from the dense medium coal preparation process without outliers.
Acknowledgements
The authors are grateful to Qi Wu from China University of Mining and Technology for his kind work on the simulation and associate professor Ruhai Lei from China University of Mining and Technology for sharing the real process data used in the case study.
References
[1]S.Pashah,A.Moinuddin,S.M.Zubair,Thermal performance and optimization of hyperbolic annular fins under dehumidifying operating conditions–analytical and numerical solutions,Int.J.Refrig.65(2016)42–54.
[2]P.Wang,C.Yang,X.Tian,et al.,Adaptive nonlinear model predictive control using an on-line support vector regression updating strategy,Chin.J.Chem.Eng.22(7)(2014)774–781.
[3]Z.Fei,K.Liu,B.Hu,et al.,An efficient latent variable optimization approach with stochastic constraints for complex industrial process,Chin.J.Chem.Eng.23(10)(2015)1670–1678.
[4]F.Xu,H.Jiang,R.Wang,et al.,In fluence of design margin on operation optimization and control performance of chemical processes,Chin.J.Chem.Eng.22(1)(2014)51–58.
[5]Y.Liu,F.Wang,Y.Chang,Operating optimality assessment based on optimality related variations and nonoptimal cause identification for industrial processes,J.Process Control 39(2016)11–20.
[6]L.Ye,Y.Liu,Z.Fei,et al.,Online probabilistic assessment of operating performance based on safety and optimality indices for multimode industrial processes,Ind.Eng.Chem.Res.48(24)(2009)10912–10923.
[7]Y.Liu,Y.Chang,F.Wang,Online process operating performance assessment and nonoptimal cause identification for industrial processes,J.Process Control 24(10)(2014)1548–1555.
[8]Y.Liu,Y.Chang,F.Wang,et al.,Complex process operating optimality assessment and nonoptimal cause identification using modi fied total kernel PLS,The 26th Chinese Control and Decision Conference.IEEE 2014,pp.1221–1227.
[9]D.Zhou,G.Li,S.J.Qin,Total projection to latent structures for process monitoring,AIChE J.56(1)(2010)168–178.
[10]H.Li,D.Y.Xiao,Survey on data driven fault diagnosis methods,Control Decis.26(1)(2011)1–9.
[11]Y.Wang,H.Cao,Y.Zhou,et al.,Nonlinear partial least squares regressions for spectral quantitative analysis,Chemom.Intell.Lab.Syst.148(2015)32–50.
[12]Y.Liu,F.Wang,Y.Chang,et al.,Operating optimality assessment and nonoptimal cause identification for non-Gaussian multimode processes with transitions,Chem.Eng.Sci.137(2015)106–118.
[13]Y.Xu,X.Deng,Fault detection of multimode non-Gaussian dynamic process using dynamic Bayesian independent component analysis,Neurocomputing 200(2016)70–75.
[14]Z.Mao,Y.Chang,L.Zhao,Soft-sensor for copper extraction process in cobalt hydrometallurgy based on adaptive hybrid model,Chem.Eng.Res.Des.89(6)(2011)722–728.
[15]Runda Jia,Zhizhong Mao,Yuqing Chang,Shuning Zhang,Kernel partial robust M-regression as a flexible robust nonlinear modeling technique,Chemom.Intell.Lab.Syst.100(2)(2010)91–98.
[16]I.Hoffmann,S.Serneels,P.Filzmoser,et al.,Sparse partial robust M regression,Chemom.Intell.Lab.Syst.149(2015)50–59.
[17]L.I.Gang,Q.I.N.Si-Zhao,J.I.Yin-Dong,et al.,Total PLS based contribution plots for fault diagnosis,Acta Automat.Sin.35(6)(2009)759–765.
[18]J.J.Lee,C.H.Lim,H.S.Son,et al.,In vitro evaluation of the performance of Korean pulsatile ECLS(T-PLS)using precise quantification of pressure- flow waveforms,ASAIO J.51(5)(2005)604–608.
[19]S.Yin,X.Zhu,O.Kaynak,Improved PLS focused on key-performance-indicatorrelated fault diagnosis,IEEE Trans.Ind.Electron.62(3)(2015)1651–1658.
[20]J.González,D.Pena,R.Romera,A robust partial least squares regression method with applications,J.Chemom.23(2)(2009)78–90.
[21]J.Liu,D.S.Chen,Faultisolation using modi fied contribution plots,Comput.Chem.Eng.61(2014)9–19.
[22]K.Peng,K.Zhang,G.Li,et al.,Contribution rate plot for nonlinear quality-related fault diagnosis with application to the hot strip mill process,Control.Eng.Pract.21(4)(2013)360–369.
[23]J.Bai,Y.Xing,Y.Chen,Application of three products heavy medium coal preparation process in Tangshan Chun'ao coal preparation plant,Clean Coal Technol.19(3)(2013)26–29.
[24]M.Wang,L.Tang,The introduction and selection of the wear-resistant material used for the heavy medium pipeline in coal preparation plant,Coal Qual.Technol.1(2011)69–72.
[25]D.Dou,J.Yang,J.Liu,et al.,A novel distribution rate predicting method of dense medium cyclone in theTaixi coal preparation plant,Int.J.Miner.Process.142(2015)51–55.
[26]J.Chen,K.W.Chu,R.P.Zou,et al.,Prediction of the performance of dense medium cyclones in coal preparation,Miner.Eng.31(5)(2012)59–70.
 Chinese Journal of Chemical Engineering2018年4期
- Chinese Journal of Chemical Engineering的其它文章
- An innovative design of septic tank for wastewater treatment and its performance evaluation:An applicable model for developing countries
- Oil field produced water treatment in internal-loop airlift reactor using electrocoagulation/ flotation technique
- From pollutant to solution of wastewater pollution:Synthesis of activated carbon from textile sludge for dye adsorption
- 17α-Ethinylestradiol removal from water by magnetic ion exchange resin☆
- Transesteri fication of sun flower oil in microchannels with circular obstructions
- The extraction of potassium from K-feldspar ore by low temperature molten salt method☆