
Effect ofpreparation methods on the structure and catalytic performance of Fe–Zn/K catalysts for CO2 hydrogenation to light ole fins☆
2018-05-25 11:26:22XuWangJianliZhangJingyuChenQingxiangMaSubingFanTianshengZhao
Xu Wang,Jianli Zhang*,Jingyu Chen,Qingxiang Ma,Subing Fan,Tiansheng Zhao*
State Key Laboratory of High-efficiency Utilization of Coal and Green Chemical Engineering,College of Chemistry&Chemical Engineering,Ningxia University,Yinchuan 750021,China
1.Introduction
Increasing carbon dioxide in the atmosphere threatens human living environment and has negative effects on the climate[1–3].Carbon dioxide reduction is an important measure to mitigate greenhouse effect and so has become a hotspoton globalclimate change research.Itis generally reported that there are three possible strategies in this regard:reduction of the release of CO2,storage of CO2,and utilization of CO2[4–8].Reduction of the amount of CO2needs more efficient and substitutable energy process that could not form CO2during the consumption to replace the fossilfuels such as coal,oil,and naturalgas.Meanwhile,storage ofCO2significantly depends on the CO2capture technology development which is an expensive process with our current technology.In recent years,stringent environmental standards to curb excessive emission of CO2into the atmosphere have spurred the research consciousness to catalytically convert CO2to value-added products.Utilization of CO2to produce value-added chemicals plays a sanguine role in reducing CO2emissions,which not only consumes CO2but also makes carbon dioxide to be other value-added products such as gasoline and ole fins.Recently,Wei et al.[9]and Gao et al.[10]carried out a remarkable and developmental work in CO2direct conversion to fuels.
Among the paradigms in CO2utilization methods,CO2catalytic hydrogenation to light ole fins is one of the potential approaches.Generally speaking,CO2hydrogenation to hydrocarbons,namely CO2-Fischer Tropsch synthesis(CO2-FTS),is a process where CO2transforms into CO during the reverse water gas shift(RWGS)reaction and followed by CO hydrogenation into hydrocarbons via FTS process[11,12].Development of inexpensive iron-based heterogeneous catalysts is attractive due to competitive advantages such as low cost and earth abundance.Promoters such as transition metal Mn,Cu,Co,and Zn and alkaline metal like K and Na were frequently added in ironbased catalyst to improve catalytic performance[13–27].Zn works as a structural promoter,the addition of which to iron-based catalyst,improves CO2adsorption,promotes the hydrogen dissociation,and leads to the formation of smaller Fe crystals and therefore more exposed surface sites[21–24],thus contributing to the increase of activity and stability of the catalysts.Potassium has been extensively studied as a promoter for Fe-based Fischer–Tropsch catalysts and,more recently,for Fe-based catalyst on CO2hydrogenation to hydrocarbon reaction.It has been shown that it is an active promoter for the RWGS reaction and favors CO and CO2adsorption,restrains the formation of methane to increase the chain growth probability and enhances the production of ole fins and CO2hydrogenation activity[3,25–28].
The promotion effects of various promoters and supports on iron catalysts also strongly depend on the preparation methods so as to influence the structure of the catalysts.Fe–Zn catalysts have been proved to be good catalyst samples in CO2hydrogenation to ole fins[23,24],however,the structure and the morphology ofFe–Zn precursors strongly depended on the preparation methods.The effect of zinc addition to iron catalysts during CO2hydrogenation has been investigated in our previous studies,which was proved to suppress the formation of heavy hydrocarbons and promote the formation of light ole fins[23].In this work,comparative study was conducted on Fe–Zn/K samples prepared by three different synthesis methods:solvothermal method(S–Fe–Zn/K),hydrothermal method(H–Fe–Zn/K)and co-precipitation method(C–Fe–Zn/K)followed by potassium promotion.The structural effect caused by different preparation methods was distinct.The relationship between the structure and the catalytic performance of the catalysts was discussed and compared by means of characterization of physicochemical properties.
2.Experimental
2.1.Catalyst preparation
2.1.1.Preparation of S–Fe–Zn catalysts
Typical synthesis procedure as reported previously[29],was conducted as follows: firstly,a certain amount of Zn(CH3COO)2·2H2O and Fe(NO3)3·9H2O was completely dissolved into a glycerol and isopropanol mixed solvent in a 100 ml beaker.The Fe/Zn molar ratio was 3:1,2:1 and 1:1 for different samples.After being stirred for 30 min,the homogeneous solution was transferred into a 50 ml Te flon-lined stainless steel autoclave,which was sealed and maintained at 180°C for 12 h in an oven.Secondly,the autoclave was cooled down to room temperature naturally,and the precipitate was collected by centrifugation and washed for 6 times with deionized water and ethanol alternately,then dried in air at 80°C for 12 h.Finally,the obtained product was calcined at 400°C for 2 h under air atmosphere with a heating rate of 2 °C·min-1.
2.1.2.Preparation of H–Fe–Zn catalyst
H–Fe–Zn/K catalyst was prepared using Fe(NO3)3·9H2O and Zn(NO3)2·6H2O as iron and zinc sources,respectively.The Fe/Zn molar ratio was 2:1,and the iron/urea and zinc/urea molar ratio was 1:5 for the sample.First,desired amounts of Fe(NO3)3·9H2O,Zn(NO3)2·6H2O and urea were dissolved and mixed in 400 ml of deionized water.Then,the mixed solution was put into a 500 ml Te flon-lined stainless steel autoclave,which was maintained at 120°C for 12 h in an oven.Subsequently,the autoclave cooled down to room temperature naturally and the precipitate was collected by centrifugation and washed with deionized water for 6 times,then dried in air at 80°C for 12 h.Finally,the product was calcined at 400°C for 2 h under air atmosphere and the heating rate was 2 °C·min-1.
2.1.3.Preparation of C–Fe–Zn catalyst
C–Fe–Zn catalyst was prepared by co-precipitation from the corresponding solutions of nitrates with sodium hydroxide solution.The two solutions were concurrently added to a 2000 mlbeaker and continuously stirred at 60°C.The pH value was controlled at about 7.0.The precipitate was aged for 2 h,then filtered and washed with distilled water 9 times.The gels were dried at 120°C for 12 h,and then calcined in air at 400°C for 4 h.
All the above obtained powder was dipped in a 1.0%K2CO3solution,then dried and tableted and crushed to obtain 20–40 mesh sizes.
2.2.Catalyst characterization
The BET surface areas of the samples were determined at 77 K in a JW-BK132F type N2adsorption–desorption.A 300 mg sample was pretreated firstly in a flow of He and then degassed in a vacuum at 300°C for 2 h before measurement.The surface area was calculated by employing the Brunauer–Emmett–Teller(BET)equation according to multi-point method.
The microscopic morphology was observed on a JEOL-JSM-7500F field emission scanning electron microscope(SEM)at a low voltage of 3.0 kV to make a more sensitive signal of the samples and obtain clear pictures of the samples.
Powder XRD measurements for all the fresh and used catalyst samples were detected on a Rigaku D/MAX-2200PC X-ray diffractometer,equipped with CuKαradiation(l=1.5406 nm).The operation condition is 40 kV,30 mA and the scanning speed is 8(°)·min-1from 5°(2θ)to 85°.H2temperature-programmed reduction(H2-TPR)measurement of the fresh catalysts was carried out on a TP-6060 chemisorption analyzer.A 50 mg sample was dealt with He(30 ml·min-1)at 350 °C for 40 min,and then cooled down to room temperature.The sample was reduced by a flow(25 ml·min-1)composed of 5%H2and 95%N2.The sample was heated from 25 °C to 800 °C and the heating rate was 10 °C·min-1.
CO2temperature-programmed desorption(CO2-TPD)was performed by the pulse technique using a Micromeritics AutoChem II 2920 instrument with a TCD detector.At first,a sample of 50 mg was pretreated with a flow of 10%H2and 90%Ar(30 ml·min-1)at 400 °C for 1 h.Then the temperature was cooled down to 50°C under a flow of He.The analysis was measured by a successive pulse of 1 ml of CO2into the He flow using a loop.The TPD data were collected from 50°C to 800 °C at a heating rate of 10 °C·min-1in a helium flow.
The X-ray photoelectron spectra(XPS)were investigated on a Thermo Scientific ESCALAB 250 spectrometer for the whole samples with an AlKαX-ray source,meanwhile,the base pressure of the chamber was less than 2×10⁻⁸Pa.The binding energies(BEs)were calibrated relative to adventitious carbon using the C 1s peak at 284.8 eV.
2.3.Catalytic activity tests
The CO2hydrogenation reaction was evaluated in a fixed-bed reactor with a stainless bed(8 mm i.d.,400 mm in length)containing 1 ml of catalyst sample.The height to diameter ratio(H/D)of the catalyst bed was about 5.Firstly,the samples were reduced in situ at 400°C for 6 h in a flowing stream of 30%H2in N2(GHSV=1000 h-1and P=0.1 MPa).The sampling interval was about 12 h.The catalytic reaction conditions were as follows:H2/CO2=3(molar ratio),GHSV=1000 h-1,P=2 MPa and T=320°C.The effluent gas was analyzed using an online gas chromatograph(GC-9560-I),which was equipped with a TCD detector(2 m TDX-01 packed column)for C1product analysis,and a FIDdetector(50 m Al2O3capillary column)for C1–C5hydrocarbon products,respectively.The liquid products were analyzed on an off-line gas chromatograph(GC-9560-II),which was equipped with a TCD detector(2 m GDX-401 packed column)for the aqueous phase products analysis and a FID detector(30 m SE-30 capillary column)for the oil phase product analysis.The mass balance was based on carbon and the results were calculated in terms of activity by CO2conversion,light ole fin selectivity by ole fin fraction in overall hydrocarbon products and ole fin to paraffin ratio(O/P)in the C2–C4fraction.
3.Results and Discussion
3.1.Phase structure of the catalyst samples
Fig.1 shows the X-ray diffractogram of powdered Fe–Zn/K catalyst samples and their compounds before reaction.The samples prepared by different methods and various Fe/Zn ratio show different characteristic peaks.ZnFe2O4is the only detectable phase in the sample C–2Fe–1Zn/K and in the samples S–3Fe–1Zn/K and S–2Fe–1Zn/K,whose diffraction peaks are at 2θ =18.2°,29.9°,35.2°,36.8°,42.8°,53.1°,56.6°,62.1°and 74.5°[15,29].However,ZnFe2O4and ZnO co-exist with increasing Zn content in the S–1Fe–1Zn/K sample.The 2θ at 31.7°,34.4°,36.2°,47.5°,56.6°,62.8°,66.4°,67.9°and 69.0°is assigned to ZnO.For the H–2Fe–1Zn/K sample prepared by hydrothermal method,ZnO and Fe2O3could be observed.The sharp peaks reveal that the catalysts are highly crystalline.The diffraction peaks assigned to Fe2O3phase are observed at2θ=24.1°,33.2°,35.6°,43.5°,49.5°,54.0°,62.4°and 64.0°[15].

Fig.1.XRD patterns of the fresh samples.
Fig.2 indicates the phase structure of the used samples(signed as AR).Also,the preparation methods have great in fluence on the structure of the active catalysts.As shown in Fig.2(a),all the used samples contain Fe3O4,ZnO and Fe5C2.ZnO was distinct in the used H–2Fe–1Zn/K sample,while less ZnO can be observed in the AR-C–2Fe–1Zn/K sample after reaction.Fe5C2active phase for FTS is formed during CO2hydrogenation reaction and has been confirmed by XPS measurement.ZnFe2O4phase transforms into Fe3O4after in situ H2reduction before reaction[30],and then partially carburized to Fe5C2during reaction.The structural evolution of C–2Fe–1Zn/K sample(see Fig.2(b))is conducted at different reaction times(TOS=6 h,12 h,24 h,48 h and 72 h,respectively)and under the same reaction conditions(at H2/CO2=3,GHSV=1000 h-1,P=2 MPa and T=320°C).It is revealed that Fe3O4,Fe5C2and ZnO phases are formed during the initial reaction time of 6 h,and then the phase structures remain stable after 12 h of reaction,suggesting that the structural evolution occurs mainly within 12 h of reaction.There is no obvious change of structures within time on stream of 144 h.
3.2.Textural properties of the fresh samples

Fig.2.XRD patterns of the used samples.(a):Samples prepared by different methods;(b):C–2Fe–1Zn/K samples with different reaction time.
Fig.3 indicates N2adsorption–desorption isotherms of the fresh and used catalyst samples.As shown in Fig.3,sample(a)prepared by hydrothermal method exhibits a H1-type hysteresis loop,which is attributed to pores with narrow necks,wide bodies just like the shape of ink bottle[31].Sample(b)prepared by co-precipitation method showed different mesopore structures which belongs to H2-type hysteresis loop,revealing thatthe mesopore is considered as an assemblage of particles rigidly joined together and an aggregate as an assemblage of particles which are loosely coherent.However,the samples(c)–(e)prepared by the solvothermal method with different Fe/Zn molar ratios shows a H4-type hysteresis loop,indicating the presence of mesopores in the samples,which is mainly formed by the nanosheets like plates piling up together(see Fig.4(a)and(b)).These characteristics are correlated well with the morphology of the catalyst samples prepared by different methods.

Fig.3.N2 adsorption–desorption isotherms of the fresh samples.
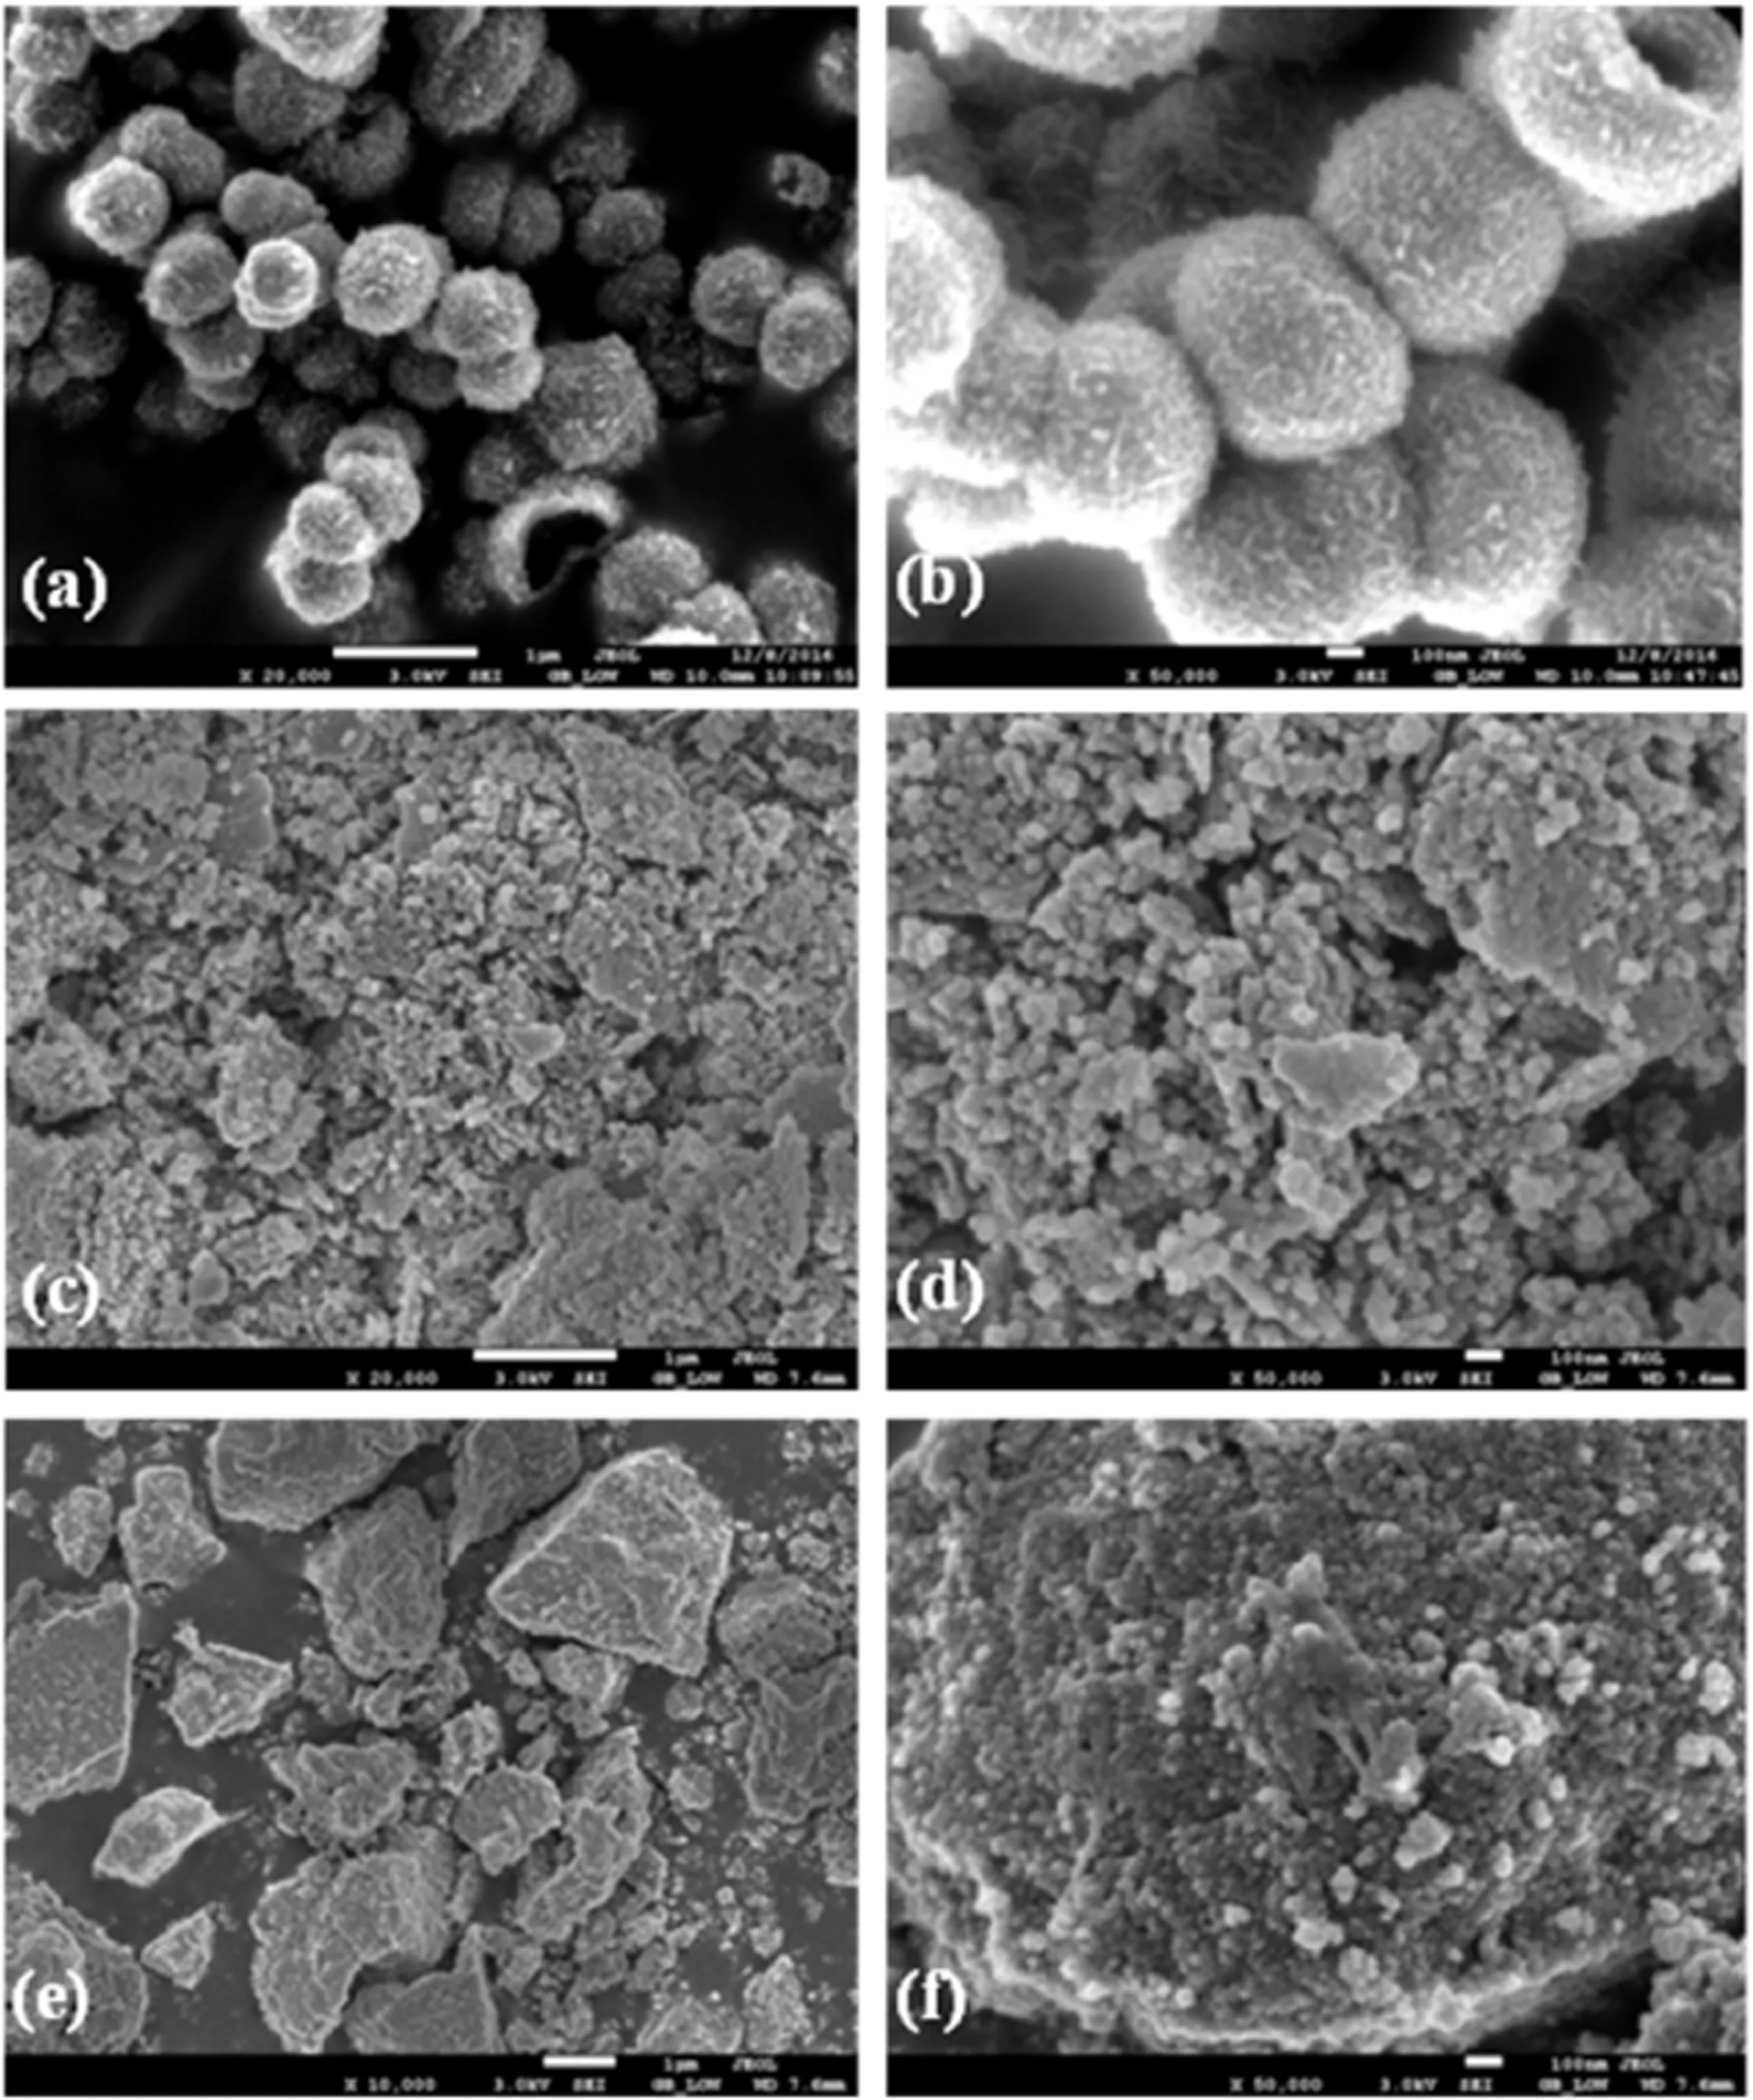
Fig.4.SEM photographs of the catalyst samples.(a),(b):S–2Fe–1Zn sample;(c),(d):H–2Fe–1Zn sample;(e),(f):C–2Fe–1Zn sample.
The pore parameters of fresh and used samples are summarized in Table 1.It can be seen that the fresh samples prepared by hydrothermalmethod and co-precipitation method lead to lowerspecific surface area.In contrast,solvothermal method has much larger specific surface area,and the specific surface areas of S–Fe–Zn/K catalyst samples are increased with increasing Fe/Zn ratio,however,the average pore diameter is changed little with varied Fe/Zn ratio.The surface area of all the used samples shows a great decrease and the average pore diameter is increased after reaction compared with that of the fresh samples,however,the surface area of sample C–2Fe–1Zn/K changes little before and after reaction.
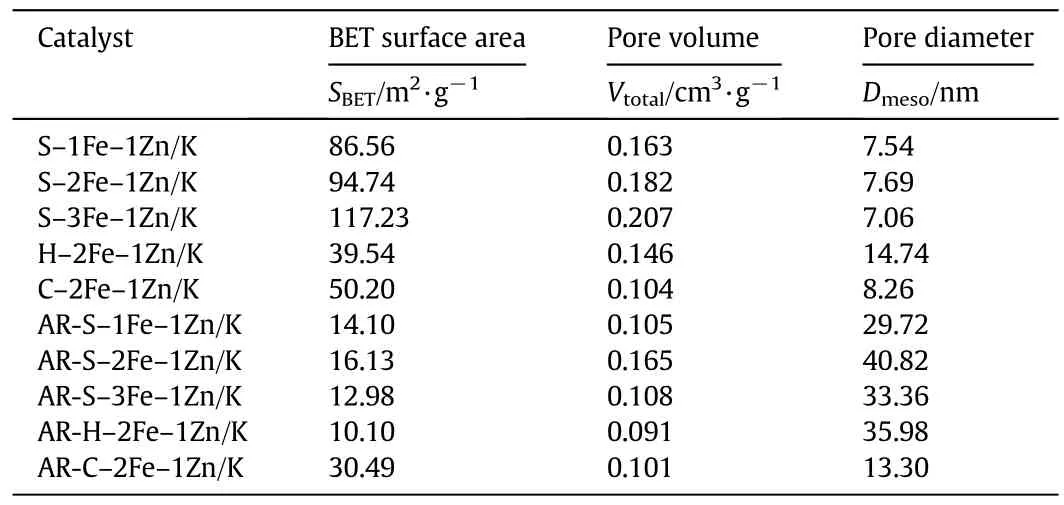
Table 1 Textural property of the fresh and used samples
3.3.Morphology of the fresh samples
Fig.4 shows the morphology of the catalyst samples before K promotion.It is obvious that the three preparation methods present distinct morphology.Fig.4(a)and(b)exhibits the hollow spheres of the S–2Fe–1Zn/Ksample with diameters around 500 nm.SEMimage recorded at high magnification clearly shows the perfect uniform sphere shape of the S–2Fe–1Zn/K samples,with nanosheets around the surface(Fig.4(b)).As shown in Fig.4(c)and(d),the microscopic morphology of H–2Fe–1Zn sample consists of small and uniformly shaped particles at about 50 nm in diameter.For C–Fe–1Zn sample(Fig.4(e)and(f)),the particlesformed by the agglomeration ofsmallcrystallize,are different and irregularly shaped and much smaller than that of H–2Fe–1Zn sample.
3.4.Reduction behavior of the samples
Fig.5 shows the H2-TPR profiles of the fresh samples.Differentpreparation methods formed different phases,which contributed to the discrepancy ofthe reduction behaviors.Samples prepared by solvothermal method and co-precipitation method are more easily reduced than that of H–2Fe–1Zn/K sample,possibly because of the formation of ZnFe2O4phase(see Fig.1).It was suggested that ZnFe2O4was reduced to Fe3O4at first,then from Fe3O4to FeO,and finally from FeO to Fe.This ZnFe2O4structure was prone to be reduced than Fe2O3,because ZnO is a typical semi-conductor,its existence in metal oxides promotes the reduction of metal oxides[30].Another reason is that smaller particles and nanosheets would be more easily reduced compared with larger particles,as revealed by SEM measurement(see Fig.4).In contrast,the first reduction peak of the sample H–2Fe–1Zn/K shifted to a higher temperature at about 400°C.Although the first reduction of Fe3O4to Fe3O4for H–2Fe–1Zn/K sample is harder than that of S–2Fe–1Zn/K and C–2Fe–1Zn/K sample,the reduction peak area is the largest.It can also be seen that the first reduction peak area is increased with an increase of the Fe/Zn ratio for S–Fe–Zn/K sample.The addition of K made a slight difference to the reduction temperature compared with that of S–2Fe–1Zn sample without K promotion.
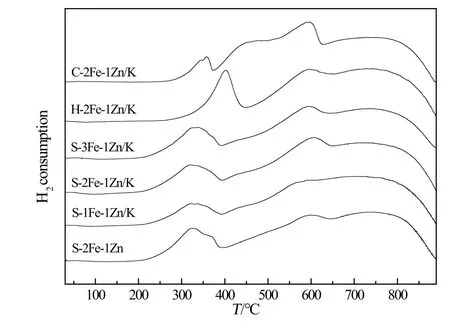
Fig.5.H2-TPR profiles of the catalyst samples.
3.5.Surface adsorption behavior of the catalyst samples
CO2-TPD was used to investigate the surface basicity of the catalysts after H2pretreatment and the curves are presented in Fig.6.The data suggest that the adsorption of CO2,which is related to surface basicity,is closely related to the preparation methods and Fe/Zn molar ratios.Four desorption peaks at around 50–100 °C,120–170 °C,500–580 °C and 600–800 °C could be observed.However,there is a significanteffect ofpreparation methodson the desorption profiles.The low temperature desorption peaks atabout75°Cforallthe samples with almostthe same peak area,is attributed to desorption of the weakly chemisorbed CO2[22].The desorption peak at 120–170 °C for C–2Fe–1Zn/K sample is significant compared with that of other samples.For S–Fe–Zn/K samples,with an increase of the Fe/Zn molar ratio,the peaks at 500–600 °C and 600–700 °C slightly shifted to lower temperatures and the CO2desorption amount is increased.By comparison,the desorption peak area of C–2Fe–1Zn/K(e)is dramatically increased at 500–600 °C(the sample was examined twice),illustrating that the surface basicity of the sample prepared by co-precipitation method is much more than that of the other two methods.More adsorption of CO2contributes to higher CO2conversion during CO2hydrogenation reaction.However,there is no prominent desorption peak at 500–600 °C for H–2Fe–1Zn/K sample and the higher desorption peak is the lowest.It can also be found that the catalyst samples by H2pretreatment shows a very different curve compared with H2/CO pretreatment sample by similar preparation method and with the same Fe/Zn molar ratio[23].

Fig.6.CO2-TPD of the fresh catalyst samples.
3.6.XPS measurement of the fresh and used catalysts
X-ray photoelectron spectroscopy(XPS)is used to characterize the surface chemical state of Fe Zn.The existence of Fe3+in the fresh Fe–Zn/K catalyst samples is evidenced by a shoulder observed on the main peak at 710.9 eV and 724.5 eV,respectively.Meanwhile,a distinct satellite peak at a binding energy 8 eV higher than the main Fe2p3/2peak could be observed at about 718.9 eV,which is assigned to Fe3+species[32].However,it is obvious that the preparation methods have great in fluence on the chemical environment of surface zinc and iron.The Fe2p spectra peaks for S–2Fe–1Zn/K and C–2Fe–1Zn/K fresh samples shift to higher binding energy at 711.4 eV compared with that of H–2Fe–1Zn/K catalyst at 710.9 eV as shown in Fig.7,and on the contrary,Zn2p spectra peaks shift to lower binding energy(see Fig.8),indicating a stronger interaction between iron oxide and zinc,due to the formation of ZnFe2O4when using the solvothermal method and co-precipitation methods,which is also proved by the results of H2-TPR and XRD measurements.These data indicate that the formation of ZnFe2O4changes the chemical environment of Fe and Zn[33].After reaction,carbon depositon the surface ofthe catalysts clearly attenuates the Fe2p signal,which is distinct on C–2Fe–1Zn/K catalyst sample(see Fig.8).The Fe2p peaks shift to lower binding energy at around 708.1 eV for allthe used samples.Although no signalforcarbidic carbon was fitted in the form of iron carbides on the catalyst surface after reaction(see Fig.8),in combination with XRD analysis for the used samples(see Fig.2)and the absence of satellite peak at 718.9 eV(see Fig.7),it can be concluded that iron species are reduced to Fe2+and partially carburized during reaction.

Fig.7.Fe(2p)XPS spectra of the catalyst samples.

Fig.8.C(1S)XPS spectra of the catalyst samples.
For Zn2p spectra in Fig.9,the two sharp peaks located at 1022.4 and 1045.6 eV are corresponding to the Zn 2p3/2and Zn2p1/2levels[34].Distinct decrease of zinc binding energy of the S–2Fe–1Zn/K and C–2Fe–1Zn/K catalysts suggests that there are synergistic effects on the interaction between iron and zinc due to the formation of ZnFe2O4as discussed above.For the used C–2Fe–1Zn/K catalyst sample,Zn(2d)peaks shift toward higher position compared with that of the fresh sample,indicating a decrease in electron density around Zn,however,a little decrease in binding energy can be observed for the H–2Fe–1Zn/K used sample.

Fig.9.Zn(2p)XPS spectra of the catalyst samples.
The surface composition of the catalyst samples is shown in Table 2.The surface Fe/Zn ratio of the fresh and used samples was calculated.It was found that the surface molar ratios of Fe/Zn for all the samples are lower than that of the preparation ratios.A Fe/Zn ratio of about 1.58 on the catalyst sample prepared by solvothermal method is relativelyclose to the initial feed ratio 2/1.The Fe/Zn and Fe/K ratios for all the used samples are lower than that of the fresh samples,revealing that Zn and K are enriched after reaction.Carbon deposit was remarkable on used C–2Fe–1Zn/K catalyst as discussed in Fig.7.

Table 2 Surface compositions the fresh and used samples
3.7.Catalytic activity
The catalytic performances of the samples during CO2hydrogenation reaction are evaluated at320°C,2.0 MPa and 1000 h-1.The above discussion has shown thatpreparation methods make obvious difference on the properties ofcatalytic phase structure,adsorption ordesorption behavior,reduction and surface composition of the catalysts.Apparently,these changes bring out the diversities on catalytic performance over different catalysts.Itcan be seen thatallthe catalysts show good activity and ole fin selectivity.The CO2conversion is dramatically increased over S–Fe–Zn/K samples with increasing Fe/Zn ratio,because of the increase of Fe3O4active sites for RWGS reaction as shown in the H2-TPR measurement in Fig.5.Also,the hydrothermal method results in good dispersion of iron species over H–2Fe–1Zn/K sample allowing for higher CO2conversion[33].The CO2conversion is the highest in all tested samples,maybe due to the strong surface basicity in C–2Fe–1Zn/K catalyst,causing higher CO2adsorption and thus higher CO2conversion.As zinc promoter has been demonstrated to be highly active in both the WGS and RWGS reactions[23,35,36],the CO selectivity in the production distribution over S–Fe–Zn/K samples is obviously increased with increasing Zn content.The difference in the product distribution maybe caused by the different contents of Zn phase during CO2hydrogenation reaction as discussed above.The activity of C–2Fe–1Zn/K catalyst sample with time on stream for CO2hydrogenation is shown in Fig.10.It is clear that the catalyst showed excellent stability along with 144 h time on stream,suggesting that zinc phase proves to be able to stabilize the surface active sites for FTS[14],and then improves the stability ofthe catalysts.Detailed data of catalytic activity is shown in Table 3 for the samples.

Fig.10.Catalytic activity over C–2Fe–1Zn/K with TOS.

Table 3 Catalytic activity of the samples for CO2 hydrogenation
4.Conclusions
The effect of preparation methods on the structure and catalyst activity of Fe–Zn/K catalysts was studied for CO2hydrogenation.Different preparation methods made the physicochemical properties of the catalyst own an obvious distinction to the structure of the catalysts so as to alter the catalytic performance.The samples prepared by different methods and various Fe/Zn ratios showed different structures for the fresh and used samples.ZnFe2O4phase transforms into Fe3O4after in situ H2reduction before reaction.Active phases Fe3O4for RWGS reaction and Fe5C2for FTS were formed during reaction.The adsorption behaviorofCO2,which is related to surface basicity,is closely related to the preparation methods and Fe/Zn molar ratio.Also,the preparation methods had great in fluence on the chemical environment of surface zinc and iron.The formation of ZnFe2O4on S–2Fe–1Zn/K and C–2Fe–1Zn/K samples,proved by the results of H2-TPR and XRD measurements,increased the interaction between iron and zinc.For the used C–2Fe–1Zn/K catalyst sample,Zn(2d)peaks shift toward higher position compared with the fresh sample,indicating a decrease in electron density around Zn and may be correlated with the formation ofless ZnOphase during reaction.DifferentcontentofZnOphase is possibly one of the importantreasons for the differences in the productdistribution.S–2Fe–1Zn/K catalystdisplayed the highestselectivity of light ole fins with highest O/P of 6.84 for all the samples.C–2Fe–1Zn/K catalyst showed high activity and C2=–C4=content for the hydrogenation of CO2to light ole fins with CO2conversion of 54.76%and C2=–C4=contentof 57.38%.Moreover,the selectivity of CO was reduced to 4.58%.
References
[1]J.Hansen,D.Johnson,A.Lacis,S.Lebedeff,P.Lee,D.Rind,G.Russell,Climate impact of increasing atmospheric carbon dioxide,Science 213(4511)(1981)957–966.
[2]K.Caldeira,A.K.Jain,M.I.Hoffert,Climate sensitivity uncertainty and the need for energy without CO2emission,Science 299(5651)(2003)2052–2054.
[3]C.G.Visconti,M.Martinelli,L.Falbo,A.Infantes-Molina,L.Lietti,P.Forzatti,G.Iaquaniello,E.Palo,B.Picutti,F.Brignoli,CO2hydrogenation to lowerole fins on a high surface area K-promoted bulk Fe-catalyst,Appl.Catal.B Environ.200(2017)530–542.
[4]S.Saeidi,N.A.S.Amin,M.R.Rahimpour,Hydrogenation of CO2to value-added products— A review and potential future developments,J.CO2Util.5(1)(2014)66–81.
[5]M.Mikkelsen,A review of fixation and transformation of carbon dioxide,Energy Environ.Sci.3(1)(2009)43–81.
[6]H.Yang,Z.Xu,M.Fan,R.Gupta,R.B.Slimane,A.E.Bland,I.Wright,Progress in carbon dioxide separation and capture:A review,J.Environ.Sci.20(1)(2008)14–17.
[7]S.K.Hoekman,A.Broch,C.Robbins,R.Purcell,CO2recycling by reaction with renewably-generated hydrogen,Int.J.Greenhouse Gas Control 4(1)(2010)44–50.
[8]J.Kemper,Biomass and carbon dioxide capture and storage:Areview,Int.J.Greenhouse Gas Control 40(2015)401–430.
[9]J.Wei,Q.Ge,R.Yao,Z.Wen,C.Fang,L.Guo,H.Xu,J.Sun,Directly converting CO2into a gasoline fuel,Nat.Commun.8(2017)15174,https://doi.org/10.1038/ncomms15174.
[10]P.Gao,S.Li,X.Bu,S.Dang,Z.Liu,H.Wang,L.Zhong,M.Qiu,C.Yang,J.Cai,W.Wei,Y.Sun,Direct conversion of CO2into liquid fuels with high selectivity over a bifunctional catalyst,Nat.Chem.9(2017)1019–1024.
[11]D.Mattia,M.D.Jones,J.P.O'Byrne,O.G.Grif fiths,R.E.Owen,E.Sackville,M.McManus,P.Plucinski,Towards carbon-neutral CO2conversion to hydrocarbons,ChemSusChem 8(23)(2015)4064–4072.
[12]M.Albrecht,U.Rodemerck,M.Schneider,M.Bröring,D.Baabe,E.V.Kondratenko,Unexpectedly efficient CO2hydrogenation to higher hydrocarbons over nondoped Fe2O3,Appl.Catal.B Environ.204(2016)119–126.
[13]T.Herranz,S.Rojas,F.J.Pérez-Alonso,M.Ojeda,P.Terreros,J.L.G.Fierro,Hydrogenation of carbon oxides over promoted Fe–Mn catalysts prepared by the microemulsion methodology,Appl.Catal.A Gen.311(1)(2006)66–75.
[14]T.Ishihara,K.Eguchi,H.Arai,Hydrogenation of carbon monoxide over SiO2-supported Fe–Co,Co–Ni,and Ni–Fe bimetallic catalysts,Appl.Catal.18(51)(1987)225–238.
[15]S.Li,A.Li,S.Krishnamoorthy,E.Iglesia,Effects of Zn,Cu,and K promoters on the structure and on the reduction,carburization,and catalytic behavior of iron-based Fischer–Tropsch synthesis catalysts,Catal.Lett.77(4)(2001)197–205.
[16]R.W.Dorner,D.R.Hardy,C2–C5+ole fin production from CO2hydrogenation using ceria modi fied Fe/Mn/K catalysts,Catal.Commun.15(1)(2011)88–92.
[17]J.Zhang,S.Lu,S.Fan,T.Zhao,K.Zhang,Hydrothermal preparation of Fe–Mn catalyst for light ole fin synthesis from CO hydrogenation,Nano Rep.1(2015)15–19.
[18]F.Tihay,A.C.Roger,G.Pourroy,A.Kiennemann,Role of the alloy and spinel in the catalytic behavior of Fe–Co/cobalt magnetite composites under CO and CO2hydrogenation,Energy Fuel 16(5)(2002)1271–1276.
[19]A.A.Mirzaei,R.Habibpour,E.Kashi,Preparation and optimization of mixed iron cobalt oxide catalysts for conversion of synthesis gas to light ole fins,Appl.Catal.A Gen.296(2)(2005)222–231.
[20]S.A.Gardezi,J.T.Wolan,B.Joseph,Effect of catalyst preparation conditions on the performance of eggshell cobalt/SiO2catalysts for Fischer–Tropsch synthesis,Appl.Catal.A Gen.447–448(24)(2012)151–163.
[21]S.L.Soled,E.Iglesia,S.Miseo,Bruce A.DeRites,Rocco A.Fiato,Selective synthesis of alpha-ole fins on Fe–Zn Fischer–Tropsch catalysts,Top.Catal.2(1)(1995)193–205.
[22]H.Wang,Y.Yang,J.Xu,H.Wang,M.Ding,Y.Li,Study of bimetallic interactions and promoter effects of FeZn,FeMn and FeCr Fischer–Tropsch synthesis catalysts,J.Mol.Catal.A Chem.326(1)(2010)29–40.
[23]J.Zhang,S.Lu,X.Su,S.Fan,Q.Ma,T.Zhao,Selective formation of light ole fins from CO2hydrogenation over Fe–Zn–K catalysts,J.CO2Util.12(10)(2015)95–100.
[24]P.Zhai,C.Xu,R.Gao,X.Liu,M.Li,W.Li,X.Fu,C.Jia,J.Xie,M.Zhao,X.Wang,Y.Li,Q.Zhang,X.Wen,D.Ma,Highly tunable selectivity for syngas-derived alkenes over zinc and sodium-modulated Fe5C2catalyst,Angew.Chem.Int.Ed.55(34)(2016)10056–10061.
[25]J.Abbott,N.J.Clark,B.G.Baker,Effects of sodium aluminium and manganese on the Fischer–Tropsch synthesis over alumina-supported iron catalysts,Appl.Catal.26(1–2)(1986)141–153.
[26]A.P.Raje,R.J.O'Brien,B.H.Davis,Effect of potassium promotion on iron-based catalysts for Fischer–Tropsch synthesis,J.Catal.180(1)(1998)36–43.
[27]Y.Yang,H.W.Xiang,Y.Y.Xu,L.Bai,Y.W.Li,Effect of potassium promoter on precipitated iron–manganese catalyst for Fischer–Tropsch synthesis,Appl.Catal.A Gen.266(2)(2004)181–194.
[28]X.An,B.S.Wu,H.J.Wan,T.Z.Li,Z.C.Tao,H.W.Xiang,Y.W.Li,Comparative study of iron-based Fischer–Tropsch synthesis catalyst promoted with potassium or sodium,Catal.Commun.8(12)(2007)1957–1962.
[29]X.Zhou,X.Li,H.Sun,P.Sun,X.Liang,F.Liu,X.Hu,G.Lu,Nanosheet-assembled ZnFe2O4hollow microspheres for high-sensitive acetone sensor,ACS Appl.Mater.Interfaces 7(28)(2015)15414–15421.
[30]M.Liang,W.Kang,K.Xie,Comparison of reduction behavior of Fe2O3,ZnO and ZnFe2O4by TPR technique,J.Nat.Gas Chem.18(1)(2009)110–113.
[31]K.S.W.Sing,D.H.Everett,R.A.W.Haul,L.Moscou,R.A.Pierotti,J.Rouquerol,T.Siemieniewska,Reporting physisorption data for gas/solid systems with special reference to the determination of surface area and porosity(Recommendations 1984),Pure Appl.Chem.57(4)(1985)603–619.
[32]T.Yamashita,P.Hayes,Analysis of XPS spectra of Fe2+and Fe3+ions in oxide materials,Appl.Surf.Sci.254(8)(2008)2441–2449.
[33]X.Gao,J.Zhang,N.Chen,S.Fan,Q.Ma,T.Zhao,N.Tsubaki,Effects ofzinc on Fe-based catalysts during the synthesis oflightole fins fromthe Fischer–Tropsch process,Chin.J.Catal.37(4)(2016)510–516.
[34]X.Min,B.Zhou,Y.Ke,L.Chai,K.Xue,C.Zhang,Z.Zhao,C.Shen,Sul fidation behavior of ZnFe2O4roasted with pyrite:Sulfur inducing and sulfur–oxygen interface exchange mechanism,Appl.Surf.Sci.371(2016)67–73.
[35]T.Shido,Y.Iwasawa,Reactant-promoted reaction mechanism for water–gas shift reaction on ZnO,as the genesis of surface catalysis,J.Catal.129(2)(1991)343–355.
[36]M.Saito,J.Wu,K.Tomoda,I.Takahara,K.Murata,Effects ofZnOcontained in supported Cu-based catalysts on their activities for severalreactions,Catal.Lett.83(1)(2002)1–4.
 Chinese Journal of Chemical Engineering2018年4期
- Chinese Journal of Chemical Engineering的其它文章
- An innovative design of septic tank for wastewater treatment and its performance evaluation:An applicable model for developing countries
- Oil field produced water treatment in internal-loop airlift reactor using electrocoagulation/ flotation technique
- From pollutant to solution of wastewater pollution:Synthesis of activated carbon from textile sludge for dye adsorption
- 17α-Ethinylestradiol removal from water by magnetic ion exchange resin☆
- Transesteri fication of sun flower oil in microchannels with circular obstructions
- The extraction of potassium from K-feldspar ore by low temperature molten salt method☆