Density,refractive index and liquid–liquid equilibrium data of polyethylene glycol 3000+potassium formate+water at different p H values
Fatemeh Ahmadi,Mohsen Pirdashti*,Abbas Ali Rostami*
Chemical Engineering Department,Faculty of Engineering,Shomal University,PO Box 731,Amol,Mazandaran,Iran
1.Introduction
One method of preparing an aqueous two-phase system(ATPS)is to use an aqueous solution which is immiscible at specific concentrations of polymer–polymer,salt–salt and polymer–salt molecular compounds[1].ATPS was first investigated by Beijerinck[2].Albertsson later investigated other aspects of ATPS,including its use in biomolecule purification(such as proteins)and cell particles[3].Studies have reported on the merits of employing the conventional method of ATPS.These include faster processing and shorter time[4],economical affordability and low material costs[5,6],low energy consumption,non-toxicity and being environmentally friendly[7,8].
ATPS is a more efficient,powerful and flexible method to decontaminate and isolate biomolecules than alternative methods using different compounds[9–11].Vernau and Kula[12]found that ATPS effects the separation of biomolecules,including the mass of the molecules,physical properties of the polymer(hydrophobicity),type of salt and its selection,polymer system composition,p H level,temperature and distance from the stationary point.Polyethylene glycol(PEG)has used been in studies because it is affordable,is non-poisonous,burns quickly and is straightforward to control.
Inorganic salts can be used to create ATPS with PEG phosphates.Commonly-used ones are sulfates of sodium,potassium,and ammonium salts[13].The use of the sesaltson the largescalecan cause environ mental problems[14,15].Potassium formate(K+CHOO−)is the potassium salt of formic acid(CHOOH).It rapidly dissolves in water and is present as potassium cations(K+)and formate anions(CHOO−),which are very mobile in an aquatic environment.The negative effects of formate on the environment include oxygen consumption from microbial degradation,subsurface denitrification,manganese,iron and sulfate reduction and methanogenesis as well its effect on perennial plants[16].It is widely used in the oil-drilling industry and indirect refrigeration systems as a secondary refrigerant[17],as an ice-removal agent in airport runaways and road maintenance[16],as an additive to modified triethylene glycol[18],in air-cooled absorption chillers[19],as a sustainable green hydrogen source in an organic transformation[20],as a palladium catalyst[21]and as a catalyst of ruthenium encapsulated in an aluminum oxyhydroxide-support[22].
Formates are organic anions that can be used to produce an ATPS showing better performance with regard to environmental and toxicity issues.Some researchers have found formates as a different substance for creating an ATPS with PEG because they can prevent pollution and virulent disease and can be successfully used in biological wastewater treatment plants[23–26].Little experimental data(PEG+water+formate)is available,however,and there are many research opportunities when working on this system.Lladosa et al.[27]reported on UCON 50-HB-5100+potassium formate+water systems as measured at 298.15 K.Silverio et al.[26,14]characterized PEGs with different molecular mass(1500 and 8000)when combined with potassium phosphate.
Our previous study[28]reported on data derived from the binodal curves and tie-lines of PEG 3000+trisodium citrate+water systems at 298.15 K and different p H values.In the current study,phase equilibrium data for PEG 3000+potassium formate ATPS was determined at 298.15 K and p H levels of 7.95,8.40 and 9.98.The binodal curves and tie-line lengths(TLLs)satisfactorily correlated.The PEGand salt compositions were then analyzed using calibration curves and the effects of p H on the binodal curve and TLL and slope of the tie-line(STL)were examined.The experiment was processed at low temperatures as an important condition for protein stability.
2.Experimental
2.1.Materials
PEG with a mass average of 3000 g·mol−1and sodium hydroxide(NaOH;mass purity>0.99%)were obtained from Merck(Germany)and used without further purification.Potassium formate(KCHO2;purity pa>99.0 wt%)was supplied by Sigma-Aldrich(Darmstadt,Germany).Distilled deionized water(conductivity=17.8 μS·cm−1)was used to prepare the solutions.All chemicals were dried for at least 24 h(433.15 K for salts and 313.15 K for polymers)to eliminate the adsorbed water.
2.2.Apparatus and procedure
2.2.1.Analytical method
The compositions in both phases were obtained by measuring the physical properties of refractive index(nD)and density(ρ)of binary(PEG 3000+water,potassium formate+water)and ternary(PEG 3000+potassium formate+water)systems at 298.15 K using a CETI refractometer(Belgium)with an accuracy of 0.0001 nDand using an Anton Paar oscillation U-tube densimeter(model:DMA 500,Austria)with a precision of±10−4g·cm−3.The calibration equations were calculated beforehand.Duplicate data measurement was employed and the average values of the parameters were reported.This data was correlated using Eq.(1)as:

where Z denotes the physical properties(density or refractive indices),wpdenotes the mass fraction of the polymer,wsdenotes the mass fraction of the salt and the fitting parameters are denoted by a0to a5.The density and refractive indices of the PEG 3000+potassium formate+water systems are shown in Table S1.A practical approach employed for determination of the phase composition of PEG–salt ATPS is shown in Fig.1.
2.2.2.Binodal curve
The titration method was selected to ascertain the binodal curves[29].To achieve the cloud point,titration was conducted by adding the polymer(titrant)to salt solutions of specific concentrations.A binary solution of potassium formate(50%w/w)and PEG 3000(50%w/w)was prepared.The salt solution was prepared and titrated against the polymer.Special care was taken when adding the salt solution drop wise continuously to reach turbidity so as to determine the end point.To remove the turbidity,water was added over a period of time.The same method was used to obtain the other binodal.An appropriate ratio of potassium formate to sodium hydroxide was mixed so that the p H values of the salt solutions could be accurately adjusted using a p H meter(827 p H;Metrohm;Switzerland).
2.2.3.TLL and STL
The tie lines were obtained using the equilibrium set designed based on previously described procedures[30].Four samples were selected at each p H.Adequate amounts of PEG,salt stock and water were mixed in 15 ml graduated cylindersat 298.15 Kto prepare10 g of feed samples using an analytical balance(A&D;model GF300;Japan)with an accuracy of±10−4g.Appropriate ratios of potassium formate and sodium hydroxide were mixed so that the p H values of the salt stock could be accurately adjusted using a p H meter.
The samples were stirred for 10 min and settled in a thermostatic bath(Memmert;model INE400;Germany)to keep the temperature constant at±1 K and allow the mixtures to settle for 24 h.The tubes were spun in a Hermle Z206A centrifuge(Germany)at 6000g for 10 min to separate the phases,which showed no turbidity or difficulty discerning the top and bottom of the samples.After the achievement of equilibrium,syringes were used to with draw the phases.Accordingly,the top phase was sampled first,with care beingtaken to leave alayer of material at least 0.5 mm thick above the interface.The bottom phase remained in the glass vessel and wasremoved with alongneedle.To determine the concentration of polymer and salt,the physical properties(density and refractive index)of the top and bottom phases were measured.The TLL was obtained using Eq.(2),which presents an observational measurement of the compositions in the two phases.
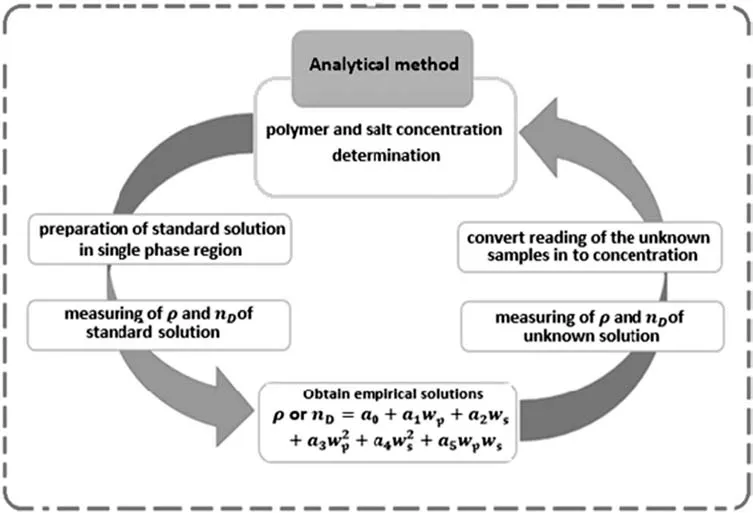
Fig.1.Practical approach for determination of phase composition and binodal curve of PEG–salt ATPS.

The STL was obtained using Eq.(3)as the ratio of the difference in the mass fraction of polymer and salt in both the top and bottom phases.wiis the mass fraction of the PEG and salt and top and bot denote the top and bottom phases,respectively.

2.2.4.Binodal curve and TLL correlation
The Pirdashti equation[28]is appropriate for recreation of the binodal curves of the systems investigated for binodal data correlation as:

where a,b,and c denote the fitting parameters and wpand wsdenote the mass fraction of the polymer and salt,respectively.The binodal data of this expression was correlated using least-squares regression.
The Othmer–Tobias[31](Eq.(5)),Bancroft[32](Eq.(6))and Hand[33](Eq.(7))correlations were used to control and ensure the reliability and consistency of the data derived from the tie-line.
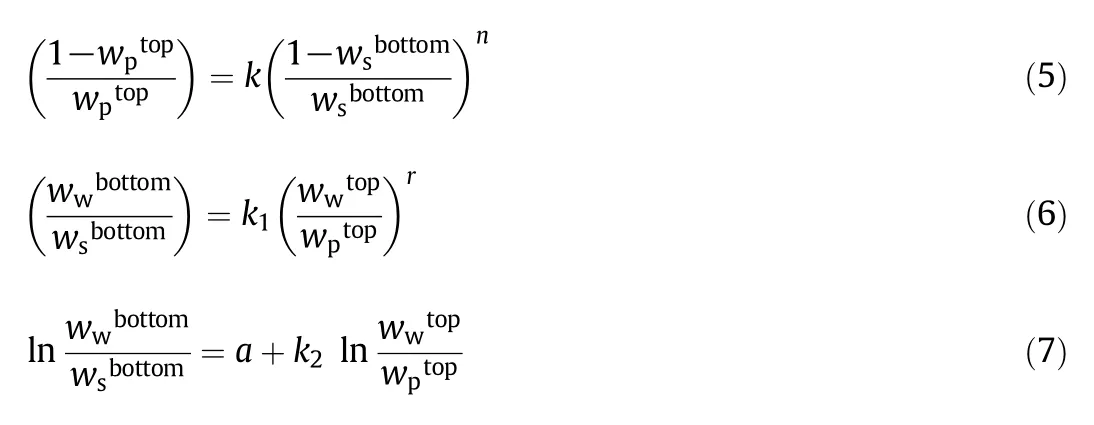

Table 1 Values of coefficients obtained from Eq.(1)
where k,n,k1,and r denote the adjusted parameters.This experimental data can also be adapted to the equation provided by Guan et al.[34]as:

where M denotes the representative molecular mass(g·mol−1)and V∗denotes the effective excluded volume(EEV)of the PEG[35,36].
Next,a simple two parameter equation was used to correlate the LLE data[34]:

where b and k are fitting parameters that can be regarded as effective virial(or active)coefficients and the salting-out coefficient of the salt,wiis the mass fraction of the PEG and salt and top and bot denote the top and bottom phases,respectively.
3.Results and Discussion
3.1.Fitting parameters of calibration equation
Table 1 shows the coefficients having the nominal values of a0,a1,a2,a3,a4.,and a5from Eq.(1).The refractive index and density of pure water at 298.15 K were 1.3323 and 0.9962,respectively.The average absolute relative deviation in this concentration range was 0.0058%for the refractive index and 0.03%for the density.
3.2.Binodal curve
The binodal experimental data plotted in Fig.2 are shown in Table 2.
Fig.2 shows the effect of p H on the binodal curve of the PEG 3000+potassium formate ATPS at p H values of 7.95,8.40 and 9.98 at 298.15 K.The two-phase area broadened as the p H increased and the binodal displacement descended as the moderate p H increased.Such displacement indicates the need for lower concentrations of phase polymers for ATPS formation.Previous studies have reported similar results[37–39].
The functions of p H are solute charging,charging the species ratio and binodal location[40].Sadeghiand Jamehbozorg[41]increased the p H and observed a behavior known as “salting-out”after studies of salt in water.One outcome of this phenomenon is a decrease in the interaction hydrogen-bond.Reasons for this could be the decrease in hydration and the solubility of the polymer because of the greater attraction of salt ions to water over the polymer[42].The polymer can be eliminated from the solution as an outcome of this process[39].
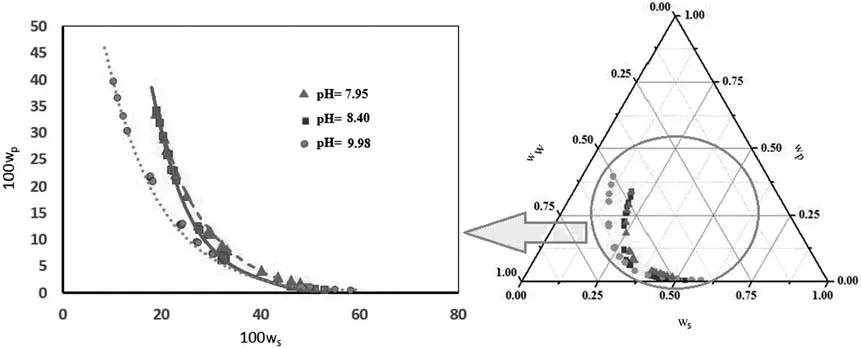
Fig.2.Phase diagram of PEG(3000)+potassium formate(KCHO2)+H2O(3)two-phase system at T=298.15 K and p H values of 7.95(),8.40()and 9.98()experimental binodal.The solid curves represent the empirical model.

Table 2 Binodal curve data of PEG 3000+potassium formate water system at 298.15 K for different p H values
The data in Table 3 shows that the PEG concentration of the top phase increased as the salt composition increased at a constant PEG molecular mass.The ability of salt to increase the water structure can explain this.A decrease occurs in hydration and PEG solubility because of the stronger attraction of salt ions to water than PEG.Eventually hydrophilic PEG is salted separately and is removed from the remnant of the solution at a specific concentration.This means that the absorption of PEG and water decreased and in the two-phase system of PEG and salt,water was driven from the PEG-rich phase to the saltrich phase.This increased the PEG concentration of the PEG-rich phase and somewhat diluted the salt-rich phase(the salt concentration decreased)and the volume of the salt-rich phase increased at the expense of the PEG-rich phase[41–43].
Fig.3 shows this binodal as compared with previous studies[14,15,26].When the molecular mass of the PEG increased,biphasic formation occurred at lower concentrations of polymer and salt.Larger heterogeneous regions were observed for PEG 8000–salt than for PEG 600–salt ATPSs.This was to be expected because as the polymer molecular mass increased,hydrophobicity increased and water solubility decreased,leading to polymer salting-out.Because the density also increased and the differences in the binodals were not significant,systems with PEG 600 and 8000 are potentially valuable for extraction purposes,mainly for the separation of target solutes.A lower density can have a positive effect on which PEG should be used.
3.3.TLL and STL
Table 3 shows the composition of the tie-line in the form of plots in Figs.4 and 5.The binodal curve for the PEG+potassium formate+water system at 298.15 K is also provided.
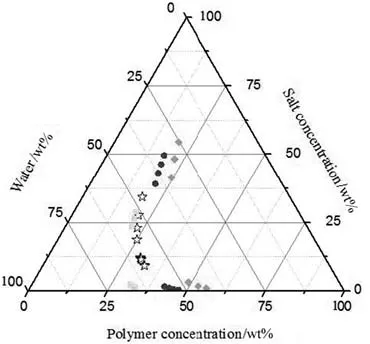
Fig.3.Experimental binodal curves for PEG 3000+potassium formate+water()compared to PEG 600+potassium formate+water()[26],PEG 1500+potassium formate+water()and PEG 8000+potassium formate+water()[14]at 298.15 K.
The tie-lines were obtained through correlation with each resulting set of phase compositions( final,top and bottom).Moreover,there are simultaneous phases in the composition.A bulk balancing test was conducted by initially considering the amount of the mass per phase for the top and bottom on the basis of equilibrium compounds.Volume and density measurements were used to calculate the mass of each phase.The error of the mass balance was less than<2%.Table 3 shows that an increase in p H increased the TLL and decreased the STL.
The effects of p H on the equilibrium phase composition,TLL and STL are shown for the PEG 3000+potassium formate+water system in Table 3 and Figs.4 and 5.The STL values were not constant and slight variations can be observed for the different tie-lines of a given ATPS.It was found that the absolute value of the STL decreased as the TLL increased in this system when the p H level increased,which may bebecause of the reduction in the solution hydrodynamic volume.Comparable conduct has been shown in previous studies[14,15,26,37,44].Waziri et al.[45]and Shahbazinasab and Rahimpour[37]reported a decrease in the intrinsic viscosity of the polymer solution with a decrease in p H.

Table 3 Phase composition,tie-line data and physical properties of PEG 3000+potassium formate+water ATPS at 298.15 K and 0.1 MPa
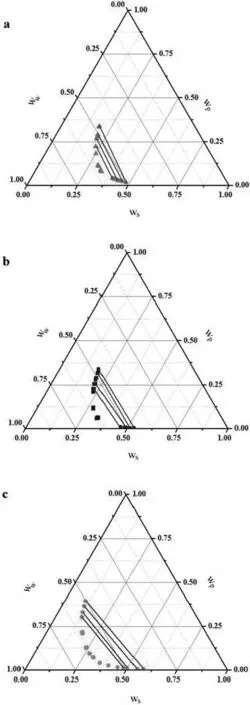
Fig.4.Phase diagram and tie-line of PEG+potassium formate+water ATPS at T=298.15 K and:(a)p H 7.95;(b)p H 8.40;(c)p H 9.98.
Note that a decrease in p H modified the polymer chains,making their structure more compact,because the intrinsic viscosity of a polymer solution was proportional to its hydrodynamic volume.Studies have shown that the concentrations of the PEG and salt-rich phases increase and decrease,respectively,following an increase in the p H of the aqueous two-phase PEG–salt system.Once more,the polydispersity of the PEG could be the main reason for this[14].The current study also examined the effects of TLL on the difference in density between the phases(Δρ)of the ATPSs.Table 3 and Fig.6 show that the Δρ increased as the TLL and p H increased.The Δρ between the phases shows a linear relationship with TLL.Similar results have been reported in previous studies[38,44,46–49].
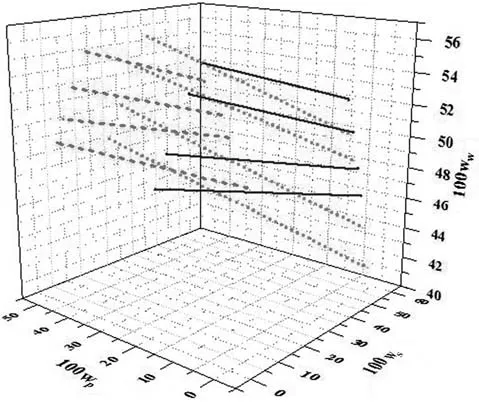
Fig.5.Tie-line of PEG(3000)+potassium formate+H2O ATPS at T=298.15 K and p H values of 7.95,8.40 and 9.98.Experimental tie line:()p H 7.95;()p H 8.40;()p H 9.98.
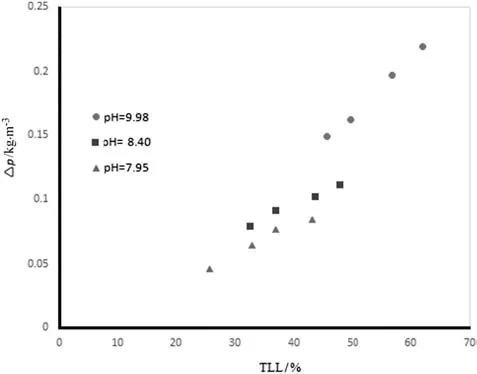
Fig.6.Relationship between Δρ and TLL for PEG 3000+potassium formate+water at different p H values.
3.4.Binodal curve and tie-line data correlation
Table 4 provides the coefficients of Eq.(4)with the resulting standard deviations of the systems.

Table 4 Values of para meters in Eq.(3)for PEG3000+potassium formate+water at different p H values

Table 5 Values of parameters in Eqs.(5),(6)and(7)for PEG 3000+potassium formate+water at different p H values
The standard deviations indicate that Eq.(4)could be used to correlate the binodal curves of the studied systems.The binodal curves indicate model reliability.The tie-line compositions for PEG 3000+potassium formate+water were correlated using the Othmer–Tobias(Eq.(5)),Bancroft(Eq.(6))and Hand(Eq.(7))equations,which were perfectly practiced in previous systems containing polymer–salt molecular compounds.Table 5 shows the parameter values obtained from the results.
V*denotes the EEV of PEG.Nonlinear regression was used to calculate the EEV(Table 6).Although the performance of this model wasworse than for the Pirdashti equation,it has a more powerful the oreticalbackground(statistical geometry),enabling better measurement of the salting-out effect of the different salts.Apart from this contradictory feature,both models have been adopted for correlation of the binodal data from the polymer/polymer and polymer/salt ATPSs[14,34,36].

Table 6 EEV parameter correlation
Linear regression was used to find the values for b and k in Eq.(9).The fitted parameters are shown in Table 7.

Table 7 Fitting parameter for Eq.(9)and statistics of regression
4.Conclusions
The current study provides newfindings on the use of liquid–liquid equilibrium datafor PEG3000+potassium formate+water systemsat p H values of 7.95,8.40,and 9.98 at 298.15 K.Although reliable and valid data on the composition and system properties are necessary to design the extraction process,such data is inaccessible.A direct relationship was found between two-phase area expansion and an increase in p H,and is likely caused by the effect of salting-out.An increase in p H decreased the slope of the equilibrium tie-lines,while the lengths of tielines increased in the biphasic system.This may bebecause of adecrease in solution hydrodynamic volume.The calibration method was applied to measure the refractive index and density of the phases.The experimental binodal data for all investigated systems satisfactorily correlated with the Pirdashti equation and the tie-line compositions were fitted to the Othmer–Tobias,Hand and Bancroft equations.The difference in density between the phases increased as the tie-line length and p H increased.It was found that tie line length and difference in density between phases vary linearly.Moreover,EEV increased following an increase in p H.PEG 3000+potassium formate at a p H of 9.98 was the ATPS with the largest EEV and heterogeneous region.
Supplementary Material
Supplementary data to this article can be found online at https://doi.org/10.1016/j.cjche.2017.07.003.
[1]P.A.Albertsson,Aqueous Polymer-phase Systems,Wiley,New-York,1986.
[2]M.W.Beijerinck,Über eine Eigentümlichkeit der löslichen Stärke,Centr-Bl.f.Bakter.u,Parasitenk 2(1)(1896)698–699.
[3]P.A.Albertsson,Partition of Cell Particles and Macromolecules,Wiley,New-York,1986.
[4]R.Hu,X.Feng,P.Chen,M.Fu,H.Chen,L.Guo,B.Liu,F.Rapid,Highly efficient extraction and purification of membrane proteins using a micro fluidic continuous- flowbased aqueous two-phase system,J.Chromatogr.A 1218(1)(2011)171–177.
[5]G.D.Rodrigues,L.D.Teixeira,G.M.D.Ferreira,M.D.H.da Silva,L.H.M.da Silva,R.M.M.de Carvalho,Phase diagrams of aqueous two-phase systems with organic salts and f68 triblock copolymer at different temperatures,J.Chem.Eng.Data 55(9)(2010)1158–1165.
[6]P.A.Rosa,A.M.Azevedo,S.Sommerfeld,W.Bäcker,M.R.Aires-Barros,Aqueous two phase extraction as a platform in the biomanufacturing industry,economical and environmental sustainability,Biotechnol.Adv.29(6)(2011)559–567.
[7]I.S.B.do Nascimento,J.S.dos Reis Coimbra,J.P.Martins,L.H.M.da Silva,R.C.F.Bonomo,M.R.Pirozzi,A.Cinquini,Partitioning of glutenin flour of special wheat using aqueous two-phase systems,J.Cereal Sci.52(2)(2010)270–274.
[8]M.Yavari,G.R.Pazuki,M.Vossoughi,S.A.Mirkhani,A.A.Seifkordi,Partitioning of alkaline protease from Bacillus licheniformis(ATCC 21424)using PEG–K2HPO4aqueous two-phase system,Fluid Phase Equilib.337(1)(2013)1–5.
[9]Y.Lu,Selective extraction and purification of papain using polyethylene glycol(PEG 4000)/potassium citrate aqueoustwo phase,Asian J.Chem.26(12)(2014)3483–3488.
[10]L.Yang,D.Huo,C.Hou,K.He,F.Lv,H.Fa,X.Luo,Purification of plant-esterase in PEG1000/NaH2PO4aqueous two-phase system by a two-step extraction,Process Biochem.45(10)(2010)1664–1671.
[11]Y.M.Lu,Y.Z.Yang,X.D.Zhao,C.B.Xia,Bovine serum albumin partitioning in polyethylene glycol(PEG)/potassium citrate aqueous two-phase systems,Food Bioprod.Process.88(1)(2010)40–46.
[12]J.Vernau,M.R.Kula,Extraction of proteins from biological raw materials using aqueous PEG–citrate phase system,Biotechnol.Appl.Biochem.12(4)(1990)397–404.
[13]D.de Araujo Sampaio,L.I.Mafra,C.I.Yamamoto,E.F.de Andrade,M.O.de Souza,M.R.Mafra,F.de Castilhos,Aqueous two-phase(polyethylene glycol+sodium sulfate)system for caffeine extraction:equilibrium diagrams and partitioning study,J.Chem.Thermodyn.98(1)(2016)86–94.
[14]S.C.Silverio,O.Rodriguez,J.A.Teixeira,E.A.Macedo,The effect of salts on the liquid–liquid phase equilibria of PEG 600 salt aqueous two-phase systems,J.Chem.Eng.Data 58(12)(2013)3528–3535.
[15]K.Wysoczanska,E.A.Macedo,Influence of the molecular mass of PEG on the polymer/salt phase diagrams of aqueous two-phase systems,J.Chem.Eng.Data 61(12)(2016)4229–4235.
[16]E.Fries,J.Klasmeier,Analysis of potassium formate in airport storm water runoff by headspace solid-phase microextraction and gas chromatography–mass spectrometry,J.Chromatogr.A 1216(5)(2009)879–881.
[17]A.Aittomiiki,A.Lahti,Potassium formate as a secondary refrigerant,Int.J.Refrig.20(4)(1997)276–282.
[18]M.A.Isa,U.Eldemerdash,K.Nasrifar,Evaluation of potassium formate as a potential modifier of TEG for high performance natural gas dehydration process,Chem.Eng.Res.Des.91(9)(2013)1731–1738.
[19]A.De Lucas,M.Donate,J.F.Rodríguez,Vapor pressures,densities,and viscosities of the(water+lithium bromide+sodium formate)system and(water+lithium bromide+potassium formate)system,J.Chem.Eng.Data 48(1)(2003)18–22.
[20]B.Basu,S.Jha,M.M.H.Bhuiyan,P.Das,A simple p rotocol for direct reductive amination of aldehydes and ketones using potassium formate and catalytic palladium acetate,Synlett 14(04)(2003)555–557.
[21]R.D.Patil,Y.Sasson,Selective transfer hydrogenation of phenol to cyclohexanone on supported palladium catalyst using potassium formate as hydrogen source under open atmosphere,Appl.Catal.A Gen.499(1)(2015)227–231.
[22]Y.Gao,S.Jaenicke,G.K.Chuah,Highly efficient transfer hydrogenation of aldehydes and ketonesusing potassium formate over AlO(OH)-entrapped ruthenium catalysts,Appl.Catal.A Gen.484(1)(2014)51–58.
[23]M.T.Zafarani-Moattar,Sh.Hamzehzadeh,Liquid–liquid equilibria of aqueous twophase systems containing polyethylene glycol and sodium succinate or sodium formate,Calphad 29(1)(2005)1–6.
[24]M.T.Zafarini-Moattar,R.Sadeghi,A.A.Hamidi,Liquid–liquid equilibria of an aqueous two-phase system containing polyethylene glycol and sodium citrate experiment and correlation,Fluid Phase Equilib.219(2)(2004)149–155.
[25]T.Murugesan,M.J.Perumalsamy,Liquid−liquid equilibria of poly(ethylene glycol)2000+sodium citrate+water at(25,30,35,40,and 45)°C,J.Chem.Eng.Data 50(4)(2005)1392–1395.
[26]S.C.Silvério,A.Wegrzyn,E.Lladosa,O.Rodríguez,E.A.Macedo,Effect of aqueous two-phase system constituents in different poly(ethylene glycol)–salt phase diagrams,J.Chem.Eng.Data 57(4)(2012)1203–1208.
[27]E.Lladosa,S.C.Silvério,O.S.Rodríguez,J.A.Teixeira,E.A.Macedo,(Liquid+liquid)equilibria of polymer–salt aqueous two-phase systems for laccase partitioning,J.Chem.Thermodyn.55(1)(2012)166–171.
[28]M.Pirdashti,K.Movagharnejad,A.A.Rostami,P.Akbarpour,M.Ketabi,Liquid–liquid equilibrium data,viscosities,densities,conductivities,and refractive indexes of aqueous mixtures of poly(ethylene glycol)with trisodium citrate at different p H,J.Chem.Eng.Data 60(11)(2015)3423–3429.
[29]R.Hatti-Kaul,Methods in Biotechnology:Aqueous Two-phase Systems:Methods and Protocols,Humana Press Inc.,Totowa,2000.
[30]M.Jayapal,I.Regupathi,T.Murugesan,Liquid–liquid equilibrium of poly(ethylene glycol)2000+potassium citrate+water at(25,35,and 45)°C,J.Chem.Eng.Data 52(1)(2007)56–59.
[31]D.Othmer,P.Tobias,Liquid–liquid extraction data— the line correlation,Ind.Eng.Chem.34(6)(1942)693–696.
[32]G.R.Vakili-Nezhaad,M.Mohsen-Nia,V.Taghikhani,M.Beh-poor,M.Aghahosseini,Salting-out effect of NaCl and KCl on the ternary LLE data for the systems of(water+propionic acid+isopropyl methyl ketone)and of(water+propionic acid+isobutyl methyl ketone),J.Chem.Thermodyn.36(4)(2004)341–348.
[33]D.B.Hand,Dineric distribution,J.Phys.Chem.34(9)(1930)1961–2000.
[34]Y.Guan,T.H.Lilley,T.E.Treffry,A newexcluded volume theory and its application to the coexistence curves of aqueous polymer two-phase systems,Macromolecules 26(15)(1993)3971–3979.
[35]Y.Guan,T.H.Lilley,M.N.García-Lisbona,T.E.Treffry,Newapproaches to aqueous polymer systems:theory,thermodynamics and applications to biomolecular separations,Pure Appl.Chem.67(6)(1995)955–962.
[36]M.González-Amado,E.Rodil,A.Arce,A.Soto,O.Rodríguez,The effect of temperature on polyethylene glycol(4000 or 8000)–(sodium or ammonium)sulfate aqueous two phase systems,Fluid Phase Equilib.428(1)(2016)95–101.
[37]M.K.Shahbazinasab,F.Rahimpour,Liquid−liquid equilibrium data for aqueous two-phase systems containing PPG725 and salts at various p H values,J.Chem.Eng.Data 57(7)(2012)1867–1874.
[38]T.S.Porto,P.A.Pessôa-Filho,B.B.Neto,J.L.Lima Filho,A.Converti,A.L.F.Porto,A.Pessoa,Removal of proteases from Clostridium perfringens fermented broth by aqueous two-phase systems(PEG/citrate),J.Ind.Microbiol.Biotechnol.34(8)(2007)547–552.
[39]A.R.da Costa,J.S.dos Reis Coimbra,L.A.Ferreira,J.C.Marcos,I.J.B.Santos,M.D.Saldaña,J.A.C.Teixeira,Partitioning of bovine lactoferrin in aqueous two-phase system containing poly(ethylene glycol)and sodium citrate,Food Bioprod.Process.95(1)(2015)118–124.
[40]A.Chakraborty,K.Sen,Impact of p H and temperature on phase diagrams of different aqueous biphasic systems,J.Chromatogr.A 1433(3)(2016)41–55.
[41]R.Sadeghi,B.Jamehbozorg,The salting-out effect and phase separation in aqueous solutions of sodium phosphate salts and poly(propylene glycol),Fluid Phase Equilib.280(1–2)(2009)68–75.
[42]M.T.Zafarani-Moattar,S.Hamzehzadeh,Effect of p H on the phase separation in the ternary aqueous system containing the hydrophilic ionic liquid 1-butyl-3-methylimidazolium bromide and the kosmotropic salt potassium citrate at T=298.15 K,Fluid Phase Equilib.304(1–2)(2011)110–120.
[43]M.T.Zafarani-Moattar,A.Salabat,Thermodynamics of magnesium sulfate–polypropylene glycol aqueous two-phase system.Experiment and correlation,Fluid Phase Equilib.152(1)(1998)57–65.
[44]M.Perumalsamy,T.Murugesan,Phasecompositions,molar mass,and temperature effect on densities,viscosities,and liquid–liquid equilibrium of polyethylene glycol and salt-based aqueous two-phase systems,J.Chem.Eng.Data 54(4)(2009)1359–1366.
[45]S.M.Waziri,B.F.Abu-Sharkh,S.A.Ali,The effect of p H and salt concentration on the coexistence curves of aqueous two-phase systems containing a p H responsive copolymer and polyethylene glycol,Fluid Phase Equilib.205(2)(2003)275–290.
[46]M.Pirdashti,K.Movagharnejad,S.Curteanu,E.N.Dragoi,F.Rahimpour,Prediction of partition coefficients of guanidine hydrochloride in PEG−phosphate systems using neural networks developed with differential evolution algorithm,J.Ind.Eng.Chem.27(2)(2015)268–275.
[47]A.Rahmani,A.A.Rostami,M.Pirdashti,P.Mobalegholeslam,Liquid–liquid equilibrium and physical properties of aqueous mixtures of poly(vinyl pyrrolidone)with potassium phosphate at different p H:experiments and modeling,Korean J.Chem.Eng.34(1)(2017)1–10.
[48]B.Shahrokhi,M.Pirdashti,P.Mobalegholeslam,A.A.Rostami,Liquid–liquid equilibrium and physical properties of aqueous mixtures of poly(ethylene glycol)with zinc sulfate at different p H values:experiment,correlation,and thermodynamic modeling,J.Chem.Eng.Data 62(3)(2017)1106–1118.
[49]M.Pirdashti,K.Movagharnejad,P.Mobalegholeslam,S.Curteanu,F.Leon,Phase equilibrium and physical propertiesof aqueous mixtures of poly(vinyl pyrrolidone)with trisodium citrate,obtained experimentally and by simulation,J.Mol.Liq.223(1)(2016)903–920.
 Chinese Journal of Chemical Engineering2018年1期
- Chinese Journal of Chemical Engineering的其它文章
- Membrane materials in the pervaporation separation of aromatic/aliphatic hydrocarbon mixtures—A review☆
- Cultivation of microalgae for biodiesel production:A reviewon upstream and downstream processing☆
- Numerical study and acceleration of LBM-RANS simulation of turbulent flow☆
- GPU-based discrete element simulation on flow stability of flat-bottomed hopper☆
- Tuning sol size to optimize organosilica membranes for gas separation☆
- Oil–water pre-separation with a novel axial hydrocyclone☆
