
Preparation and SO2 Adsorption Behavior of Coconut Shell-Based Activated Carbon via Microwave-Assisted Oxidant Activation
2018-04-24 06:09JiaFengruiLiZhouWangEngangHeJichengDongHuiLiuGuangxinJianWeiwei
中国炼油与石油化工 2018年1期
Jia Fengrui; Li Zhou; Wang Engang; He Jicheng; Dong Hui; Liu Guangxin; Jian Weiwei
(1. School of Metallurgy, Northeastern University, Shenyang 110819;2. College of Petroleum Engineering, Liaoning Shihua University, Fushun 113001)
1 Introduction
Activated carbon (AC) has been widely used as SO2adsorbent owing to its highly porous structure and the oxygen functional groups on its surface[1-5]. The microwave radiation technology is a highly efficient energy-saving method for the preparation of AC, which has the characteristics of increasing the chemical bond activity on the surface[6-11].
Recent studies have investigated the preparation of AC by microwave irradiation. Foo and Hameed conducted a series of experiments to study the SO2adsorption capacity of AC prepared via the microwave irradiation and activated by different alkaline reagents (i.e., KOH and K2CO3)[6,12-15]. Ania, et al. compared the effects of different heating mechanisms of single mode microwave and conventional electric furnace on the adsorptive capacities of regenerated AC[16-17]. Zhang, et al. studied the SO2adsorption characteristics of AC modified at different microwave power values[10]. Ge, et al. studied the ironmodified coal-based AC prepared through microwave irradiation and its capacity for adsorption of polycyclic aromatic hydrocarbons from aqueous solutions[18]. Liu,et al. studied the effects of microwave power, irradiation time, and other synthetic factors on the activation of microwave-prepared AC[19]. These studies made good exploratory contributions to our understanding of the adsorption behavior of AC. However, only a few studies have reported the effect of the oxidizability of oxidants on the SO2adsorption capacity of AC prepared with a certain microwave power.
The purpose of this study is to explore the effect of oxidizability of specific oxidants on the SO2adsorption behavior of coconut shell-based activated carbon (CAC).The CAC prepared by microwave irradiation and three oxidants (K2Cr2O7, H2O2, and KMnO4) were characterized by scanning electron microscopy (SEM), N2adsorptiondesorption analysis, and X-ray photoelectron spectroscopy(XPS). Moreover, the trends of adsorption capacity of CAC at different temperatures and initial SO2concentrations
2 Experimental
2.1 Materials
In this work, CAC was used as the adsorbent, and its synthetic procedure is as follows: CAC was ground into particles with a size range of 0.38–1.70 mm (10–40 mesh)and washed with the de-ionized water to remove any dirt adhering to it. The CAC was then irradiated with microwave at 600 W for 3 min while being blanketed with a high-purity nitrogen gas (99.99%). The microwave-modified CAC was divided into 4 groups: the group MW-CAC was not mixed with any oxidant, whereas the other three groups, MWK2Cr2O7-CAC, MW-H2O2-CAC, and MW-KMnO4-CAC,were soaked in 0.4 mol/L solutions of K2Cr2O7, H2O2, and KMnO4, respectively. According to the oxidation-reduction potential, the order of oxidation intensity decreases in the following order: K2Cr2O7> KMnO4> H2O2. The process was completed in a closed system to reduce the interference of atmospheric water vapor and sunlight. Finally, the adsorbents were dried at 105 °C for 12 h in a drying oven to avoid any moisture effect.
2.2 Characterization
The surface physical properties and pore size distribution of the samples were characterized by measuring the nitrogen adsorption/desorption isotherms at 77 K using an Autosorb-IQ2-MP gas sorption analyzer (Quantachrome Co., USA) capable of determining a minimum specific surface area of 0.0005 m2/g. The Brunauer-Emmett-Teller surface area (SBET) and the pore size distribution of the samples were determined by the nonlocal density functional theory (NLDFT), the quenched solid density functional theory (QSDFT)[20-22], and the Grand Canonical Monte Carlo (GCMC)[20,23]pore distribution model, while the micropore area (Smic) and the micropore volume (Vmic)were estimated from t-plot. The mean pore size (Dp) was determined from Dp= 4Vtot/SBET.
The surface morphologies of the samples were observed using a field emission scanning electron microscope(FESEM, Hitachi, SU8000, Japan) with an accelerating voltage of 15 kV. Prior to analysis, the samples were dried at 105 °C and stored for more than 12 h, and were then fixed on conductive strips to prevent them from falling in the vacuum experiment environment.
The XPS experiments were performed with a Multilab 2000 spectrometer (Thermo Fisher Scientific, U.S.) using a Mg KαX-ray source (1 253.6 eV), and the data were evaluated using the XPS Peak software (v. 4.1, Raymund W. M. Kwork)[24-27]. To compensate the charging effects,the spectra were calibrated with graphitic carbon as a reference with a binding energy (BE) of 284.8 eV.Background subtraction was performed according to the Shirley method.
2.3 Adsorption experiments
SO2adsorption experiments were performed on a custom fixed bed reactor to determine the adsorption capability of the samples. The test platform can be divided into three parts, viz.: the flue gas preparation, the activated carbon adsorption, and the gas composition testing and recovery.The simulated flue gas consisted of SO2(1700 μL/L),O2(10%), H2O (10%), and N2expressed as the balance.The packing layers of the samples were preheated to the experimental temperature using electric heaters.The composition of the tail gas was evaluated, and the adsorptive desulfurization capacity (q) of samples could be calculated.
3 Results and Discussion
3.1 Characterization
3.1.1 Scanning electron microscopy (SEM)
The SEM images of the four CAC samples before SO2adsorption are shown in Figure 1 (a)–(d). The surface of CAC-MW, which was only microwave activated,exhibited a squamose structure with a large number of micropores (Figure 1 (a)). In addition, many microporous structures existed within some macropores, as shown by Figure 1 (b) and (c). Moreover, the Dpof samples increased after soaking in different oxidants, with the maximum Dpexceeding 100 μm. The formation of macropores is conducive not only to the adsorption of SO2and H2O by the pores located inside the samples, but also to the adsorption of H2SO4and other macromolecules generated during the process, thus promoting the adsorption of SO2from flue gas[22,28].
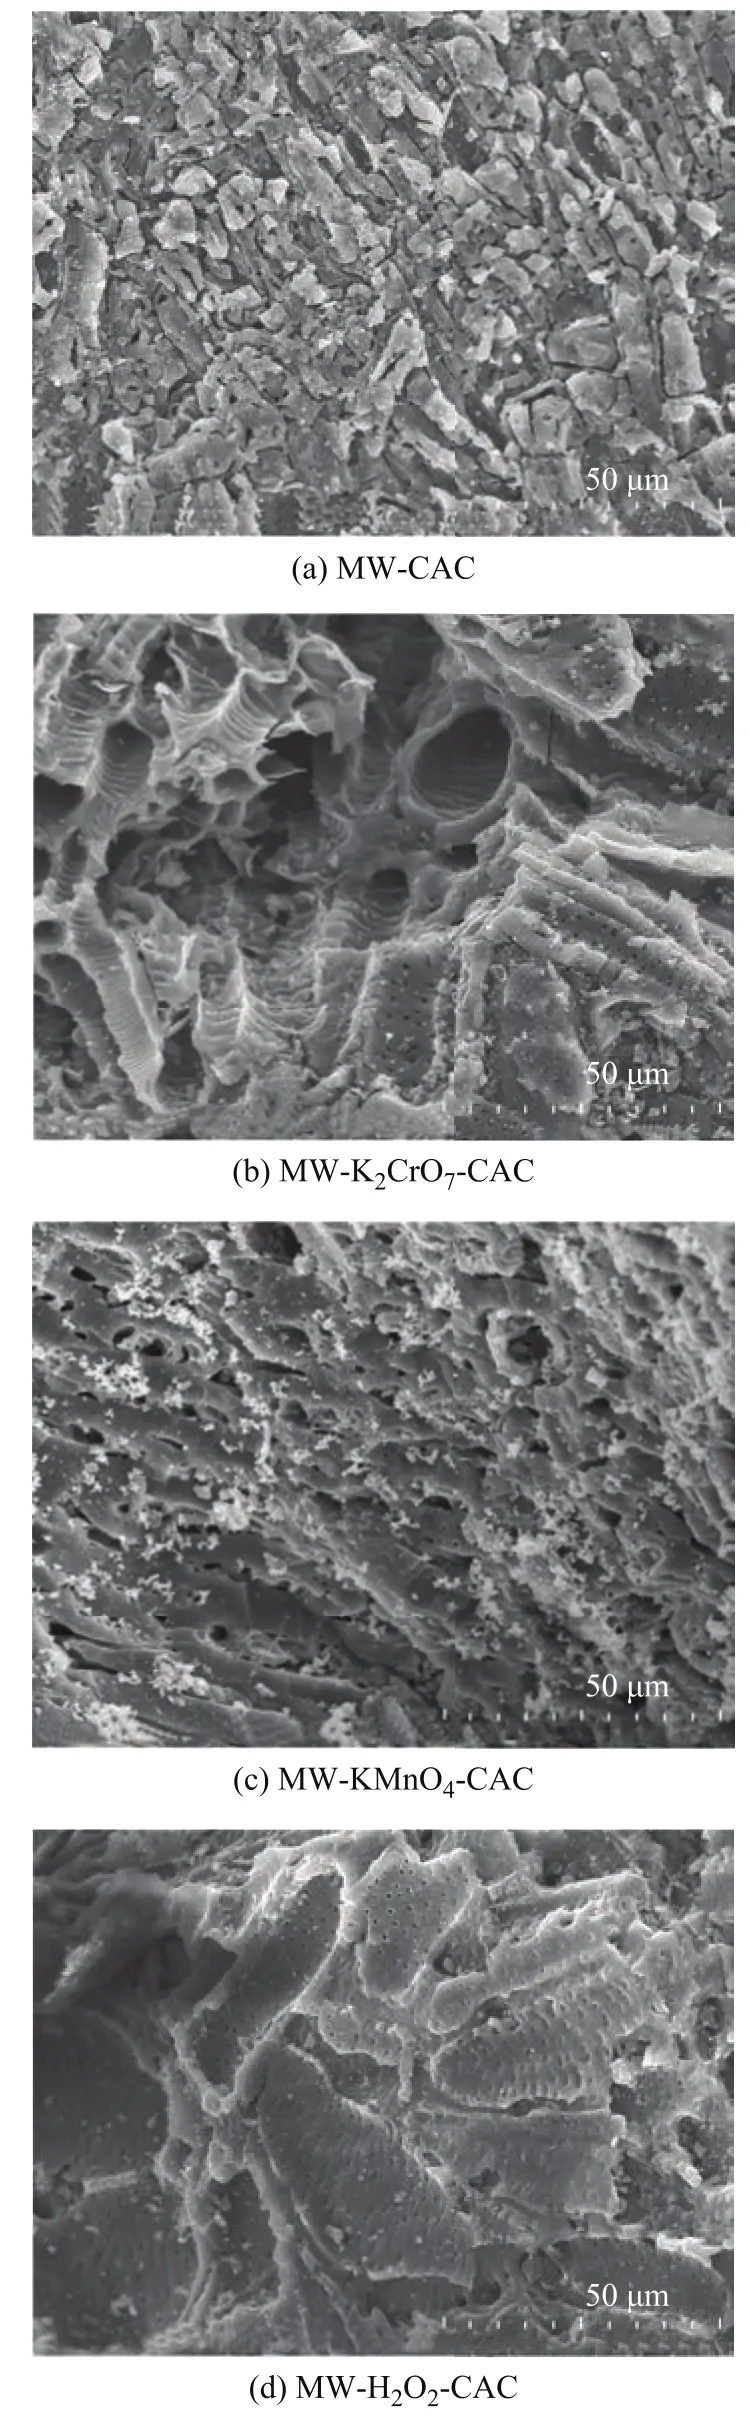
Figure 1 SEM images of external surfaces of samples
3.1.2 BET surface area and pore size distribution
Figure 2 (a) shows the N2adsorption-desorption isotherms for the four samples. According to the International Union of Pure and Applied Chemistry (IUPAC) classification,the adsorption isotherm of each sample belongs to type I adsorption isotherm. Each adsorption curve increased sharply for p/p0= 0—0.02, and showed a smooth in flection point when p/p0increased from 0.02 to 0.2, suggesting a wide micropore size distribution. The amount of N2adsorption increased slowly with the increase in relative pressure, and the isotherm exhibited a tailing phenomenon when the relative pressure increased to a certain value.The desorption curve has a significant hysteresis ring and gradually intersects the adsorption curve at p/p0= 1. It shows that the samples contained not only micropores, but also mesopores. The N2adsorption capacity of AC was determined by the SBETand Vtotvalues. The N2adsorption capacity of MW-CAC was the largest, which indicated that the microwave-modified CAC had considerably high SBETand Vtotvalues. However, the CAC samples co-modified with the oxidants demonstrated the reduced SBETand Vtotvalues. This is consistent with the calculated pore structure parameters listed in Table 1. Figure 2 (b) shows the DFT pore size distribution of the samples. It can be seen that the pore size distributions of all the samples were extensive,although they were mainly concentrated in the micropores and small mesopores (2—5 nm). This shows that the modifications by microwave and oxidants had little effect on the pore size distribution of AC.
Table 1 presents the pore structure parameters of the microwave-modified CAC and the microwave and oxidant co-modified CACs. The SBET, Vtot, and DAof MW-CAC were 983.7 m2/g, 0.3902 cm3/g, and 1.726 nm, respectively.Compared to MW-CAC, the co-modified CACs exhibited lower SBETand Vtotvalues but higher DAvalues. The SBETand Vtotof MW-K2Cr2O7-CAC and MW-KMnO4-CAC showed obvious decrement. The SBETand Vtotdecreased with an increasing oxidizability, whereas Dpincreased with an increasing oxidizability. This is because the oxidants could corrode the surfaces of the samples and promote the formation of oxygen-containing functional groups.
3.1.3 XPS analysis

Figure 2 N2 adsorption-desorption isotherms (a) and pore size distribution (b) of samples
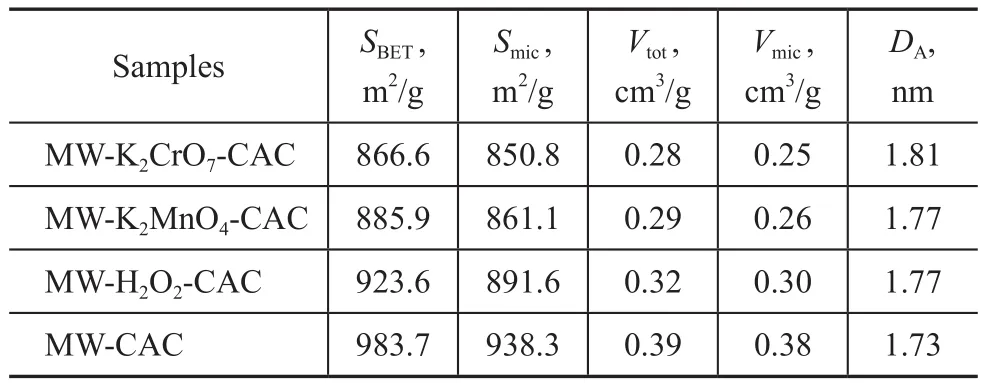
Table 1 The effect of oxidants on BET surface area, pore volumes and average pore sizes of samples (with microwave power of 600 W)
Figure 3 shows the C1s and O1s spectra of the samples prior to SO2adsorption. The C1S binding energies for C-C, C-O, C=O, and O=C-O are 284.7 eV, 286.1 eV,287.2 eV, and 288.6 eV, respectively. For all the samples,the absolute content of C-C was not affected by the oxidizability of the oxidants. However, the percentage ratios of oxygen-containing functional groups increased with an increasing oxidizability of the oxidants, in particular the alcohol and carboxyl groups. Compared to MW-CAC, the percentage ratios of alcohol and carboxyl groups for MW-K2Cr2O7-CAC increased by 11.07%and 3.99%, respectively. Therefore, the formation of alcohol and carboxyl groups is bene ficial to the chemical adsorption of SO2by the samples.
3.2 Adsorption tests
3.2.1 Effect of oxidants
As seen in Figure 4, the saturated adsorption capacities for SO2per unit mass of samples decreased in the following order: MW-K2Cr2O7-CAC > MW-KMnO4-CAC> MW-H2O2-CAC > MW-CAC. Moreover, the saturated adsorption capacity of MW-K2Cr2O7-CAC for SO2was equal to around 40.09 mg/g, which was about 2.45 times that of MW-CAC. During the first 30 min, the adsorption rates of the four samples were nearly the same. However,after 30 min, the adsorption rates of MW-CAC and MWH2O2-CAC rapidly decreased, and these samples attained the saturated adsorption capacity in 180 min and 214 min, respectively. However, the adsorption rates of MWK2Cr2O7-CAC and MW-KMnO4-CAC started declining after 124 min and 130 min, and decreased to 0 at 280 min and 310 min, respectively.
It should be noted that oxidation can improve the adsorption capacity of the samples since the corrosive effect of the oxidant extends to the internal adsorption regions of the samples[29], which is bene ficial to the flow of SO2and other reaction products into the internal micropores.
3.2.2 Effect of initial SO2 concentration
Figure 5 (a), (b), and (c) show the adsorption capacity and adsorption rate curves of MW-K2Cr2O7-CAC,MW-KMnO4-CAC, and MW-H2O2-CAC at different initial SO2concentrations, respectively. The saturated adsorption capacities and initial adsorption rates of the samples increased with an increasing initial SO2concentration. When the SO2concentration in the simulated flue gas was 2000 ppm, the saturated adsorption capacity and the initial adsorption rate were 42.7 mg/g (at about 275 min) and 0.23 mg/(g·min),respectively. However, as the adsorption reaction proceeded, the reaction product, H2SO4, could block the internal pores or surfaces of the sample, leading to a gradual decrease in its saturated adsorption rate.Therefore, a high initial SO2concentration could contribute to the increase in SO2adsorption capacity and adsorption rate of the sample.
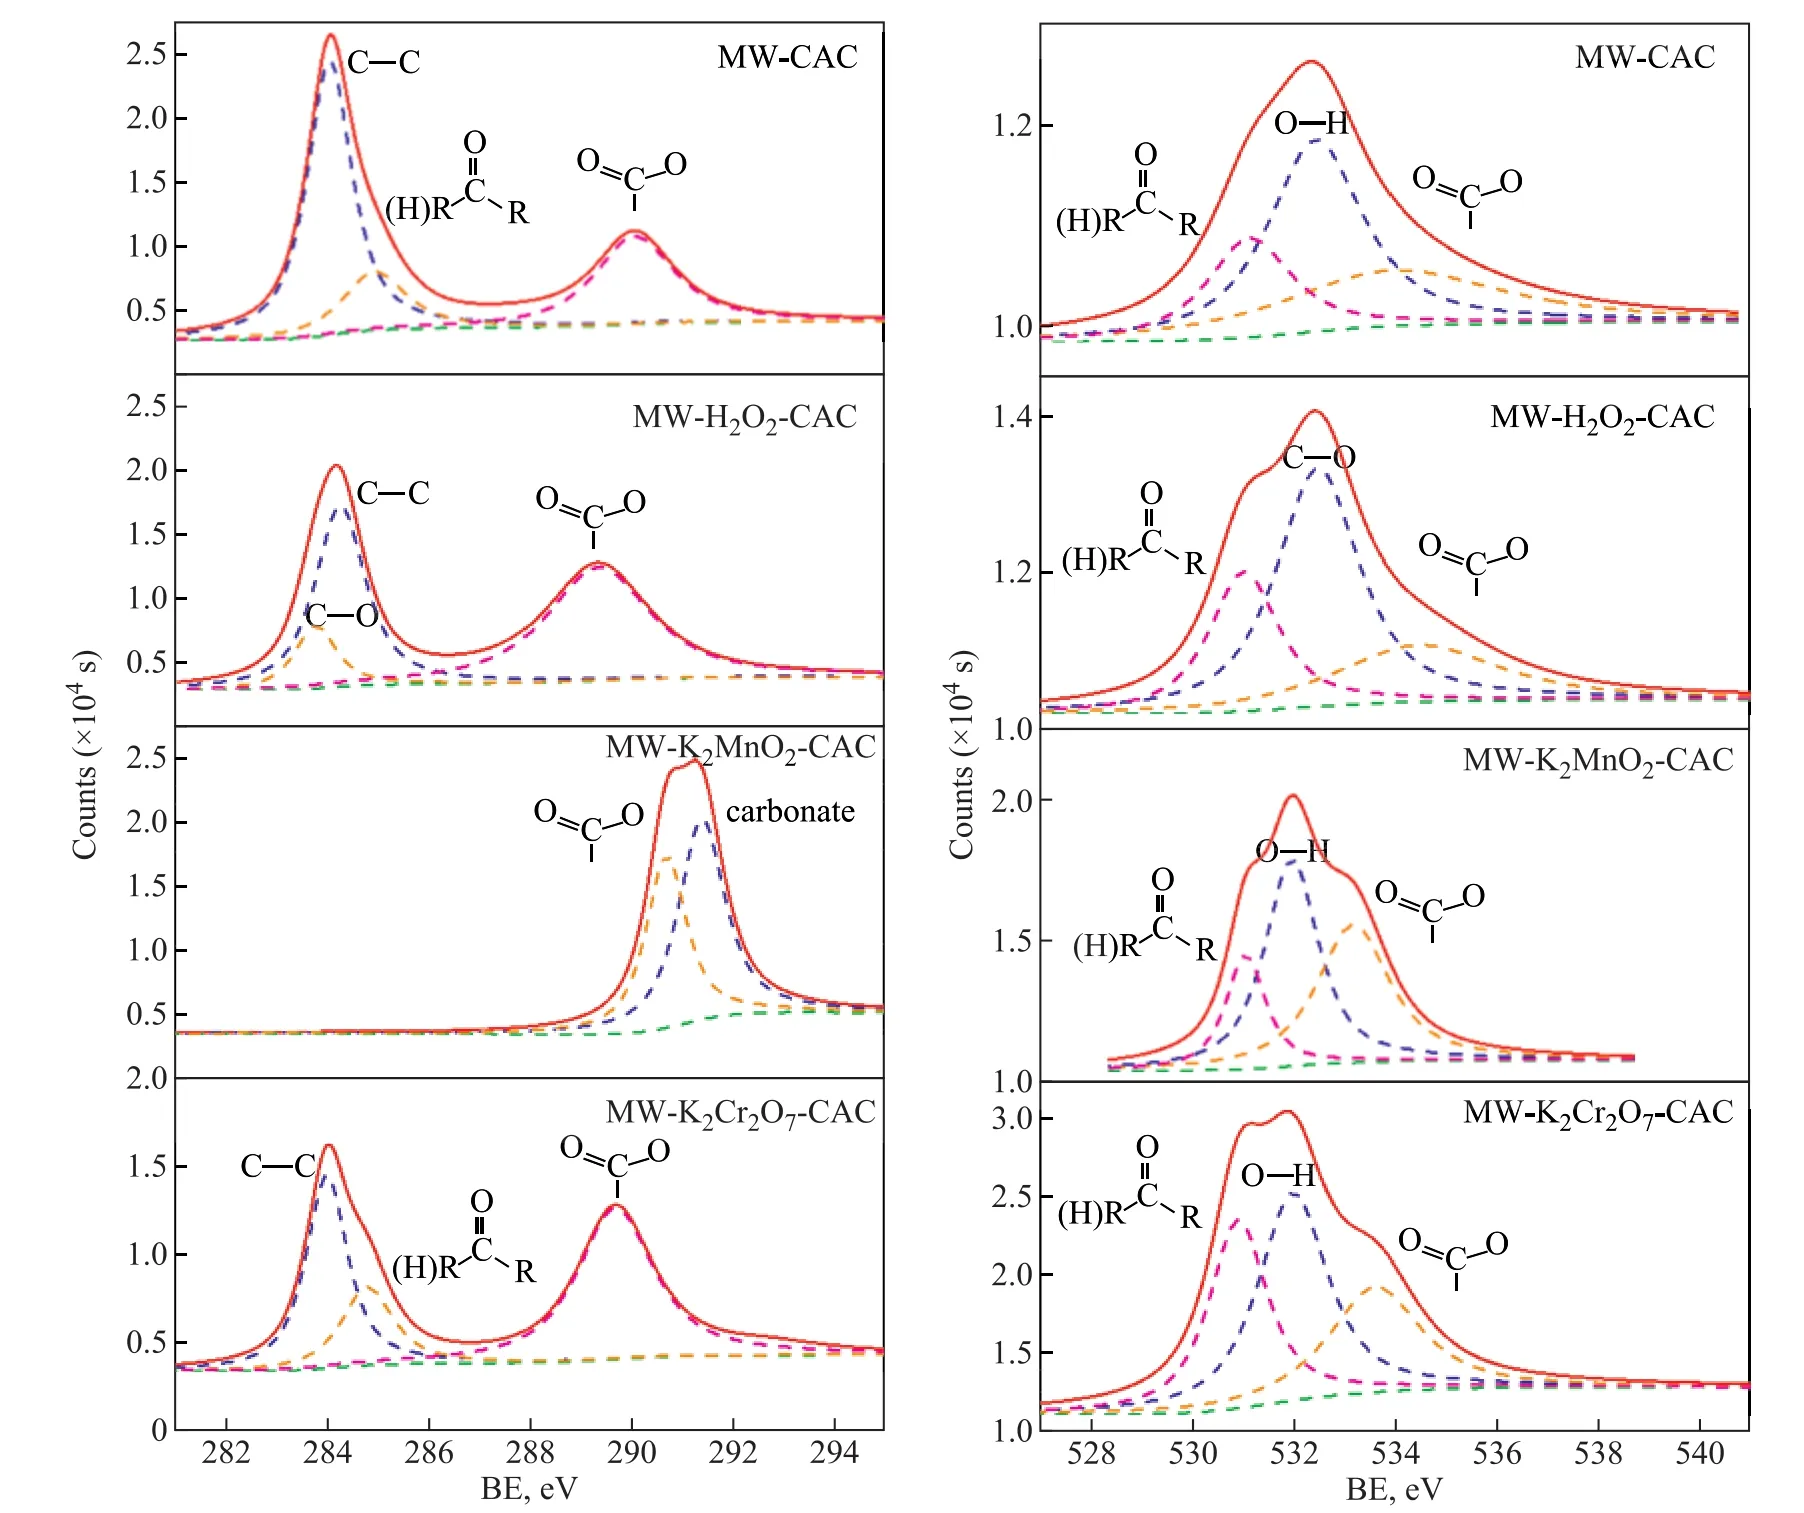
Figure 3 C 1s (left) and O 1s (right) spectra of the samples: MW-CAC; MW-K2CrO7-CAC; MW-KMnO4-CAC; and MWH2O2-CAC
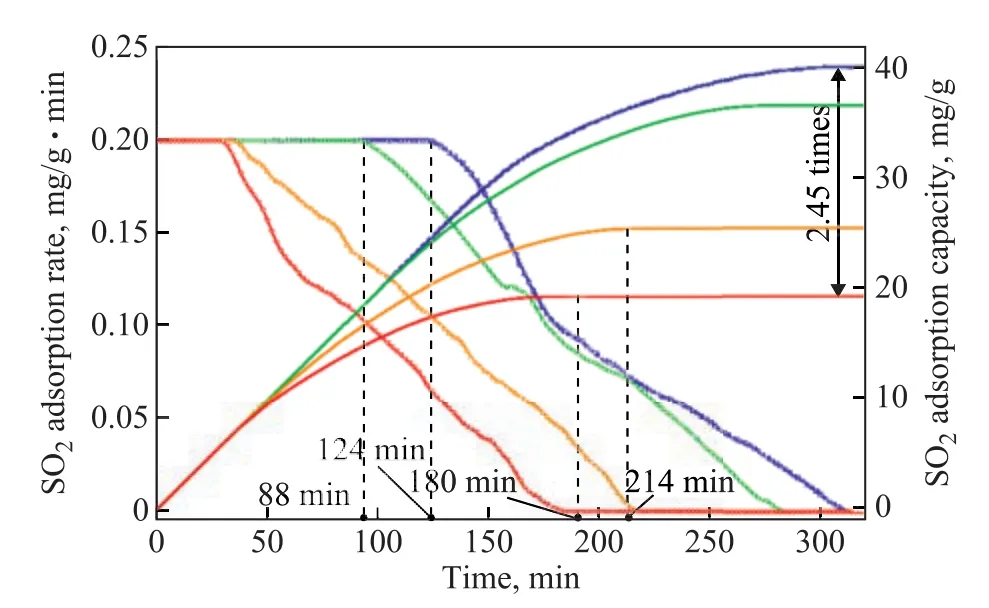
Figure 4 Effect of oxidizability on SO2 adsorption capacity and adsorption rate
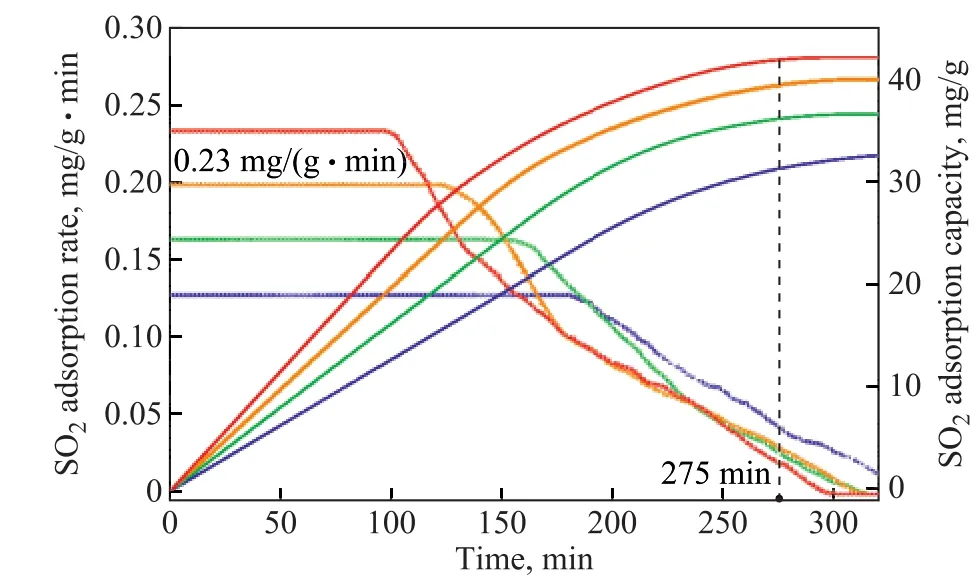
Figure 5 Effect of initial SO2 concentration on SO2 adsorption capacity and adsorption rate
3.2.3 Effect of bed temperature
The effect of bed temperature on SO2adsorption by MWK2Cr2O7-CAC is shown in Figure 6. The adsorption test was performed at 60 °C, 80 °C, 100 °C, and 120 °C,respectively, while maintaining the other experimental variables unchanged. The saturated adsorption capacity and the adsorption rate of the sample decreased with the increase in bed temperature. The saturated adsorption capacity and adsorption rate decreased by 6.48 mg/g and 0.01 mg/(g·min) for each 20 °C increment in bed temperature. At 60 °C, the sample maintained a maximum adsorption rate between 0 to 130 min, whereas at 120 °C the maximum adsorption rate could only be maintained for 40 min. Therefore, 60 °C is considered to be an ideal temperature, as compared with other bed temperatures employed in this experiment. The result suggests that a low bed temperature could contribute to the increase in SO2adsorption capacity and adsorption rate of the sample.
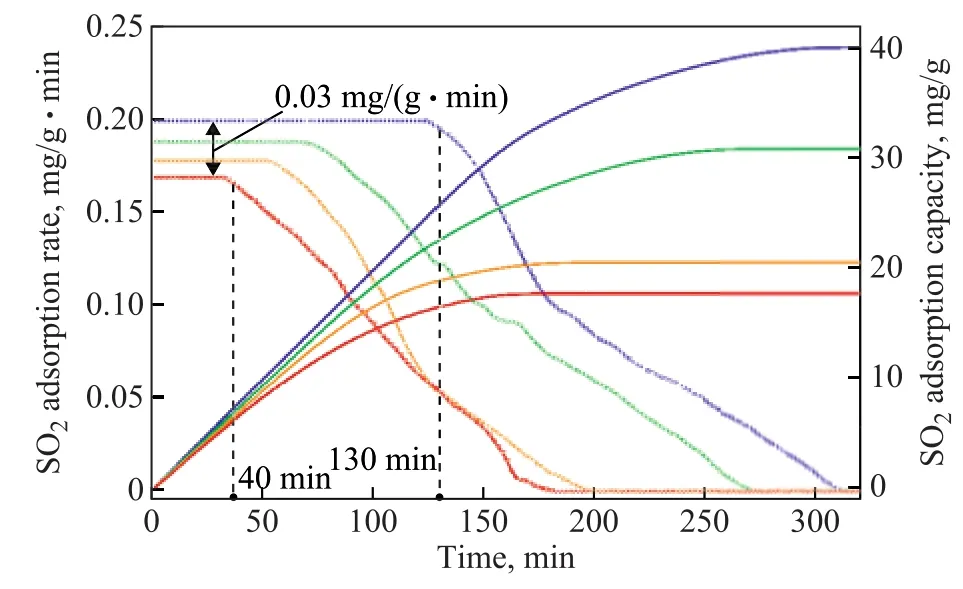
Figure 6 Effect of bed temperature on SO2 adsorption capacity of MW-KCr2O7-CAC
3.3 SO2 adsorption equilibrium
The adsorption equilibrium of the gas on the surface of the AC is usually described by the Langmuir and Freundlich equations. The Langmuir adsorption isotherm model assumes that adsorption occurs on the homogeneous surface of the monolayer oriented adsorption and ignores the lateral interaction between the adsorbed molecules[30-32]. The Freundlich adsorption isotherm model assumes that the adsorption heat is logarithmically reduced on the non-uniform surfaces as the surface coverage increases[33-35].
The Langmuir isotherm is expressed as:
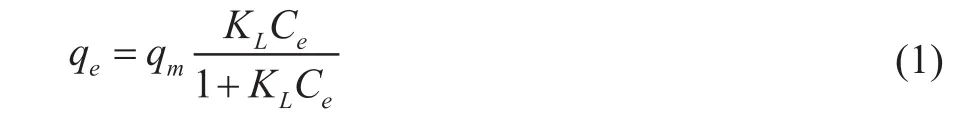
where qe(mg/g) is the amount of adsorbate on unit weight of adsorbent, qm(mg/g) is the Langmuir constant related to adsorption capacity, Ceis the initial concentration of the adsorbate (g/m3), and KLis the Langmuir constant related to the rate of adsorption (m3/g). Hence, the linearized plot of Ce/qevs. Cegives a slope of (1/qm) and intercept of (1/qmKL).The Freundlich isotherm is expressed as:

where qeis the adsorption capacity of the adsorbent (mg/g), KFis the adsorption or distribution coefficient for the Freundlich isotherm ((mg·(m3)1/n)/(g·g1/n)), Ce(g/m3) is the initial adsorbate concentration, and n is a dimensionless constant associated with the temperature and the adsorption intensity. A plot of ln qevs. ln Ceenables the determination of constant KFand exponent 1/n. The magnitude of the exponent n indicates the favorability of adsorption,with n > 1 representing a favorable adsorption condition.
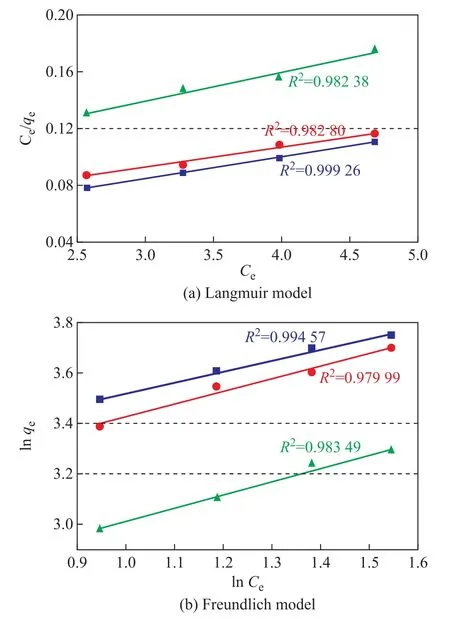
Figure 7 Linear fitting of adsorption equilibrium of SO2 on the samples
As shown in Table 2, the results of the Langmuir adsorption isotherm model are better than those of the Freundlich model, which means that the Langmuir modelcan better predict the adsorption equilibrium of SO2on the surfaces of the samples. According to this model,the samples mainly demonstrate the chemical surface adsorption behavior for SO2.
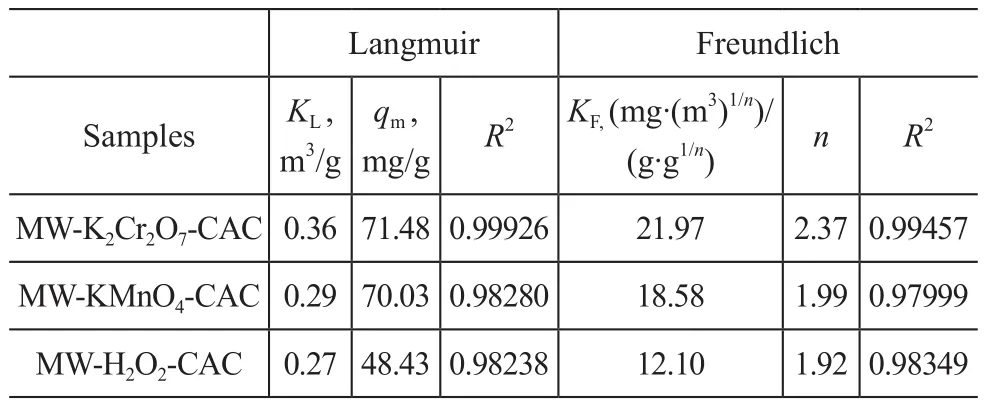
Table 2 Parameters of linear fitting of adsorption equilibrium
4 Conclusions
The SO2adsorption capacity of the CAC samples was enhanced in the following order: MW-CAC < MWH2O2-CAC < MW-KMnO4-CAC < MW-K2Cr2O7-CAC.The formation of alcohol and carboxyl groups increased the adsorption capacity for SO2. The oxidant supported on CAC via microwave irradiation can significantly promote the SO2adsorption capacities and adsorption rates of the samples. K2Cr2O7was the main active phase in the prepared CAC sample and showed excellent SO2adsorption capacity at a bed temperature of 60 °C and an initial SO2concentration of 2000 ppm. However, it could maintain the maximum adsorption rate only for a short period. Furthermore, the Langmuir model could better predict the SO2adsorption equilibrium on the surfaces of the samples and could validate that SO2adsorbed on the sample surfaces was mainly realized via chemical adsorption.
[1] Mathieu Y, Tzanis L, Soulard M, et al. Adsorption of SOx by oxide materials: A review[J]. Fuel Processing Technology, 2013, 114: 81–100
[2] Przepiorski J, Czyzewski A, Pietrzak R, et al. Porous carbon material containing CaO for acidic gas capture:Preparation and properties[J]. J Hazard Mater, 2013, 263(2): 353–360
[3] Muñiz J, Herrero J E, Fuertes A B. Treatments to enhance the SO2capture by activated carbon fibres[J]. Applied Catalysis B: Environmental, 1998, 18(1/2): 171–179
[4] Rezaei F, Rownaghi A A, Monjezi S, et al. SOx/NOx removal from flue gas streams by solid adsorbents: A review of current challenges and future directions[J].Energy & Fuels, 2015, 29(46): 5467−5486
[5] Guo Deyong, Li Fei, Liu Wenge. Methane adsorption study using activated carbon fiber and coal based activated carbon[J]. China Petroleum Processing & Petrochemical Technology, 2013, 15(4): 20–25
[6] Foo K Y, Hameed B H. Coconut husk derived activated carbon via microwave induced activation: Effects of activation agents, preparation parameters and adsorption performance[J]. Chemical Engineering Journal, 2012, 184:57–65
[7] Wang X C, Bi X Y, Sun P S, et al. Effects of oxygen content on the simultaneous microbial removal of SO2and NOx in biotrickling towers[J]. Biotechnology and Bioprocess Engineering, 2015, 20(5): 924–930
[8] Wang X, Wang A, Wang X, et al. Microwave plasma enhanced reduction of SO2to sulfur with carbon[J]. Energy& Fuels, 2007, 21(2): 867–869
[9] Zhang L Q, Jiang H T, Ma C Y, et al. Microwave regeneration characteristics of activated carbon for flue gas desulfurization[J]. Journal of Fuel Chemistry and Technology, 2012, 40(11): 1366–1371
[10] Zhang L, Cui L, Wang Z, et al. Modification of activated carbon using microwave radiation and its effects on the adsorption of SO2[J]. Journal of Chemical Engineering of Japan, 2016, 49(1): 52–59
[11] Luo Ying, Zhang Zhongzhe, Qi Jibing, et al. Optimization of high-gravity chelated iron process for removing H2S based on response surface methodology[J]. China Petroleum Processing & Petrochemical Technology, 2015,17(3): 87–93
[12] Foo K Y, Hameed B H. Microwave-assisted preparation of oil palm fiber activated carbon for methylene blue adsorption[J]. Chemical Engineering Journal, 2011, 166(2):792–795
[13] Foo K Y, Hameed B H. Preparation and characterization of activated carbon from pistachio nut shells via microwaveinduced chemical activation[J]. Biomass and Bioenergy,2011, 35(7): 3257–3261
[14] Foo K Y, Hameed B H. Preparation and characterization of activated carbon from sunflower seed oil residue via microwave assisted K2CO3activation[J]. Bioresour Technol, 2011, 102(20): 9794–9799
[15] Foo K Y, Hameed B H. Porous structure and adsorptive properties of pineapple peel based activated carbons prepared via microwave assisted KOH and K2CO3activation[J]. Microporous and Mesoporous Materials,2012, 148(1): 191–195
[16] Ania C O, Menéndez J A, Parra J B, et al. Microwaveinduced regeneration of activated carbons polluted with phenol. A comparison with conventional thermal regeneration[J]. Carbon, 2004, 42(7): 1383–1387
[17] Ania C O, Parra J B, Menendez J A, et al. Microwaveassisted regeneration of activated carbons loaded with pharmaceuticals[J]. Water Res, 2007, 41(15): 3299–3306
[18] Ge X, Wu Z, Wu Z, et al. Enhanced paths adsorption using iron-modified coal-based activated carbon via microwave radiation[J]. Journal of the Taiwan Institute of Chemical Engineers, 2016, 64: 235–243
[19] Liu Q S, Zheng T, Wang P, et al. Preparation and characterization of activated carbon from bamboo by microwave-induced phosphoric acid activation[J].Industrial Crops and Products, 2010, 31(2): 233–238
[20] Carrott P J M, Marques L M, Carrott M M L R.Characterisation of the porosity of polymer and carbon aerogels containing Fe, Ni or Cu prepared from 2,4-dihydroxybenzoic acid by n-nonane pre-adsorption and density functional theory[J]. Microporous and Mesoporous Materials, 2010, 131(1/3): 75–81
[21] Neimark A V, Lin Y, Ravikovitch P I, et al. Quenched solid density functional theory and pore size analysis of micromesoporous carbons[J]. Carbon, 2009, 47(7): 1617–1628
[22] Puziy A M, Poddubnaya O I, Kochkin Y N, et al. Acid properties of phosphoric acid activated carbons and their catalytic behavior in ethyl-tert-butyl ether synthesis[J].Carbon, 2010, 48(3): 706–713
[23] Liu Y, Zhu Y, Li W, et al. Molecular simulation of methane adsorption in shale based on grand canonical Monte Carlo method and pore size distribution[J]. Journal of Natural Gas Science & Engineering, 2016, 30: 119–126
[24] Zhang S, Li X Y, Chen J P. An XPS study for mechanisms of arsenate adsorption onto a magnetite-doped activated carbon fiber[J]. J Colloid Interface Sci, 2010, 343(1): 232–238
[25] Chiang Y C, Lin W H, Chang Y C. The influence of treatment duration on multi-walled carbon nanotubes functionalized by H2SO4/HNO3oxidation[J]. Applied Surface Science, 2011, 257(6): 2401–2410
[26] Liu H, Li G, Hu C. Selective ring C-H bonds activation of toluene over Fe/activated carbon catalyst[J]. Journal of Molecular Catalysis A: Chemical, 2013, 377: 143–153
[27] Fu X, Yang H, Sun H, et al. The multiple roles of ethylenediamine modification at TiO2/activated carbon in determining adsorption and visible-light-driven photoreduction of aqueous Cr(VI) [J]. Journal of Alloys and Compounds, 2016, 662: 165–172
[28] Zhou J H, Sui Z J, Zhu J, et al. Characterization of surface oxygen complexes on carbon nano fibers by TPD, XPS and FT-IR[J]. Carbon, 2007, 45(4): 785–796
[29] Yang S, Li L, Xiao T, et al. Promoting effect of ammonia modification on activated carbon catalyzed peroxymonosulfate oxidation[J]. Separation and Purification Technology, 2016, 160: 81–88
[30] Moreno-Castilla C, Ferro-Garcia M, Joly J, et al. Activated carbon surface modifications by nitric acid, hydrogen peroxide, and ammonium peroxydisulfate treatments[J].Langmuir, 1995, 11(11): 4386–4392
[31] Suárez D, Menéndez JA, Fuente E, et al. Contribution of pyrone-type structures to carbon basicity: An ab initio study[J]. Langmuir, 1999, 15(11): 3897–3904
[32] Langmuir I. The constitution and fundamental properties of solids and liquids. Part I. Solids[J]. Journal of the American Chemical Society: 1916, 38(11): 2221–2295
[33] Kong J, Yue Q, Huang L, et al. Preparation,characterization and evaluation of adsorptive properties of leather waste based activated carbon via physical and chemical activation[J]. Chemical Engineering Journal,2013, 221: 62–71
[34] Song X, Liu H, Cheng L, et al. Surface modification of coconut-based activated carbon by liquid-phase oxidation and its effects on lead ion adsorption[J]. Desalination,2010, 255(1-3): 78–83
[35] Zhi Y, Liu J. Surface modification of activated carbon for enhanced adsorption of per fluoroalkyl acids from aqueous solutions[J]. Chemosphere, 2016, 144: 1224–1232
- 中国炼油与石油化工的其它文章
- Synthesis of Core-Shell HZSM-5@SBA-15 Composite and Its Performance in the Conversion of Methanol to Aromatics
- Effects of Gasoline with Ester Additives on the Swelling Behavior of Rubbers
- Fabrication of the Core-Shell Structured ZSM-5@Mg(Al)O and Its Catalytic Application in Propane Dehydrogenation
- ZSM-5/MAPO Composite Catalyst for Converting Methanol to Ole fins in a Two-Stage Unit with a Dimethyl Ether Pre-Reactor
- Oxidation of Dibenzothiophene in Model Diesel Using Hydroperoxide Generated via In-Situ Reaction of Octane with Oxygen
- Controllable Synthesis of Mixed-Phase TiO2 with Small Anatase and Rutile Particle and Its Enhanced Photocatalytic Activity