Investigation on the plastic work-heat conversion coefficient of 7075-T651 aluminum alloy during an impact process based on infrared temperature measurement technology
Tong Zhang·Ze-Rong Guo·Fu-Ping Yuan·Hu-Sheng Zhang
1 Introduction
During high strain rate deformation,stress fields and temperature fields of materials are generally coupled[1].Plastic deformation can produce significant instantaneous temperature rise in materials,which can result in material softening and phase transformation[2,3].The parameter that is used for the quantitative description of the relationship between plastic work and generated heat is known as the coefficient of plastic work converted to heat.It is usually expressed withβ.The coefficient of plastic work converted to heat can help to study the effect of heat generation of materials during dynamic plastic deformation,and it has important roles in building a thermal coupling constitutive model of materials,and studying the mechanism of formation of the adiabatic shear band(ASB).
The key to the estimation of the coefficient of plastic work converted to heat is the real-time temperature measurement of materials under impact loading. In the previous studies, many kinds of measurement methods including the thermocouple method[4]and infrared thermometry[5]were applied.Infrared thermometry has advantages of non-contact temperature measurement and short response time,so it has been widely used at present.Through a single InSb infrared detector,Kapoor and Nemat-Nasser[6]successfully measured the temperature rises of 1018 steel,6061 aluminum alloy,and pure titanium under dynamic compression.By means of a linear array detector with 12 units,Macdougall and Harding[7]found that the temperature rise of Ti6Al4 V alloy under dynamic tension was 50°C,andβincreased from 0.2 to 0.7 with increasing strain.By using an array detector,Potdar and Zehnder[8]measured the temperature rises of 1018 steel and 6061 aluminum alloy in high-speed cutting and got the isothermal diagram.Apparently,the way of obtaining theβvalue through the infrared temperature measurement method is most effective and reliable.
However,the obtained results on theβare still controversial.Some of the literature holds that theβof materials is a constant at the range of 0.85–1.0[9–11],but substantial other researches show that such a conclusion does not apply to all materials and theβvalues should be related to the strain and the strain rate.Thus,Hodowany et al.[12]loaded titanium alloy under different strain rates and found theβvalue increased with increasing strain rate.By compression tests using a split Hopkinson pressure bar(SHPB),Rittel[13]found theβvalues of glassy polymer under high strain rate were positively correlated with the strain and the strain rate.By setting differentβvalues and using the AUTODYN 2D program,Zhang et al.[14]calculated the temperature rise when a blunt bullet penetrated a metal target,and were compared with the corresponding experimental results.They found that the temperature rise in the shear zone would be excessively estimated when theβvalue was set to be 0.8,0.9,and 1.0.Such results showed that the simulation results would be not accurate ifβwas only considered as a constant in the calculation process.
So far,the coefficient of plastic work converted to heat of an aluminum alloy 7075-T651 aluminum alloy was seldom reported.The 7075-T651 aluminum alloy is one classic material for aeronautics,astronautics areas and defense utility,and the research on itsβvalue is of great importance for optimizing the constitutive equation,and establishing the related data model.Aiming at the above problems,in the present paper,the SHPB system and a constructed infrared temperature measurement system were used to study the temperature rise under dynamic compression,and the influences of the strain and the strain rate on theβvalues.
2 Experimental design
The 7075-T651 aluminum alloy used in the present study was identical to the commercial product and had the chemical composition which is given in Table 1.The tested material was supplied as an extruded bar,which was manufactured using cold working followed by natural aging.
2.1 Determining the value of β
The energy conservation equation was given by Mason et al.[15],which expresses the relationship between the heat generation and the variation of the temperature,

Table 1 Chemical composition of the 7075-T651 aluminum alloy

whereαis the thermal diffusivity,Tis the ambient temperature,˙Tis the change rate of temperature,ρis the density,c pis the heat capacity,σis the stress,˙εPis the plastic strain rate,kis the coefficient of thermal expansion,Eis Young’s modulus,vis Poisson’s ratio,and˙εeis the elastic strain rate.
The dynamic compression process can be regarded as an adiabatic condition due to its rapid process[16],the heat loss through conduction approximately equals to zero.Ignoring the temperature rise of the elastic deformation,the equation of the temperature rise during plastic deformation was summarized by Guzman et al.[17],as shown in Eq.(2).Liu et al.[18]simplified the solving equation on the basis of previous research,as shown in Eq.(3)

In Eq.(2)εpis the plastic strain,and in Eq.(3)Wis the plastic work.Combining Eq.(2)to Eq.(3),the coefficient of plastic work converted to heat can be obtained,as shown in Eq.(4)

2.2 Dynamic compression test
First of all,the square shape samples were machined from the 7075-T651 aluminum alloy bar by wire electrical-discharge cutting.The length of a side of cross-section is 3 mm,and the thickness of the sample is 5 mm.A square shape sample was adopted because the concentrated light should be on a flat surface,such as the square side of the sample,which facilitated the collection of infrared rays and the response of the detector.It must be noted that the surface for temperature measuring should be properly polished so as to ensure consistent roughness,and consistent infrared emissivity to the largest degree[19],and improve the experimental accuracy.In the dynamic compression experiment,the SHPB system of the Impact Dynamics Laboratory,Institute of Mechanics Chinese Academy of Sciences was adopted.According to the one-dimensional elastic stress wave theory,the recorded incident and transmitted signals can be used to calculate the engineering stress,the engineering strain rate and the engineering strain,


whereσs(t)is the engineering stress,˙εs(t)is the engineering strain rate,εs(t)is the engineering strain,Eis Young’s modulus of bars,Cis the longitudinal wave velocity of bars,Ais the cross-sectional area of the loading bars,AsandL sare the cross-sectional area and thickness of a sample.By controlling the striking velocity,the nominal strain rates of four group experiments were 1000,2000,3000,4000 s−1,respectively.
2.3 Infrared system and calibration
The main components of the infrared temperature measurement system include an infrared detector,an optical system,a pre-amplifier,a laser device,and an electronic oscilloscope.
One array HgCdTe infrared detector produced by Judson Company was used in the experiment.Its model number is J15D12-M204-S01 M-60.The main parameters are listed in Table 2.In the previous research,the same or similar infrared detector has been widely used[5–7,12,18].
Infrared optical systems can transmit infrared light to the detector.For an infrared optical system,it is necessary to adjust its magnification in an easier way.The scheme adopted the single gold-plated parabolic mirror as the infrared optical system,which could implement the regulation of magnification times by adjusting the center distance among the sample,detector and reflector.The magnification was approximately equal to 1 in the present paper.
The pre-amplifier magnified the electrical signal produced by the infrared detector.In the present paper,the pre-amplifier was the model of PA-101.The bandwidth of it was from10 Hz to 1 MHz,its magnification was set to be 1000 times.For the parts of the infrared temperature measurement system,the response time should be 1µs due to the fact that the maximum bandwidth of the pre-amplifier was 1 MHz.
The laser device was calibration illuminant which can provide stable and concentrated infrared.The spectroscope can divide the horizontal infrared light into vertically upward light path and vertically downward light path.
Both of them were used in position correction.During the position correction,the infrared light provided by the laser device would project onto the spectroscope.Then the light was divided into two light paths.The vertically upward light path was used to calibrate the detector position after mirror reflection,and the vertically downward light path was used to calibrate the specimen position.The diagram of optical alignment of the position correction system is shown in Fig.1.
The calibration of the infrared detector is important for accurate temperature measurement.So it is necessary to accurately calibrate the relationship between the sample surface temperature and the output voltage of the temperature measurement system.According to the study of Zehnder et al.[20,21],it was not easy to achieve their relationship through theoretical calculation,because it was difficult to determine the emissivity as well as the proportion of the radiation received by the detector in the total radiation of the sample.Therefore,an experimental method was adopted for calibration.In the paper,in situ calibration was conducted directly in SHPB experiment system to ensure the consistency of calibration and experiment environment.The schematic diagram of the in situ calibration system is shown in Fig.2.
Unlike the embedded thermocouple used in the previous literature[13,18,21],the thermocouple was directly used to measure the temperature on the sample surface in the present paper.A hole was drilled on the edge of the sample,and then the thermocouple was fixed on the sample surface through little screws and slices.The details are shown in Fig.2.A K-type thermocouple was adopted,with the diameter of about 2 mm and temperature measurement ranging from 0 to 500°C.The thermocouple was calibrated by Meteorological Service.A chopper with the set frequency of 100 Hz could periodically keep out the light entering the detector and produce stable AC signals.Once the sample was heated to 200°C with an alcohol lamp,the oscilloscope and chopper started working.The thermocouple and infrared detector could measure the gradually-reducing sample temperature.By combining with thermocouple and infrared detector out-put voltage,the relationship between the infrared detector output signal and temperature could be obtained.The calibration equation and fitting curve are shown in Fig.3.
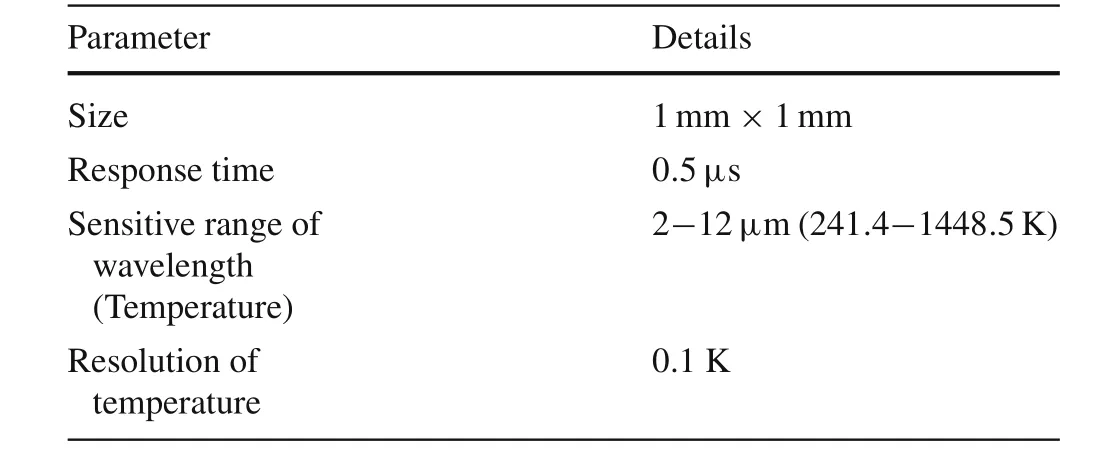
Table 2 Main parameters of the infrared detector
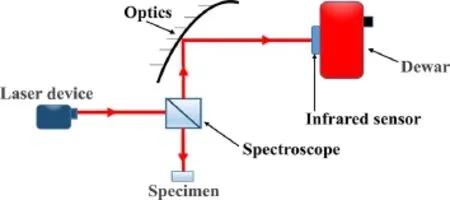
Fig.1 The diagram of the optical alignment
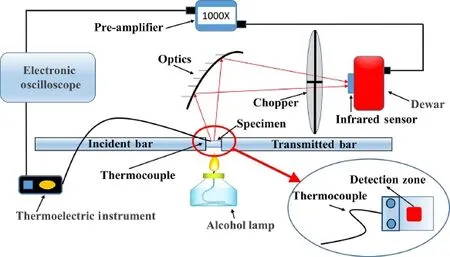
Fig.2 Schematic of the in situ calibration system
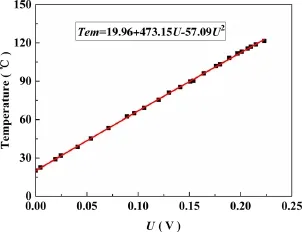
Fig.3 Typical calibration curve between the temperature and the output voltage
3 Experimental results and discussion
3.1 Temperature results
Dynamic compression tests under four groups of strain rates were conducted,and the transient infrared temperature measurement system was constructed to measure the temperature.Figure 4 shows the typical recorded signals of Hopkins on bar strain and the temperature.As can be seen,once the stress wave reaches the sample,and within a very short time the temperature signals begin to jump.By utilizing the calibration equation,the temperature–time curve was obtained,as shown in Fig.5.According to Figs.4 and 5,the temperature of aluminum alloy 7075-T651 rises rapidly during shock compression and becomes stable within about 140µs.
In Fig.5,the trend of temperature rise and temperature rise time of the samples under different strain rates are basically the same.Specifically,the temperature remains basically unchanged over a period of time after temperature rises to the peak.Such a phenomenon is consistent with the reports about the temperature rise of 2024 aluminum alloy and other types of aluminum alloy in Refs.[15,18],which indicates that the mechanism of temperature rise of 7075-T651 aluminum alloy within the range of the experimental strain rate was also the conversation process from plastic work to heat.Liu et al.[18]pointed out that the temperature of TiNi would fall rapidly after it reaches the peak in the unloading process due to the heat absorption of inverse phase transformation.However,there was no rapid temperature drop caused by heat transfer under the experimental condition.Thus,there was no phase transformation in the process of dynamic impact of 7075-T651 aluminum alloy,as shown in the temperature–time curve.
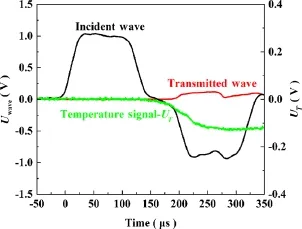
Fig.4 The typical signals of the dynamic compression test
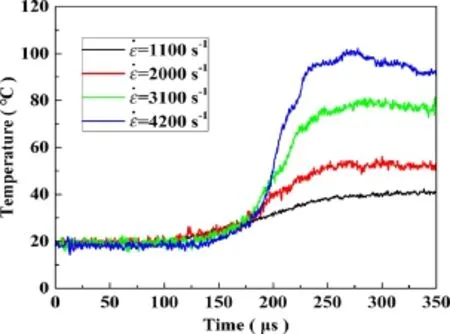
Fig.5 The temperature–time curves under different strain rates

Fig.6 Stress–strain curves and temperature–strain curves
3.2 Stress–strain curve and β value
It is clearly shown in Fig.5 that temperature increases with increasing strain rate;for these four strain rates,the maximum values of the temperature are 35.4,48.5,65.9,92.2°C,respectively.In order to further investigate the plastic work heat conversion coefficient,the stress–strain curves and temperature–strain curves were obtained,as shown in Fig.6.As can be seen from the stress–strain curves,the flow stress of 7075-T651 aluminum alloy increases lightly with increasing strain rate.It indicates positive strain rate effect for this material.The flow stress in each group of strain rate rises relatively slowly,which indicates a weak strain hardening ability for this material.In addition,according to the temperature–strain curves,the temperature is closely related to the loading process,and basically remains the same in the elastic segment;but in the plastic section,the temperature shows a linear increment as a function of strain due to the heat converted by plastic work.At the same time,under the condition of the same strain,the temperature of the groups with a higher strain rate is higher.As a conclusion,the temperature rise in materials is affected by both strain and strain rate.
To quantitatively obtain the relationship between plastic work and temperature rise and reveal the law of work-heat conversion,the values ofβunder different strain rates were obtained by using Eq.(4),whereρ=2810 kg/m3,c p=960 J·(kg ·K)−1were used.The results are shown in Fig.7.
According to the research of Rittle[13],Mason et al.[15],and Follansbee and Frantz[22],many factors(such as inaccurate internal stress, weaker temperature response and more thermal noise within the low strain range dominated by elastic deformation)would cause inaccuracy of the calculation of theβ.The results of this paper also show such a phenomenon.Therefore,Fig.7 only shows the curves within the plastic strain range of 0.04–0.16.
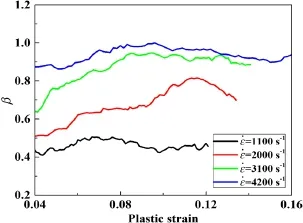
Fig.7 β under different strain rates
There is a large fluctuation in the original waveform of the temperature signals in Fig.6,which would cause large fluctuations of calculation results].Thus,the waveforms need to be smoothed.In Fig.7,βincreases with increasing strain rate;βis only between 0.2 and 0.3 at the strain rate of 1100 s−1,when plenty of the plastic work converts into cold work and later is stored inside the material;it is approaching to 1 at the strain rate of 4200 s−1,when almost all of the plastic work is converted to heat.Such results show that the material has decreasing storage capacity with increasing strain rate,and higher strain rate promotes the conversion of plastic work because the change of the internal structure under high strain rate makes the material lose its ability to be further changed[7,13,23];it should be difficult for the plastic work to continue converting to cold work,and almost all plastic work is converted into heat[24].

Table 3 The key data in this paper
In addition,according to Fig.7,βis not constant in the whole loading process,instead,it first increases and then begins to decrease after reaching the peak under different strain rates.
3.3 Analysis and discussion
(1)In Eq.(4),if the changes during the process of loading were ignored,and only the initial and final states of plastic section as well as the whole plastic section were considered,we could obtain the overall coefficient of the plastic work converted to heat(βA)under the four strain rates.All the key data of these experiments were summarized,as shown in Table 3.βArepresents the proportion of all plastic work converted to heat in the process of the whole impact.As can be seen from Table3,only the group with the4200 s−1strain rate is within the commonly-used range of0.85–1.Obviously,the conclusion is not suitable for aluminum alloy 7075-T6.Moreover,it is also unreasonable to regardβas a constant.
(2)According to Fig.5 and the second column in Table 3,when the strain rate is at 1100 s−1,the maximum temperature rise is only 10.9°C and the peak voltage is also only a dozen or dozens of mV even when 1000 times magnification was adapted.The errors occurred mainly because the inherent thermal noise was close to the signal peak,and the signal noise ratio was relatively low.As for the main solutions,repeated experiments could be conducted after choosing an appropriate amplifier and suitable range.When the strain rate is at 4200 s−1or higher,the change of the surface roughness and curvature caused by significant lateral deformation of the sample contributes the main error sources,and the problem could be partly solved through the optical system with larger depth of field.
4 Conclusions
In this paper,the dynamic compression tests of 7075-T651 aluminum alloy under four groups of strain rates were conducted through the SHPB experimental system,and the stress–strain curves were obtained.Moreover,by setting up a transient infrared temperature measurement system with accurate calibration,the calibration equation of the relationship between the temperature and the output voltage was obtained.By using the temperature measuring system,we successfully measured the temperature signals of samples under impact load,and obtained the plastic work-heat conversion coefficient.Finally,the conclusions obtained in this paper can be summarized as follows.
(1)The characteristics of temperature rise of7075-T651 aluminum alloy are as follows:temperature rise is almost zero at the elastic section,shows linear rising trend at the plastic section,and temperature remains unchanged over a period of time after reaching the peak.The mechanism of temperature rise of7075-T651 aluminum alloy is plastic work-heat conversion,and there is no phase transformation in the process of dynamic impact and other changes that can reduce temperature.
(2)Theβof 7075-T651 aluminum alloy is not constant.Its value increases from0.3 to 0.96 as the strain rate increases from 1100 to 4200 s−1,and is closely related to the loading process,and the peak emerges with increasing strain.The peak may be related to the local strain inside the materials.In the research of the constitutive equation of 7075-T651 aluminum alloy,we should considerβas a function related to the strain rate and strain.
(3)In the process of impact,plastic work has two energy flows,namely,conversion into heat or cold work stored inside the material,which have a competitive relation.Under high strain rate,the energy storage capacity of 7075-T651 aluminum alloy is reduced,because the change of the internal structure under high strain rate makes material lose the ability to be further changed,and almost all plastic work is converted into heat.
AcknowledgementsThis work was supported by the National Nature Science Foundation of China(Grants 11132011 and 11472288).
1.Taylor,G.I.,Quinney,H.:The latent energy remaining in a metal after cold working.Proc.R.Soc.Lond.Ser.A 143,307–326(1934)
2.Shaw,J.A.,Kyriakides,S.:Thermomechanical aspects of NiTi.J.Mech.Phys.Solids 43,1243–1281(1995)
3.Nemat-Nasser,S.,Guo,W.G.:Thermomechanical response of DH-36 structural steel over a wide range of strain rates and temperatures.Mech.Mater.35,1023–1047(2003)
4.Regev,A.,Rittel,D.:Simultaneous transient temperature sensing of impacted polymers using infrared detectors and thermocouples.Exp.Mech.48,675–682(2008)
5.Guduru,P.R.,Singh,R.P.,Ravichandran,G.,et al.:Dynamic crack initiation in ductile steels.J.Mech.Phys.Solids 46,1997–2016(1998)
6.Kapoor,R.,Nemat-Nasser,S.:Determination of temperature rise during high strain rate deformation.Mech.Mater.27,1–12(1998)
7.Macdougall,D.A.S.,Harding,J.:The measurement of specimen surface temperature in high-speed tension and torsion tests.Int.J.Impact Eng.21,473–488(1998)
8.Potdar,Y.K.,Zehnder,A.T.:Measurements and simulations of temperature and deformation fields in transient metal cutting.J.Manuf.Sci.Eng.125,645–655(2003)
9.Guo,Y.B.,Wen,Q.,Horstemeyer,M.F.:An internal state variable plasticity-based approach to determine dynamic loading history effects on material property in manufacturing processes.Int.J.Mech.Sci.47,1423–1441(2005)
10.Farren,W.S.,Taylor,G.I.:The heat developed during plastic extension of metals.Proc.R.Soc.Lond.Ser.A 107,422–451(1925)
11.Campagne,L.,Daridon,L.,Ahzi,S.:A physically based model for dynamic failure in ductile metals.Mech.Mater.37,869–886(2005)
12.Hodowany,J.,Ravichandran,G.,Rosakis,A.J.,et al.:Partition of plastic work into heat and stored energy in metals.Exp.Mech.40,113–123(2000)
13.Rittel,D.:On the conversion of plastic work to heat during high strain rate deformation of glassy polymers.Mech.Mater.31,131–139(1999)
14.Zhang,W.,Xiao,X.K.,Guo,Z.T.:Effect of plastic work-heat conversion rate on a numerical prediction for metal target perforated by blunt projectile.Acta Arma S1,167–171(2010)
15.Mason,J.J.,Rosakis,A.J.,Ravichandran,G.:On the strain and strain rate dependence of the fraction of plastic work converted to heat:an experimental study using high speed infrared detectors and the Klosky bar.Mech.Mater.17,135–145(1994)
16.Bai,Y.L.:Adiabatic shearbanding.Res Mech.31,133–203(1990)
17.Guzmán,R.,Meléndez,J.,Zahr,J.,et al.:Determination of the constitutive relation parameters of a metallic material by measurement of temperature increment in compressive dynamic tests.Exp.Mech.50,389–397(1987)
18.Liu,Y.G.,Tang,Z.P.,Cui,S.T.:Real-time measuring methods for transient temperature under shock loading.Explos.Shock Waves 34,471–475(2014)
19.Vernaza-Peña,K.M.,Mason,J.J.,Li,M.:Experimental study of the temperature field generated during orthogonal machining of an aluminum alloy.Exp.Mech.42,221–229(2002)
20.Zehnder,A.T.,Rosakis,A.J.:On the temperature distribution at the vicinity of dynamically propagating cracks in 4340 steel.J.Mech.Phys.Solids 39,385–415(1991)
21.Zehnder,A.T.,Guduru,P.R.,Rosakis,A.J.,et al.:Million frames per second infrared imaging system.Rev.Sci.Instrum.71,3762–3768(2000)
22.Follansbee,P.S.,Frantz,C.:Wave propagation in the split Hopkins on pressure bar.J.Eng.Mater.Technol.105,61–66(1983)
23.Fekete,B.,Szekeres,A.:Investigation on partition of plastic work converted to heat during plastic deformation for reactor steels based on inverse experimental-computational method.Eur.J.Mech.A53,175–186(2015)
24.Rittel,D.,Wang,Z.G.,Merzer,M.:Adiabatic shear failure and dynamic stored energy of cold work.Phys.Rev.Lett.96,075502(2006)
- Acta Mechanica Sinica的其它文章
- Measurement of the flow structures in the wakes of different types of parachute canopies
- Effect of perforation on flow past a conic cylinder at Re=100:vortex-shedding pattern and force history
- Mobile bed thickness in skewed asymmetric oscillatory sheet flows
- Mechanical properties of gas hydrate-bearing sediments during hydrate dissociation
- A modified multi-objective particle swarm optimization approach and its application to the design of a deep water composite riser
- Reliability-based multidisciplinary design optimization using incremental shifting vector strategy and its application in electronic product design

