The effect of corporate culture on firm performance:Evidence from China
Hilin Zho,Himeng Teng,Qing Wu,*
aSchool of Accounting,Nanjing University of Finance&Economics,China
bLally School of Management,Rensselaer Polytechnic Institute,USA
1. Introduction
Corporate culture is“a set of norms and values that are widely shared and strongly held throughout the organization”(O’Reilly and Chatman,1996;Guiso et al.,2015).In a controversialNew York Timesop-ed,former Goldman Sachs vice president Greg Smith attributes Goldman Sachs’s previous success to its good culture promoting teamwork,integrity and humility,and in his book he blames its transformation from a partnership into a publicly traded company for the disappearance of this culture(Guiso et al.,2015).In a recent survey of 1461 North American CEOs and CFOs,Graham et al.(2017) find that 91%of executives view culture as very important at their firms,and that 78%consider culture as one of the top 3 or 5 factors that affect their firms’value.The authors also point out that empirical evidence on whether and how corporate culture affects firm value and corporate decision making is under explored.
In this paper,we study whether and to what extent corporate culture,as captured by the intensity of corporate culture promotion through the Internet,affects the firm performance of China’s priv1Two types of companies exist in China’s stock trading market:privately listed companies and state-owned firms.Although state-owned firms can be traded in stock exchanges,they are subject to many trading constraints.Usually,only a small portion of shares of state-owned companies can be freely traded.In contrast,privately listed companies in China are closer to what are considered publicly traded firms in the United States.In contrast,most if not all shares of privately listed companies can be freely traded in China’s stock exchanges.Therefore,privately listed companies are public-owned firms,as opposed to state-owned firms.ately listed companies in terms of market performance, financial performance and innovation performance.In China,state-owned companies are controlled by the government,and their cultures are shaped by the political climate.In contrast,privately listed companies are publicly owned and can nurture their own cultures as they wish according to their own characteristics and purposes.Thus,we focus on China’s privately listed companies to study the impact of corporate culture on firm performance.
Aside from anecdotal evidence,prior studies find some empirical evidence that corporate culture affects corporate decision making and firm performance.For example,A her netal.(2015) find that the volume of cross border mergers and the combined announcement returns are lower when countries are more culturally distant in terms of trust and individualism.Corporate culture can also affect corporate reporting behavior.For example,Brag uin sky and Mityakov(2015)argue that firms from developed countries have a culture of transparency,and that foreign-owned companies in Moscow are less likely to misreport their employees’earnings due to this transparency.Overall,both anecdotal and empirical evidence shows the important role that corporate culture plays in corporate behavior and firm performance.
However,culture can take different forms.Firms usually choose topromotecorporate culture according to their firm characteristics.For example,high-tech companies,such as Apple,promote a culture of innovation,while customer-oriented companies,such as Walmart,promote a culture of integrity.Although Apple and Wal mart promote two different cultures,they each promote a culture tailored to their own purposes.It is difficult to say that innovation culture is superior to integrity culture,or vice versa.This is similar to cultures across different countries.Deshpande´and Farley(2004) find that although cultural components differ across countries,the differences of mean and slope for the effect of organizational culture on firm performance across countries are not significant.For example,Japan and the United States may have different types of organizational culture,but neither leads to better performance than the other.
In addition,it has been understood that the relationship between corporate culture and firm performance may be more than a simply direct association,and may be contingent on corporate strategies and environment changes(Sørensen,2002;O’Reilly et al.,2014).For example,integrity may be identified as a firm’s culture,but whether this integrity culture is associated with firm value depends on corporate strategies and specific circumstances(O’Reilly et al.,2014).For example,integrity culture may be important in terms of stock market valuation if the firm’s competitors are known to be fraudulent(e.g.,Greve et al.,2010).Thus,we argue that the strength of overall corporate culture is more important than what kinds of culture firms promote.However,one challenge for empirical studies is how to quantify the strength of corporate culture.It is reasonable to expect that if a firm more publicly promotes and emphasizes its corporate culture,the strength of its corporate culture will be higher.Therefore,in this paper,we try to answer the question of whether corporate cult2To verify that the promotion of certain types of culture does not affect firms’performance in terms of Tobin’s Q or return on assets(ROA),we test the effect of hand-collected specific cultural information,integrity and innovation culture indicated in firms’slogans on firm performance.We find the same results as Guiso et al.(2015):neither integrity culture promotion nor innovation culture promotion significantly affects firm performance.We discuss this in detail later in the paper.ure matters by examining the relation between the corporate culture promotion level and firm performance.
To capture the level of corporate culture promotion,we hand-collect data from Chinese companies’websites in 2014 and conduct a factor analysis.Words are worth nothing if they are not matched by actions;at the same time,good actions without marketing may be underestimated by the market.Thus,in this paper,we measure corporate culture promotion by both words and actions,considering CEO speeches,culture web-pages,employee activ3The measurement of corporate culture promotion is described in detail in the research design section.ities,social responsibility,honors earned,employee training programs,company news and media exposure.
Using factor analysis to measure corporate culture promotion,we find that strong corporate culture promotion has a negative impact on firm value as captured by Tobin’s Q,a positive impact on innovation output as captured by the number of patents and no significant impact on financial performance as captured by ROA.The negative impact of corporate culture promotion on firm value indicates that the capital market does not appreciate corporate culture promotion and regards it as an avoidable expense that firms could allocate to other investments that benefit shareholders.The positive relation between corporate culture promotion and innovation output seems consistent with the prior argument that corporate culture facilitates coordination and cooperation among employees and consequently improves innovation.
In further cross-sectional tests,we find that the negative impact of corporate culture promotion on firm value is driven by small firms and firms located in less developed provinces in China.The results indicate that the relation between corporate culture promotion and firm value is not homogeneous.Specifically,shareholders view corporate culture promotion negatively only for small firms and firms in less developed areas.
We conduct a series of sensitivity tests and find similar results.First,we test the effect of corporate culture promotion on firm performance using the culture page indicator alone instead of the common factor extracted from the eight culture promotion dimensions mentioned above.The culture page is directly related to the promotion of corporate culture because it is a web page dedicated only to nurturing corporate culture.We find consistent results using this culture page indicator.Specifically,we continue to find that corporate culture promotion is negatively associated with firm value,positively associated with innovation output and insignificantly associated with financial performance.Second,we use the number of words on the culture page to proxy for the intensity of corporate culture promotion.More words on a firm’s culture page indicate that the firm puts greater efforts into its culture promotion.We continue to find consistent results with this alternative measure of corporate culture promotion.Third,we aggregate the hand-collected culture indicators and regress firm performance on the natural logarithm of aggregated culture indicators,and find consistent results.
Our paper contributes to the corporate culture literature.To our knowledge,we are the only study besides Guiso et al.(2015)to use theadvertisedvalue on firms’websites to quantify corporate culture promotion.Corporate culture is an abstract concept and is difficult to measure.Firms’websites provide a possible way to transfer this abstract concept to a quantitative measurement.However,our paper differs from Guiso et al.(2015)in that we do not study one specific culture promotion,such as integrity culture.Instead,we study the overall level of corporate culture promotion,regardless of the specific culture promotion,because we believe corporate culture promotion is tailored to a firm’s own purposes.Thus,we also contribute to the corporate culture literature by highlighting that in terms of firm performance,including firm value, financial performance and innovation output,a specific corporate culture does not matter as much as the commitment a firm makes to nurturing whatever corporate culture it chooses,assuming the firm promotes a corporate culture tailored to its needs.
The rest of the paper is organized as follows.Section 2 reviews the related literature.Section 3 describes the data and methodology.Empirical analyses are conducted in Section 4.Section 5 provides a discussion and concludes the paper.
2. Related literature and predictions
2.1. Definition of corporate culture
There is no universal definition of corporate culture.Smircich(1983)categorizes five groups of organizational cultures in her review.This paper does not attempt to resolve the subtle differences between those definitions,but instead attempts to further understand the relationship between corporate culture and firm performance.Thus,we use the same definition of culture as in Guiso et al.(2015):we de fine culture as“a set of norms and values that are widely shared and strongly held throughout the organization”(O’Reilly and Chatman,1996;Guiso et al.,2015).This definition indicates that culture is not only verbally shared but also practically held with actions in a firm.
Similarly,Reichers and Schneider(1990)indicate that“culture implies there is a system of shared norms and values and a set of common practices in an organization.”House et al.(2004)de fine culture“as referring to both norms and practices.”Thus,when we measure culture,we use both marketed culture and practical actions to proxy for corporate culture.Schein(1991)emphasizes that organizational cultures“provide group members with a way of giving meaning to their daily lives,setting guidelines and rules for how to behave,and,most importantly,reducing and containing the anxiety of dealing with an unpredictable and uncertain environment”.This is consistent with the definition of corporate culture in this paper,which is behavioral consistency throughout the company,regardless of the behavioral guidance.
2.2. Corporate culture and firm performance
Corporate culture can benefit performance through three channels:“enhanced coordination and Control within the firm,improved goal alignment between the firm and its members,and increased employee effort”(Sørensen,2002).
First,corporate culture improves efficiency in an organization by enhancing coordination and Control within the firm.Corporate culture helps employees to interact and engage with each other(Jacobs et al.,2013)and thus improves the efficiency of information sharing(Crmer,1993).For example,error management culture facilitates communication about errors and coordination of error handling and thus improves firm performance(Van Dyck et al.,2005).Without a Control system,little would be done in the organization(O’Reilly,1989).The incentive compensation contract is a traditional Control system;however,not everything can be written in this contractex ante.When a traditional Control system fails to regulate employees,corporate culture plays a complementary role in directing employees(Guiso et al.,2015).
Second,corporate culture matters because it motivates employees to commit to common goals(e.g.,Peters and Waterman,1982;Deal and Kennedy,1982;Kotter and Heskett,1992;Sørensen,2002)by complementing traditional incentive systems(Guiso et al.,2015).Corporate culture is closely related to corporate strategy.For example,a corporate strategy to compete on innovation as opposed to price implies a different corporate culture because it attracts different types of employees and establishes different norms to fulfill this goal(O’Reilly,1989).
Third,corporate culture can develop employees’commitment to firms by enhancing their bond with the firm(O’Reilly,1989).For example,corporate culture may influence employees’priorities and encourage them to protect consumers rather than only to seek efficiency(Jacobs et al.,2013).
Barney(1986)illustrates that corporate culture leads to a sustained competitive advantage and thus a sustained financial performance.He focuses on three aspects of corporate culture:valuable,rare and imperfectly imitable.This differs from our definition of corporate culture,as we focus on whether firms have a strong culture promotion regardless of whether their promoted cultures are valuable,rare or imperfectly imitable.In most cases,the promoted cultures we study here do not have any of these characteristics.In extreme cases,it is not necessarily a“good”culture that is promoted.For example,corruption can be a promoted corporate culture if it is“widely shared and strongly held throughout the organization”(O’Reilly and Chatman,1996;Guiso et al.,2015).Sørensen(2002)uses the definition of organizational culture from O’Reilly and Chatman(1996)and investigates the relationship between strong corporate culture and variability of firm performance.He finds that performance variability increases in firms with a strong corporate culture as industry volatility increases.He attributes this result to a strong organizational culture codifying its beliefs and goals and thus forming its own routines,which facilitate internal organizational processes.However,when the environment changes,alternative routines are needed to overcome challenges;therefore,having strong routines becomes a disadvantage rather than an advantage.
Kotter and Heskett(1992) find that firms with strong corporate culture economically outperform those without a strong corporate culture by a large margin.It should be noted that firms with a strong corporate culture emphasize all key stakeholders,including shareholders,employees and customers,while our proxy for corporate culture focuses more on non-shareholder stakeholders,including employees and the community.
However,not all prior studies find a positive association between corporate culture and firm performance.“For example,Denison(1984)found associations between what he categorized as culture and firm ROI,but Gordon(1985)found no associations with either pro fitability or growth”(O’Reilly et al.,2014).
Corporate culture may motivate employees,but it may not be appreciated by other stakeholders,such as shareholders.For example,Bird et al.(2007) find that the market does not always appreciate firms’corporate social responsibility(CSR)activities.In particular,they find that the market does not appreciate firms’environmental investments,and it seems the market is not particularly concerned when firms’activities are in confl ict with the community.On the contrary,the market punishes firms with good CSR activities regarding the environment.
Izzo and diDonato(2012) find that corporate social performance relating to the environment,the community and employment has a negative impact on stock prices in Italy.They conclude that Italian shareholders consider this corporate social performance as an avoidable expense that reduces firm value and therefore discount the stock prices of these firms.
Not all corporate cultures are positive forces(O’Reilly,1989).As we focus on the efforts of corporate culture promotion rather than any specific culture,we do not distinguish good culture,such as integrity,from bad culture,such as corruption.In addition, firms may promote corporate cultures that no longer fit their long-term goals.Many companies,such as Sears,Bank of America and General Motors,have experienced difficulties resulting from their corporate cultures(O’Reilly,1989).Samsung recently decided to change its rigid corporate culture by focusing on converged products and pro fits rather than on growing its4http://www.koreatimes.co.kr/www/news/tech/2015/10/133_187965.html4.business any further because it had experienced low pro fit levels for several years(The Korea Times,2015).In addition,difficulties in mergers and acquisitions are sometimes caused by corporate culture conflict;the failure to merge two cultures can result in a loss of talent and an inability to bene fit from synergy(O’Reilly,1989).When a bad culture is strong,corporate culture can be an obstacle to changing the environment,leading to poor firm performance(Sørensen,2002).
Collectively,a promoted corporate culture motivates employees to work toward corporate goals and thus increases firm value and financial performance.However,shareholders may not value corporate culture promotion,regarding it as an avoidable expense,which can lead to decreased firm value.Furthermore,a bad culture can be an obstacle to reaping bene fits for firms.Therefore,we do not hypothesize the relation between corporate culture and firm performance;rather,we leave it as an open question and empirically test it.
2.3. Corporate culture and innovation output
Innovation is widely regarded as one of the key mechanisms by which corporations sustain and drive business growth in today’s dynamic,globalized and changing technological landscape.For example,Hall et al.(2005)show that innovation is one of the major driving forces of firm value creation.Corporate culture promoting innovations increases creativity through the development of new products and finding new ways to do things.Many corporate cultures(see O’Reilly,1989)nurture norms among employees,and these norms facilitate the innovation process(O’Reilly,1989).In addition,corporate culture facilitates coordination and cooperation among employees.As discussed earlier,corporate culture facilitates employees in interacting and engaging with each other(Jacobs et al.,2013),and it therefore improves the efficiency of information sharing(Crmer,1993)and,consequently, firms’innovation output.Thus,we predict that corporate culture is positively related to a firm’s innovation output.
3. Data and methodology
3.1. Data
We hand-collect data of privately listed companies listed on the Shanghai Stock Exchange and Shenzhen Stock Exchange in 2014 from the companies’websites.There are 1483 companies as of December 31,2013.After deleting companies with missing values in any of the Control variables,we are left with 1044 firms,and we start our website search with these.We categorize information on companies’websites into seven groups,as shown in Table 1:homepage,news,culture page,human resources,company structure,investors’relations and customer services.
The homepage usually includes a speech from the CEO and the company’s history,organizational structure and honors earned.The news section usually includes company news,industry news and media exposure.The culture page mostly tells about the company’s mission,vision,philosophy,core values,strategy,policy,employee activities,internal magazine and social responsibility.In many cases,social responsibility means charity activities.The human resources section includes the hiring philosophy,employee training programs,recruitment information and campus internships.The content of the company structure section varies according to the company’s unique characteristics.The investors’relations section often includes stock price trends,company announcements,periodical reports,company performance and shareholders’rights.Many consumer-oriented firms also have a customer services section.A firm’s website may not include every single category presented here,but the content of any firm’s website can probably be grouped into one of these categories.In addition,we hand-collect a firm’s core value as advertised on its website and construct two dummy variables,IntegrityandInnovation.Integrityequals one if a firm’s core value includes the word“integrity”or some other words with similar meanings and zero otherwise.Innovationequals one if a firm’s core value includes the word“innovation”or other words with similar meanings and zero otherwise.
Other data sources include CSMAR,from which we obtain the firms’ financial information,and CNKI.NET,from which we obtain the firms’patent information.
3.2. Variables
The content on companies’websites that we include in our corporate culture promotion proxy includesCEO speech,culture page,employee activities,social responsibility,honors earned,employee training programs,company newsandmedia exposure.We construct a dummy variable,Speech,which equals one if there is a CEO speech section on a firm’s website and zero otherwise.We choose CEO speech because firms choose their corporate culture and CEOs are likely to promote corporate culture from the top(Graham et al.,2017).CEO speech is a direct way for all stakeholders to understand a firm’s promoted culture that the CEO sets for the company.The culture page is a direct way for a firm to show whether it emphasizes its corporate culture.We construct a dummy variable,Culture Page,which is equal to one if a firm has its own culture page on the website and zero otherwise.
Employee Training Programsnot only improve employees’knowledge about the firm’s operations but also ingrain the promoted corporate culture into employees.Employees can be major embodiments of a firm’s promoted corporate culture.In employee training,the company mission and code of conduct are explicitly and implicitly communicated to employees so that they can follow them in performing their job tasks.Thus,we believe that employee training is a major part of corporate culture promotion.Furthermore,once the CEO sets the tone of the promoted corporate culture,it needs to be infused into employees so that they will embrace the culture;this will eventually facilitate employees’coordination and cooperation.Employee Training Programsare a channel for this;Employee Activitiesare another.Employee Activitiesis constructed to be equal to the number of employee activities on a firm’s website.

Table 1 Companies’website content categories.
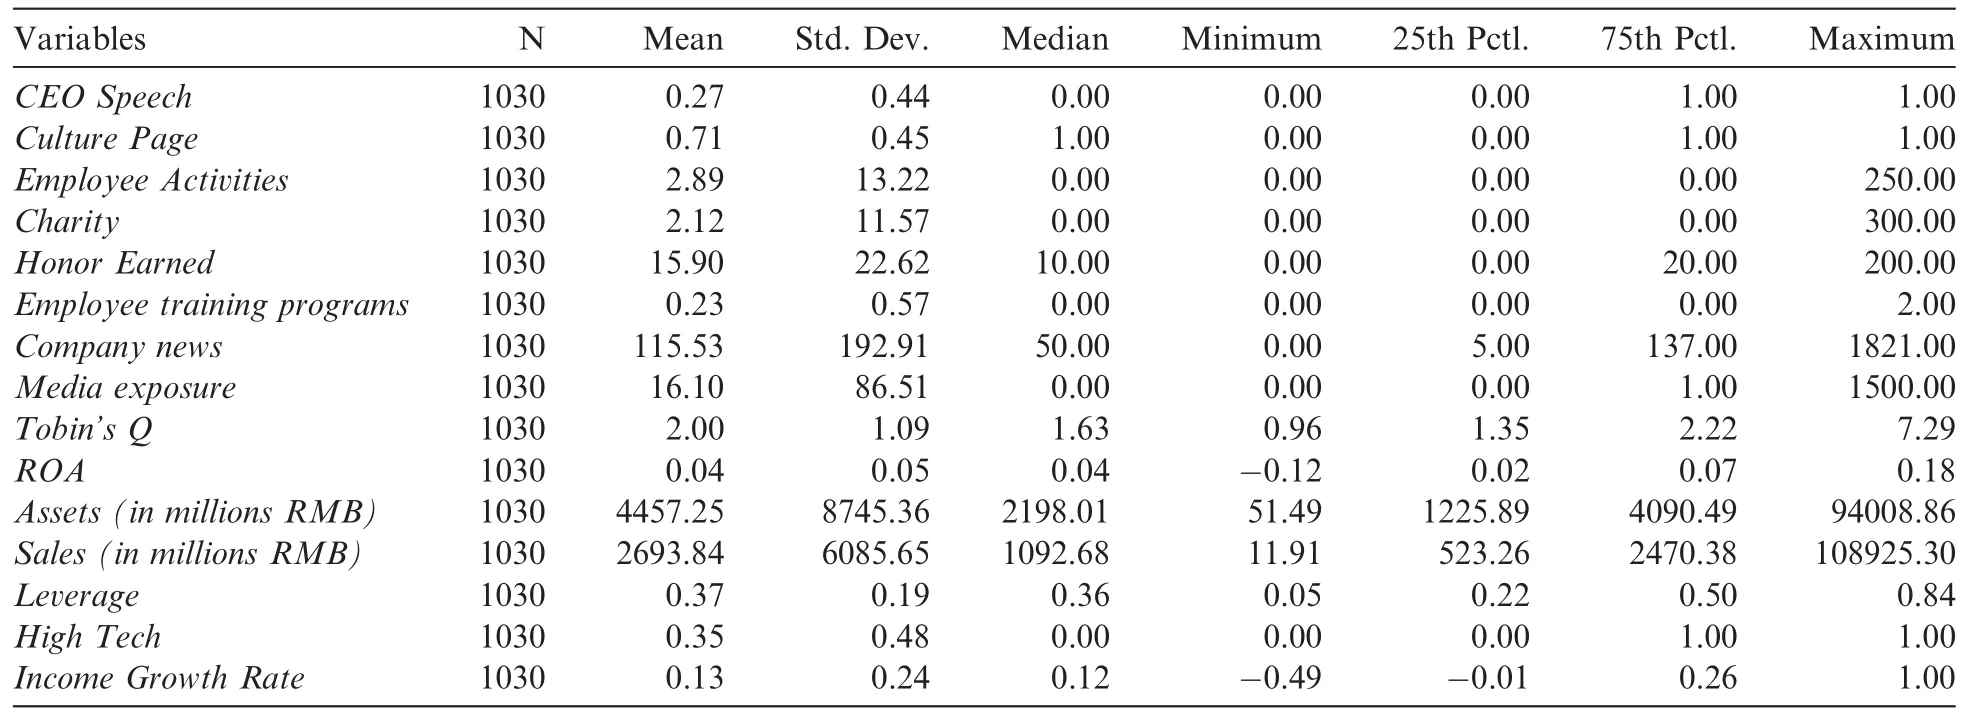
Table 2 Descriptive Statistics.This table presents the descriptive statistics of our sample,1030 firm observations for 2014.CEO Speech is a dummy variable equal to one if a firm’s CEO or Chairman publishes a speech on the firm’s website and zero otherwise.Culture Page is a dummy variable equal to one if a firm has a corporate culture web page and zero otherwise.Employee Activities is the number of employee activities shown on the website.Charity is the number of charity activities shown on the website.Honor Earned is the number of honors a firm earned shown on the website.Employee Training Programs is the number of employee training programs shown on the website.Company News is the number of company news stories shown on the website.Media Exposure is the number of media news stories that a firm is mentioned in and linked to from its own website.Tobin’s Q is the market value of equity over total assets.ROA is net income scaled by assets.Assets is a firm’s total assets.Sales is a firm’s net sales.Leverage is the ratio of debt to assets.High Tech is a dummy variable equal to one if a firm is a high tech company and zero otherwise.We consider firms in the electronic industry,IT industry and biomedical industry as high tech companies.Income Growth Rate is the difference between this year’s net income and last year’s net income scaled by last year’s net income.
Another way to reflect a firm’s promoted culture is to investigate whether it engages in charity activities.Doing so indicates that the firm cares for the community.Thus,we use the number of charity activities on the firm’s website to capture this.Most of these charity activities are donations to the community.The variable constructed isCharity.Honors Earnedis the number of honors a firm exhibits on its website.Examples of honors include“Excellent Company”awards granted by the city,province or state government and“Home for Workers”awards granted by the city,province or state labor unions.Honors Earnedthus represents outside recognition of promoted corporate culture.
Company Newsis the number of news stories a firm reports on its website.This is the firm’s self-reported news,which is reported to communicate with stakeholders.Thus,company news is a channel by which a company can broadcast its promoted culture to its stakeholders,including its employees.We conjecture that companies with strong culture promotion efforts are more likely to post news.Media Exposureis news about a firm reported by the media that the firm links to from its own website.This represents the media’s impressions of the firm,which on the firm website will be positive,as a company can pick media news stories that praise its promoted corporate culture or related activities.When we use factor analysis5In untabulated results,we check the robustness of the factor analysis by excluding three factors,Employee Training Programs,Company News and Media Exposure,from the common factor extraction.We find results consistent with our baseline results.to extract factors with these culture content indicators,we use their natural logarithms if they are not dummy variables.
Three aspects of firm performance are studied: firm market value, financial performance and innovation output.Firm value is captured byTobin’s Q,which is calculated with a firm’s market value over total assets at the end of the 2014 fiscal year.Financial performance is captured byReturn on Assets(ROA),which is calculated as a firm’s net income over total assets.A firm’s innovation output is captured byLog(Patent),the natural logarithm of the number of patents that a firm is granted in the fiscal year of 2014.
The Control variables we use areLog(Assets),Log(Sales),Leverage,High TechandIncome Growth Rate.Log(Assets)is the natural logarithm of a firm’s total assets in the 2014 fiscal year.Log(Sales)is the natural logarithm of a firm’s net sales in the 2014 fiscal year.Leverageis the ratio of debt to total assets.High Techis adummy variable equal to one if a firm is in a high-tech industry and zero otherwise.Income Growth Rateis the difference between net income in 2014 and net income in 2013 scaled by net income in 2013.Summary statistics for all variables are given in Table 2.
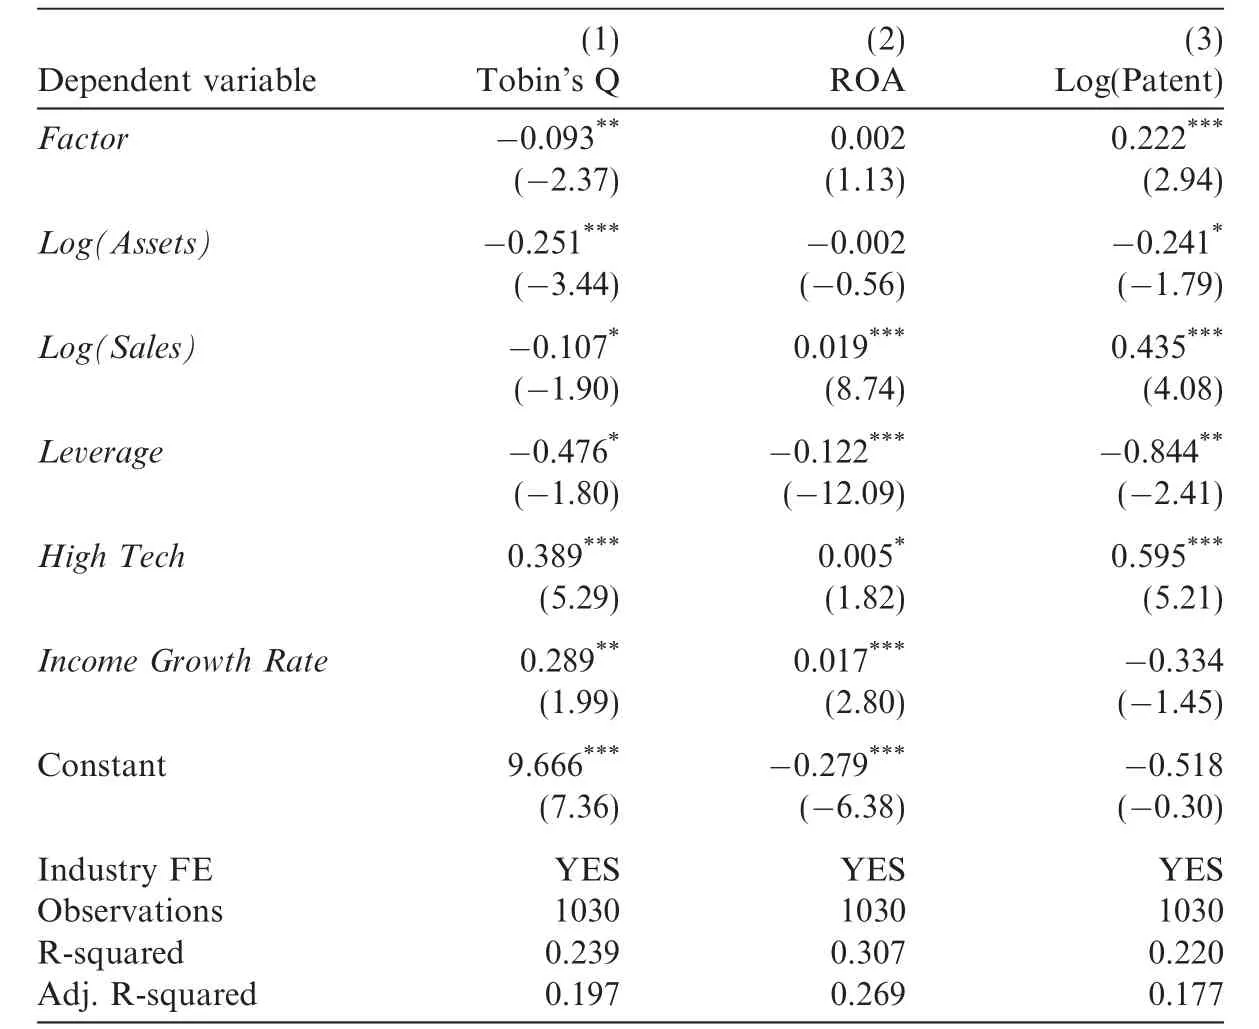
Table 3 Factor analysis:corporate culture promotion and firm performance.This table presents the results of the factor analysis,where the dependent variables are proxies for firm performance,including Tobin’s Q,ROA and Log(Patent).Factor is the common factor extracted from eight indicators including CEO Speech,Culture Page,Employee Activities,Social Responsibility,Honors Earned,Employee Training Programs,Company News and Media Exposure using factor analysis.Detailed de finitions of the Control variables are included in Appendix A.Numbers in parentheses are t-statistics computed using robust standard errors.Industry dummies are included,but the coefficients are omitted for brevity.
4. Multivariate model and results
4.1. Main results
We investigate the impact of corporate culture promotion on firm performance using factor analysis,and our results are shown in Table 3.Our baseline regression model is as follows:

where
Firm Performancei=Tobin’s Q,ROA or Log(Patent);
CorpCulturei=Corporate culture promotion captured with various methods;
aindustry=industry fixed-effects;
Control =Log(Assets)i,Log(Sales)i,Leveragei,High Techi,Income Growth Ratei(see Appendix A for
detailed information).
We first examine the association between corporate culture promotion andTobin’s Qwith factor analysis(Table 3,column 1).We find that the coefficient on corporate culture promotion,Factor,is-0.093,which is statistically significant at the 5%level.Our finding is consistent with that of Bird et al.(2007),who document a significantly negative correlation between two-year excess returns and CSR strength on environmental issues in the United States.Hence,our result indicates that corporate culture promotion has a negative relationship with firm market value.Column 2 shows the results for the association between corporate culture promotion,Factorand financial performance captured byROA.The coefficient is 0.002,which is not significant,indicating that corporate culture promotion has no significant impact on a firm’s profitability performance.This is consistent with Gordon(1985),who finds no association between corporate culture promotion and profitability.
We examine the association between corporate culture promotion,Factorand a firm’s innovation output captured by the natural logarithm of the number of patents that a firm is granted in the year(column 3).The coefficient on corporate culture is 0.222,which is significant at the 1%level,indicating that corporate culture promotion is positively associated with innovation output.The result in column 3 does not contradict our finding in column 1 becauseTobin’s Qcaptures firm market performance from investors’perspective,while patents capture the outcome of coordination and cooperation between employees within the firm.
4.2. Alternative measures for corporate culture promotion
We have documented a negative relationship between corporate culture promotion and firm value,a positive relation between corporate culture promotion and a firm’s innovation output and an insignificant relation between corporate culture promotion and a firm’s profitability.To ensure our results are not sensitive to the culture measure we use to conduct baseline tests,we conduct additional tests with alternative measures for corporate culture promotion.
First,we use the culture page indicator as an alternative proxy for corporate culture promotion.In the baseline model,we extract a common factor from eight aspects of a company’s website,including the culture page indicator.We believe that all eight aspects capture corporate culture promotion to some degree,and the culture page is the most direct indicator because it is a web page that a firm dedicates exclusively to corporate culture.We de fineCulture Pageas equal to one if a firm has a separate webpage dedicated to its corporate culture and zero otherwise.Table 4 presents the results.We find that strong corporate culture promotion as measured by the culture page indicator continues to negatively affect firm value,positively affect a firm’s innovation output and insignificantly affect a firm’s profitability.Collectively,we find consistent results using the culture page indicator as our alternative measure of corporate culture promotion.
Second,we count the number of words on the culture webpage.A large number of words on the culture page indicates that firms put a great deal of effort into promoting their corporate culture.Thus,the number of words is also a direct way to measure a firm’s culture promotion effort.We use both the continuous value of the number of words and the dummy value to repeat the baseline test.Specifically,we de fineLn(1+Words)as the natural logarithm of one plus the number of words shown on a firm’s culture webpage.The number of words is equal to zero if a firm does not have a culture webpage.Culture Words Dummyis an indicator equal to one if the number of words on a firm’s culture page is above its industry median and zero otherwise.Table 5 shows the results.Columns 1 and 2 report the results for firm value.The coefficients on bothLn(1+Words)andCulture Words Dummyare negative and significant at the 5%level.Columns 3 and 4 report the results for ROA.We continue to find an insignificant relation between corporate culture promotion and firm pro fitability.Columns 5 and 6 report the results for innovation output.The coefficients on bothLn(1+Words)andCulture Words Dummyare positive and significant.Collectively,the results remain consistent when we use the culture page length to proxy for corporate culture promotion.
Finally,we use simple counts of the number of culture promotion indicators instead of the factor analysis to investigate the relationship between corporate culture promotion and firm performance.The dependent variables are the same as in our baseline model,includingTobin’s Q,ROAandLog(Patent).The independent variable is the natural logarithm of the number of culture promotion indicators that a firm has,Log(Culture).The results are shown in Table 6.

Table 4 Culture page and firm performance.This table presents the results from the OLS regressions,where the dependent variables are proxies for firm performance,including Tobin’s Q,ROA and Log(Patent).Culture Page is a dummy variable equal to one if a firm’s website contains a page dedicated for culture and zero otherwise.The detailed de finitions of Control variables are included in Appendix A.Numbers in parentheses are t-statistics computed using robust standard errors.Industry dummies are included,but the coefficients are omitted for brevity.
In column 1,the coefficient onLog(Culture)is-0.094,and it is significant at the 10%level.This is consistent with our baseline result.Column 2 shows that there is no significant relation betweenLog(Culture)andROA.This is consistent with our factor analysis.Column 3 shows a positive relation betweenLog(Culture)andLog(Patent).The coefficient onLog(Culture)is 0.293,and it is significant at the 1%level.Collectively,the results from the alternative measures of corporate culture promotion are consistent with our baseline results.
4.3. Cross-sectional tests
We further test whether there are cross-sectional differences in terms of the effect of corporate culture promotion.First,we test whether there is a size effect.We conjecture that promoted corporate culture facilitates collaboration and cooperation between employees.Thus,large firms may bene fit more from strong corporate culture promotion efforts than small firms.In other words,we predict that the negative effect of corporate culture promotion may be driven by small firms.Small firms achieve efficient collaboration and cooperation more easily,but they do not enjoy the marginal benefit of corporate culture promotion through improved collaboration and cooperation.Given the relatively fewer economic resources of small firms,spending too much on corporate culture promotion could be viewed as wasting resources by shareholders,who may prefer small firms to spend their resources on investments with positive net present values(NPVs)to increase firm value.
Table 7presents the results.We categorize firms as large(Large)if their size is above the median of the sample.In column(1),we find that the negative effect of strong corporate culture promotion is driven by smallfirms.Speci fically,we find a negative coefficient onFactor,and it is significant at the 1%level.The coefficient on the interaction term betweenFactorandLargeis positive and significant at the 5%level.The sum of the coefficient onFactorand the coefficient on the interaction term betweenFactorandLargeis not significantly different from zero.The results indicate that corporate culture promotion negatively affects a small company’s firm value but does not significantly affect a large company’s firm value.
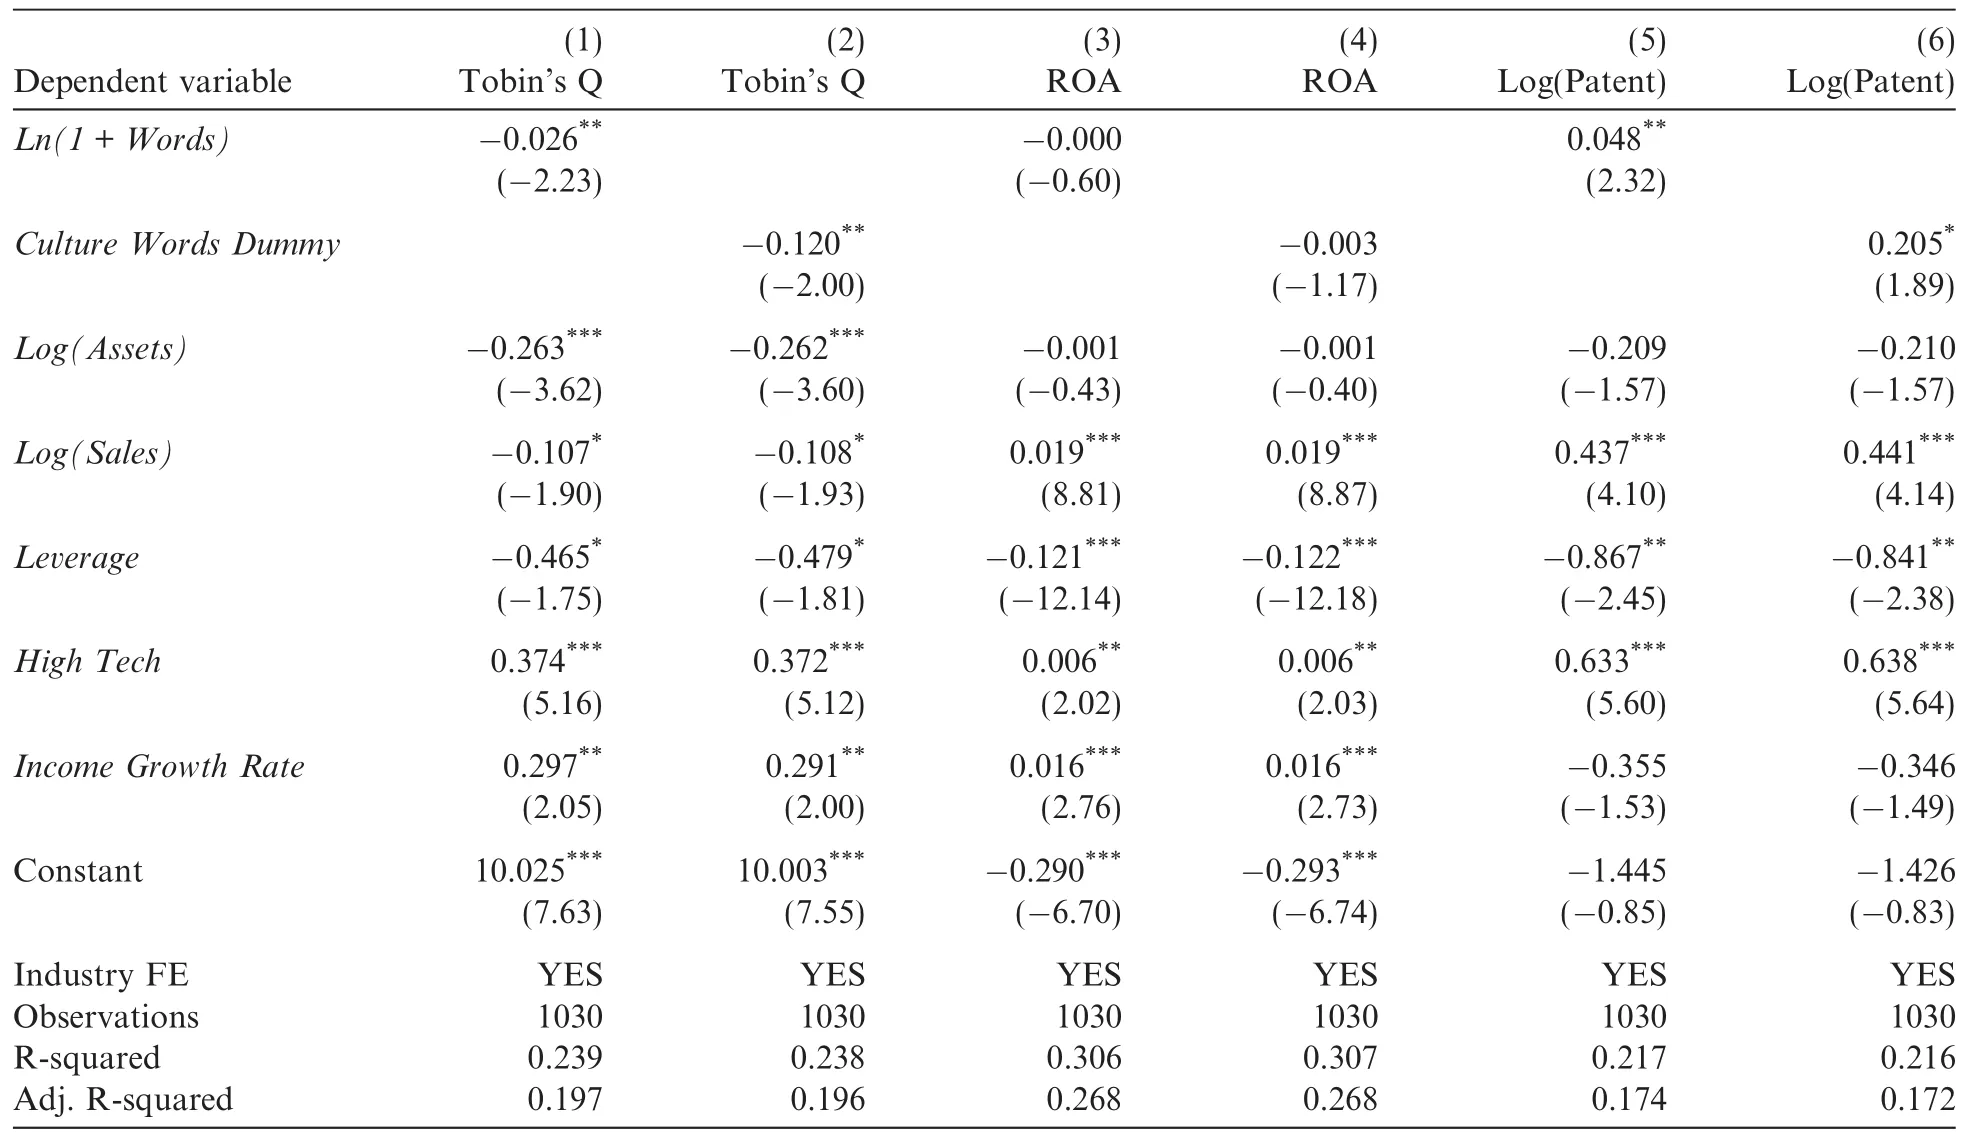
Table 5 Culture page length and firm performance.This table presents the results from the OLS regressions,where the dependent variables are proxies for firm performance,including Tobin’s Q,ROA and Log(Patent).Ln(1+Words)is the natural logarithm of one plus the number of words in a corporate culture page.Culture Words Dummy equals one if the number of words in a firm’s culture webpage is above the industry median and zero otherwise.The detailed de finitions of the Control variables are included in Appendix A.Numbers in parentheses are t-statistics computed using robust standard errors.Industry dummies are included,but the coefficients are omitted for brevity.
Column 2 shows that corporate culture promotion has no size effect on firm profitability.Column 3 reports a positive coefficient onFactorwhen innovation output is the dependent variable,and it is significant at the 1%level.However,the coefficient on the interaction term betweenFactorandLargeis not significant.This indicates that strong corporate culture promotion positively affects a firm’s innovation output regardless of a firm’s size.
We also conjecture that there may be a cross-sectional difference in the effect of corporate culture promotion depending on where the firms are located.Firms located in less developed areas may have less access to capital to fund their projects.Thus,instead of using existing funding to promote corporate culture,shareholders may think that it is more important for firms to invest in more tangible projects with positive NPVs.Therefore,we predict that the negative impact of corporate culture promotion is driven by firms located in less developed areas.
We use a province-level market development index to separate firms in more developed areas from those in less developed areas.High_Devis equal to one if a firm is located in a province with a market development level in the top tercile and zero otherwise.Table 8 presents the results.As shown in column 1,we find a negative coefficient onFactor,and it is significant at the 1%level.The coefficient on the interaction term betweenFactorandHigh_Devis positive and significant at the 1%level.In an untabulated result,we find that the sum of the coefficient onFactorand the coefficient on the interaction term betweenFactorandHigh_Devis not statistically significantly different from zero.Thus,the results indicate that the negative effect of corporate culture promotion on firm value is driven by firms located in less developed provinces of China.
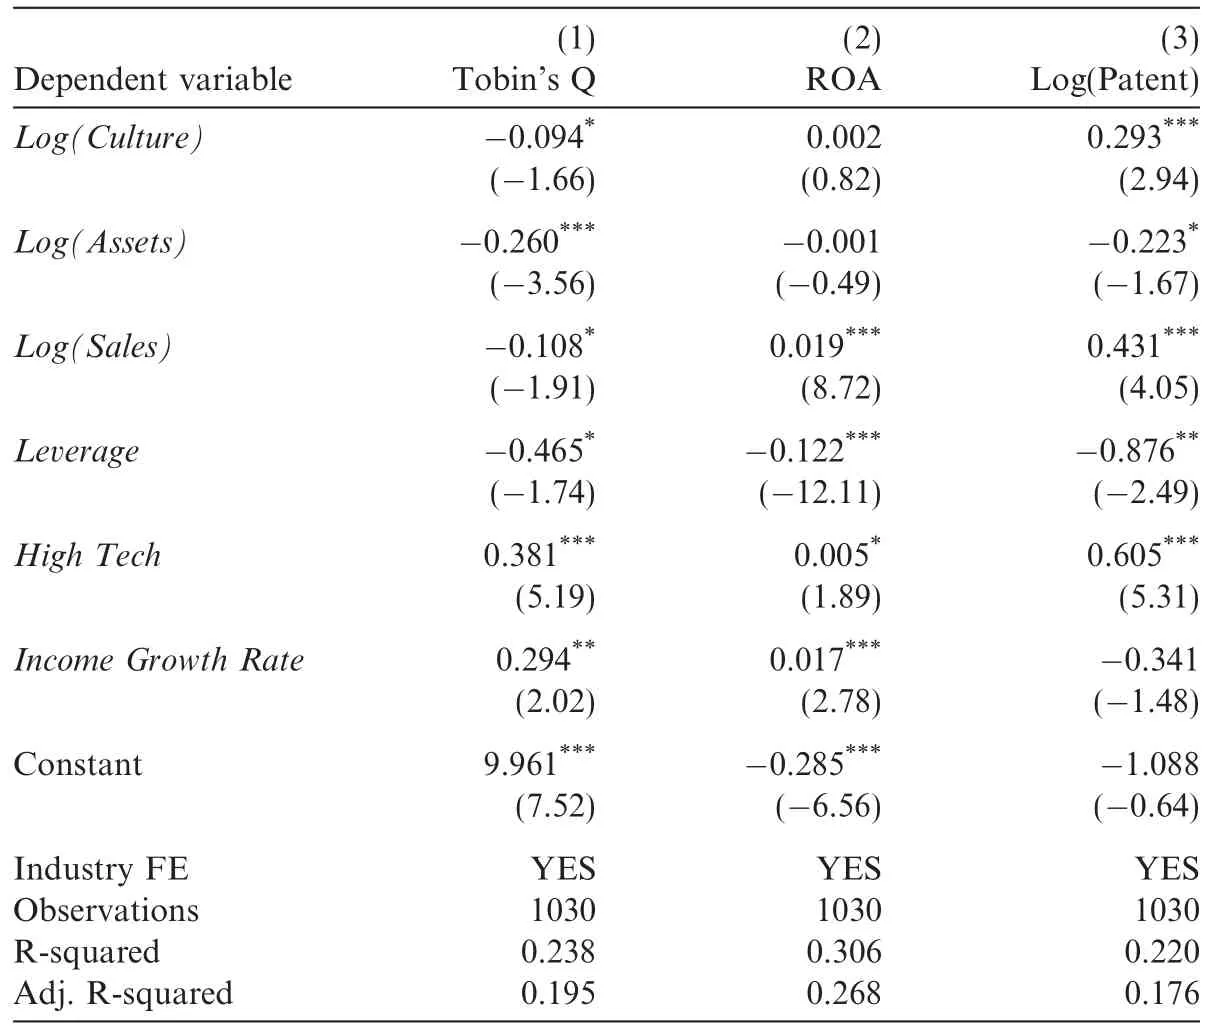
Table 6 Sensitivity test:corporate culture promotion and firm performance.This table presents the results from the OLS regressions,where the dependent variables are proxies for firm performance,including Tobin’s Q,ROA and Log(Patent).Log(Culture)is natural logarithm of the number of culture indicators that a firm has.Culture indicators include(1)whether there is an executive’s speech on a firm’s website,(2)whether there is a culture webpage,(3)whether the number of a firm’s employee activities is in the top quintile,(4)whether the number of a firm’s charity activities is in the top quintile,(5)whether the number of a firm’s honor certificates is in the top quintile,(6)whether the number of a firm’s training programs is in the top quintile,(7)whether the number of a firm’s company news stories on the website is in the top quintile and(8)whether the number of a firm’s media news stories on the website is in the top quintile.The detailed definitions of Control variables are included in Appendix A.Numbers in parentheses are t-statistics computed using robust standard errors.Industry dummies are included,but the coefficients are omitted for brevity.
Column 2 shows that there is no cross-sectionally different effect of corporate culture promotion on firm profitability.Column 3 reports a positive coefficient onFactorwhen innovation output is the dependent variable,and it is significant at the 5%level.However,the coefficient on the interaction term betweenFactorandHigh_Devis not statistically significant.This indicates that corporate culture promotion positively affects a firm’s innovation output regardless of the firm’s location.
4.4. Additional tests
To make our result comparable with those of Guiso et al.(2015),we create the dummy variablesIntegrityandInnovationto capture the specific perspectives of corporate culture promotion.TheIntegritydummy isequal to one if the core value of integrity is advertised on a firm’s website and zero otherwise.Similarly,theInnovationdummy is equal to one if the core value of innovation is advertised on a firm’s website and zero otherwise.Table 9 reports the results.

Table 7 Cross-sectional test:size effect.This table presents the results from OLS regressions with factor analysis,where the dependent variables are proxies for firm performance,including Tobin’s Q,ROA and Log(Patent).Factor is the common factor extracted from eight indicators including CEO Speech,Culture Page,Employee Activities,Social Responsibility,Honors Earned,Employee Training Programs,Company News and Media Exposure using factor analysis.Large is a dummy variable equal to one if a firm’s size is above the median of the sample and zero otherwise.The detailed definitions of the Control variables are included in Appendix A.Numbers in parentheses are t-statistics computed using robust standard errors.Industry dummies are included,but the coefficients are omitted for brevity.
As shown in columns 1 and 2,consistent with Guiso et al.(2015),we find that neitherIntegritynorInnovationis significantly associated with firm value,as captured byTobin’s Q,or with firm profitability,as captured byROA.Guiso et al.(2015)attribute this result to the culture advertised targeting only customers,consisting of only talk and having no correlation with either firm value or financial performance.However,taking this analysis and our previous factor analysis together,the results indicate that what in fl uences a firm’s performance is not any specific culture promotion,but whether the firm makes a strong culture promotion effort.If the corporate culture advertised had no correlation with firm value,we would not find a significantly negative relation between our different proxies for corporate culture promotion and firm value.However,the negative association indicates that shareholders do not appreciate corporate culture promotion.
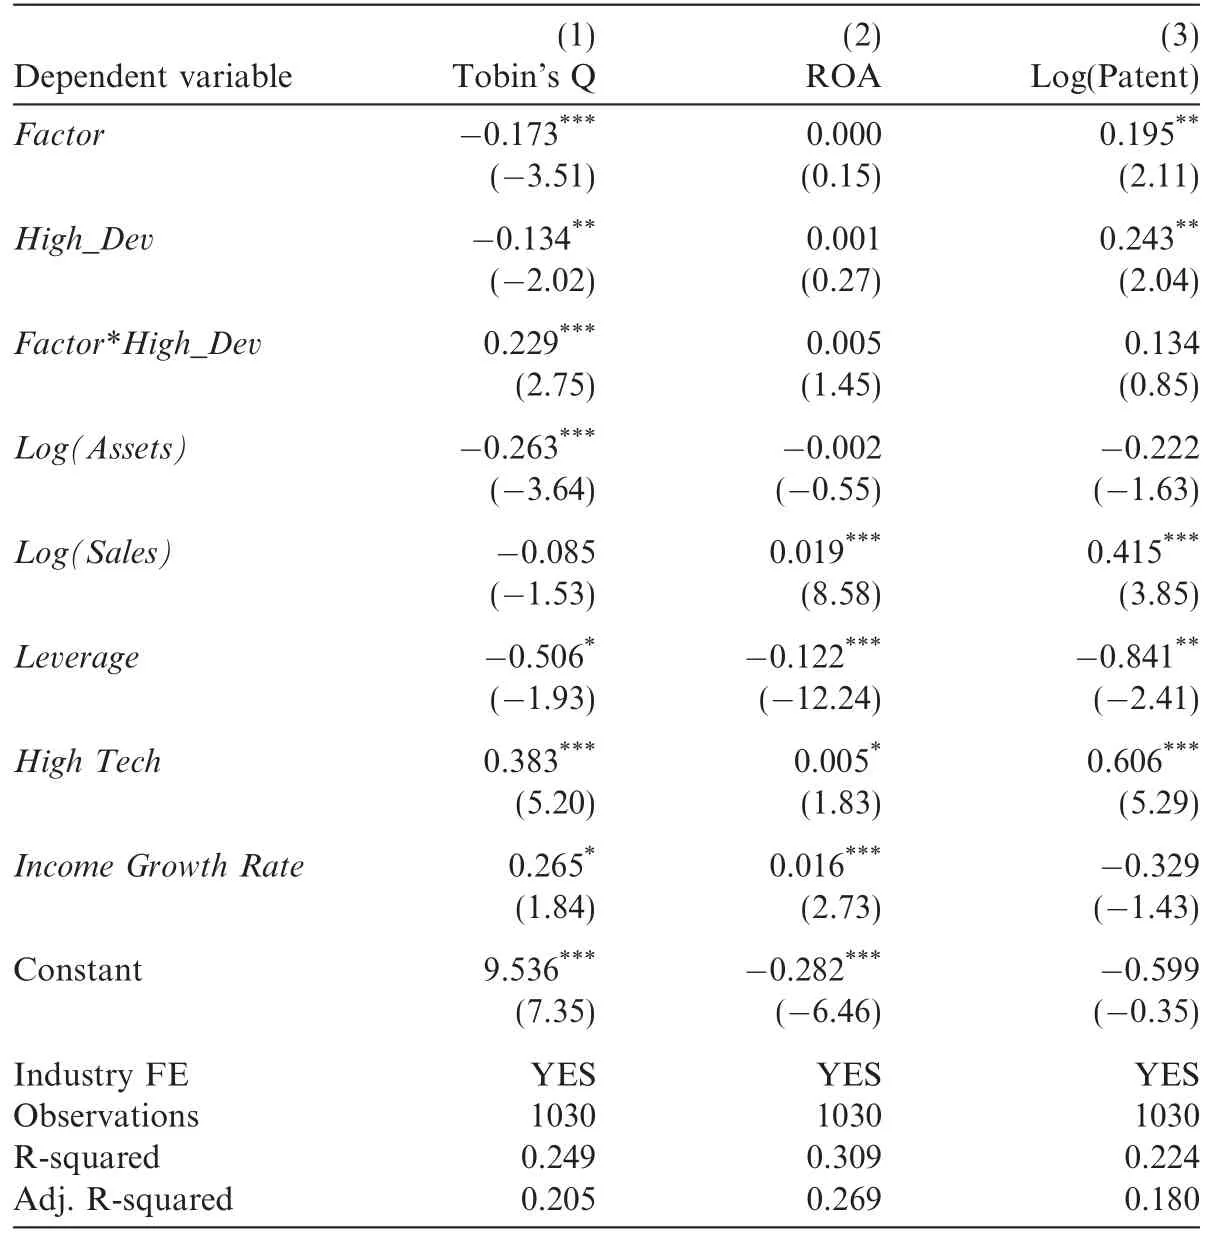
Table 8 Cross-sectional test:market development level.This table presents the results from the OLS regressions with factor analysis,where the dependent variables are proxies for firm performance,including Tobin’s Q,ROA and Log(Patent).Factor is the common factor extracted from eight indicators including CEO Speech,Culture Page,Employee Activities,Social Responsibility,Honors Earned,Employee Training Programs,Company News and Media Exposure using factor analysis.High_Dev is a dummy variable equal to one if a firm is located in a province with a top tercile market development level and zero otherwise.The detailed de finitions of the Control variables are included in Appendix A.Numbers in parentheses are t-statistics computed using robust standard errors.Industry dummies are included,but the coefficients are omitted for brevity.
In column(3),we report a positive association betweenInnovationculture promotion and a firm’s innovation output as captured by the natural logarithm of the number of patents the firm has in the year,and this association is significant at the 1%level.The result is consistent with our expectation that innovation culture promotes creativity.6However,the endogeneity is salient because firms make their decisions on culture promotion and are likely to tailor their promoted corporate culture to meet their operational needs.For example, firms in the high-tech industry are likely to compete based on innovation,and thus they are likely to choose innovation as their corporate culture.High-tech companies are also likely to have a high number of patents.Although we use the dummy variable High-tech to Control this possibility,there may be other possibilities underlying the endogeneity that we did not consider.In addition,we find that the association betweenIntegrityand a firm’s innovation output is not statistically significant.
Finally,we explore whether corporate culture promotion is associated with other aspects of firm performance.Specifically,we investigate this from the perspectives of employee compensation,earnings manage-ment and real earnings management.Employees’compensation level is captured byCompensation,a ratio of the total payment to employees in the cash fl ow statement over net income in the 2014 fiscal year.EMis calculated following Jones’model(Jones,1991).Following Cohen et al.(2008),Dechow et al.(1998)and Roychowdhury(2006),we calculateReal Earnings Management(Real EM)as the abnormal production cost(R_PROD)minus abnormal operating cash flows(R_CFO)minus abnormal discretionary expenses(R_DISX).7See Cohen et al.(2008)for details on how to construct real earnings management.
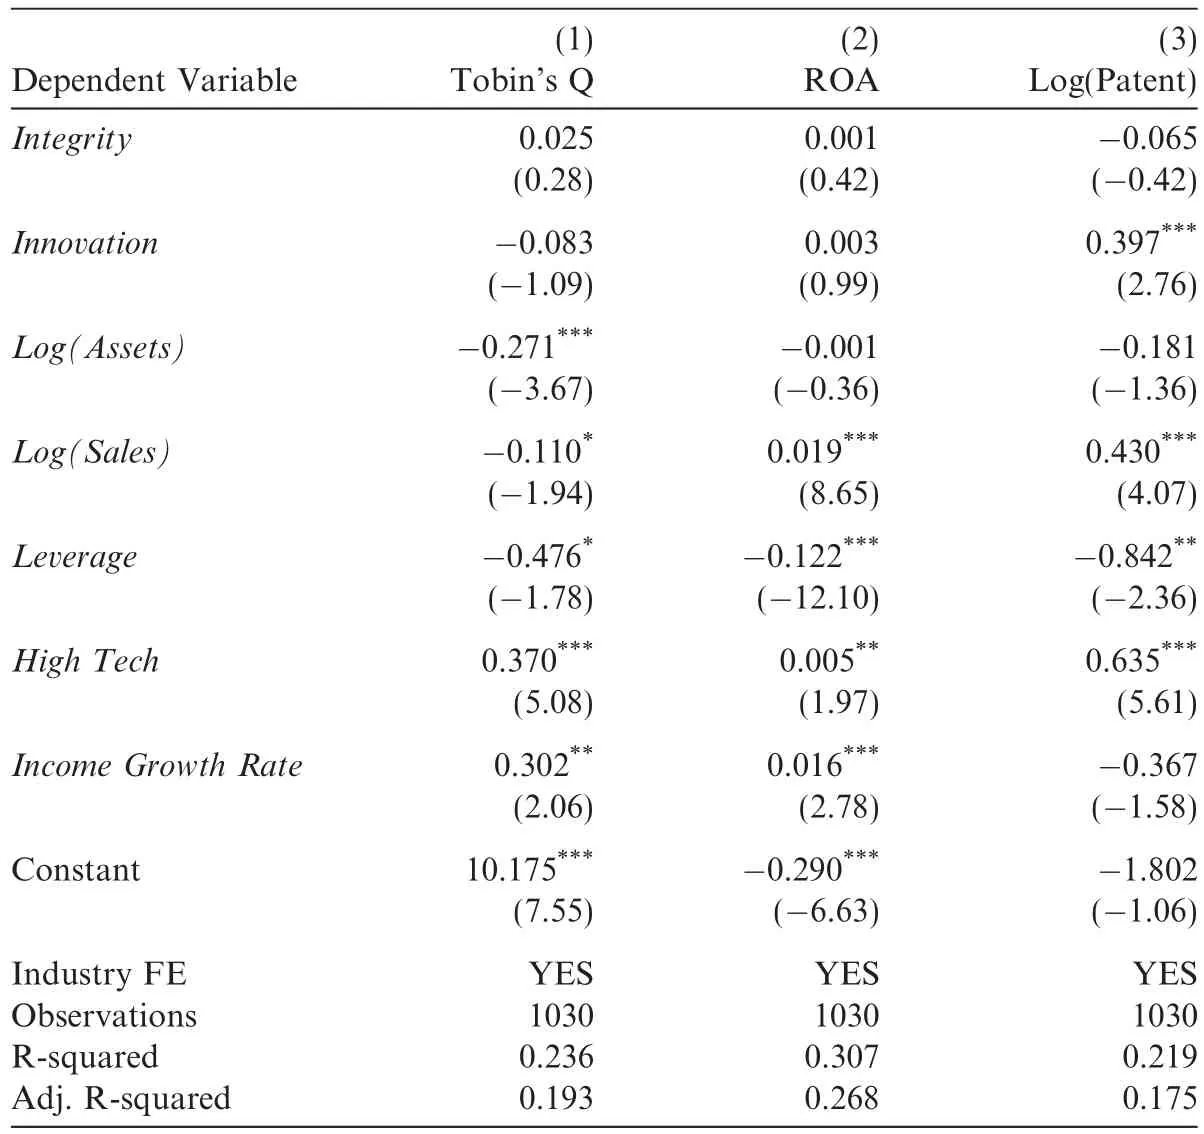
Table 9 Integrity/innovation culture promotion and firm performance.This table presents the results from OLS regressions,where the dependent variables are proxies for firm performance,including Tobin’s Q,ROA and Log(Patent).Integrity is a dummy variable that equals one if integrity culture is advertised on the website and zero otherwise.Innovation is a dummy variable that equals one if innovation culture is advertised on the website and zero otherwise.The detailed de finitions of the Control variables are included in Appendix A.Numbers in parentheses are t-statistics computed using robust standard errors.Industry dummies are included,but the coefficients are omitted for brevity.
Table 10 presents the results.The dependent variables areCompensation,EMandReal EMin the three columns,respectively.The coefficients onFactorare insignificant in the first two columns but negative and significant at the 10%level in column 3.This suggests that culture promotion is not related to employee compensation or discretionary accruals but is negatively associated with real earnings management.
5. Discussion and conclusion
Corporate culture is an important topic and an under-studied area in accounting.In this paper,we use hand-collected data from the websites of China’s privately listed firms to capture corporate culture promotionin terms of the culture webpage,the number of words and media news stories on the websites.We provide evidence that corporate culture promotion is significantly negatively related to firm value,which is consistent with Bird et al.(2007),indicating that shareholders do not value firms’commitment to employee relations and community.We also provide evidence that corporate culture promotion is significantly positively related to a firm’s innovation output,indicating that corporate culture promotion facilitates coordination and cooperation between employees and consequently improves innovation.
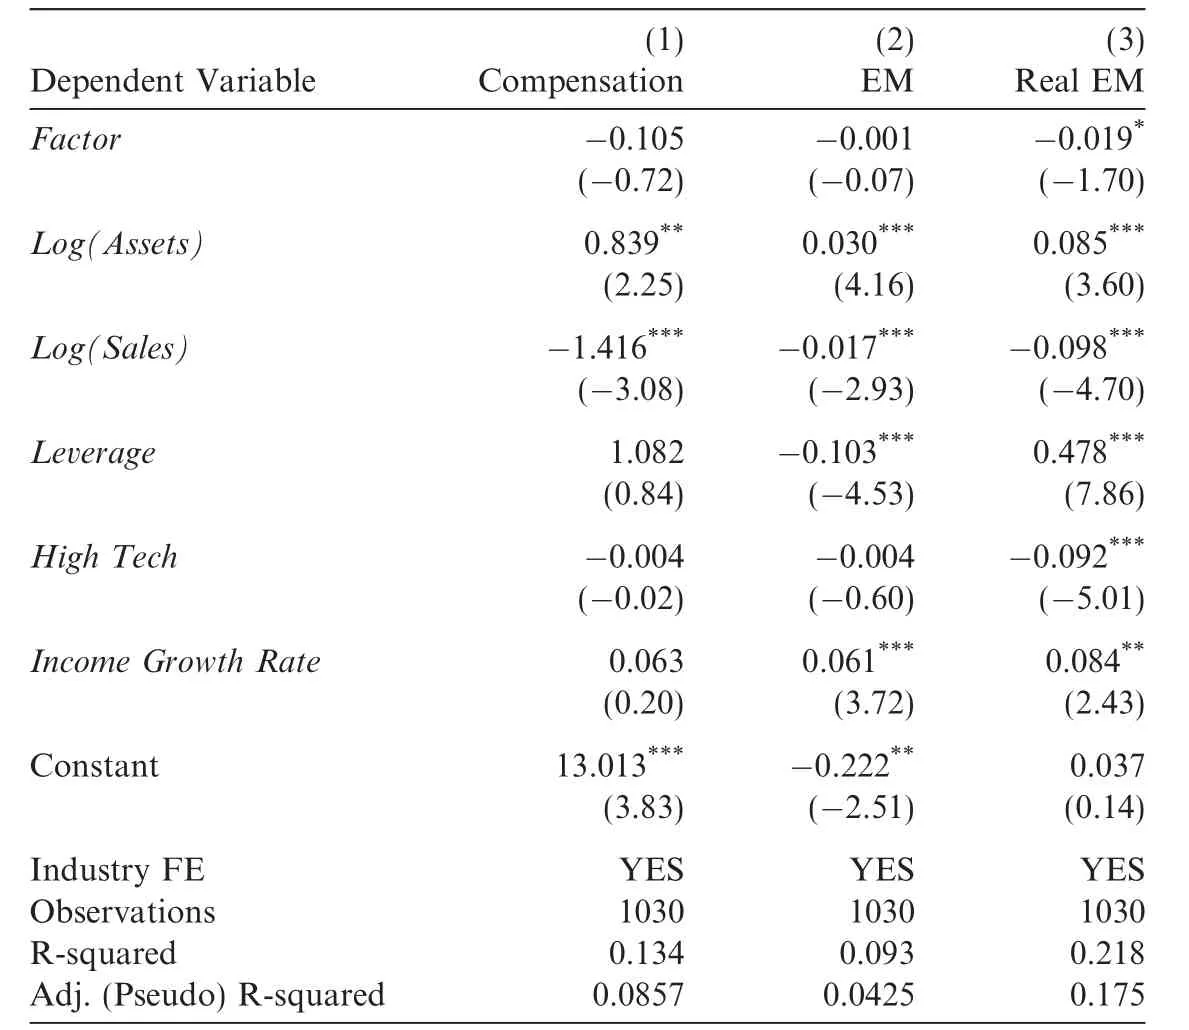
Table 10 Factor analysis:corporate culture promotion and other firm performance.This table presents results from the OLS regressions with factor analysis,where the dependent variables are proxies for firm performance,including Compensation,EM and Real EM.Factor is the common factor extracted from eight indicators including CEO Speech,Culture Page,Employee Activities,Social Responsibility,Honors Earned,Employee Training Programs,Company News and Media Exposure using factor analysis.The detailed definitions of the Control variables are included in Appendix A.Numbers in parentheses are t-statistics computed using robust standard errors.Industry dummies are included,but the coefficients are omitted for brevity.
Guiso et al.(2015)use a similar method to measure firms’advertised value to investigate the relation between corporate culture and firm performance for S&P 500 firms in the United States.They find little evidence on the relationship between advertised corporate culture and firm value,which they claim is because the advertised values on firms’websites are only talk.However,there are two other possibilities.First, firms included in the S&P 500 share similar characteristics,which makes them different from other firms.This shared similarity provides little variance between S&P 500 firms,8For example,the mean of managerial integrity within the S&P 500 is 3.9 with a standard deviation of 0.25 in Guiso et al.(2015).leading to corporate culture’s insignificant relationships with firm value and financial performance.Second,corporate culture promotion is a corporate decision determined according to each firm’s unique characteristics and operations.For example,as a hightech company,Apple chooses innovation as its corporate culture,while Walmart,as a consumer-oriented company,chooses integrity as its corporate culture.However,the difference in corporate culture does not nec-essarily make one firm’s performance superior to another.Thus,it is not surprising that Guiso et al.(2015)do not find integrity or any other type of corporate culture to be associated with either firm value or financial performance.
We replicate the test of Guiso et al.(2015)with China’s privately listed companies by constructing dummy variables,IntegrityandInnovation,which are equal to one if the firm’s advertised core value on its website includes integrity or innovation,respectively and zero otherwise.Consistent with Guiso et al.(2015),we find little evidence that specific corporate culture,either integrity or innovation,is associated with firm value or financial performance.However,when we investigate the relationship between overall corporate culture promotion effort and firm value,we consistently find a significant relation.This indicates that corporate culture promotion matters.It is any specific promoted corporate culture,such as integrity,that does not matter because firms choose their own corporate cultures according to their characteristics,and none is superior to another.
Finally,we acknowledge that our study is subject to some limitations.First,we hand-collect data for 2014,and therefore have only website data for investigated firms for the year of 2014.Thus,our test is crosssectional and we are able to establish only an association,not causality,between corporate culture promotion and firm performance.In addition,because of data limitations,we are only able to test the relationship between corporate culture promotion and contemporary firm performance,and not long-term firm performance.Second,our paper suffers from potential self-selection bias.Corporate culture promotion is a firm’s decision,and a firm’s performance is also influenced by its decisions;thus,our study suffers from selfselection bias.Again,our study is only able to establish an association,not causality,between corporate culture promotion and firm performance.Future studies can work to resolve this endogeneity issue.Third,our website-search-based measure of corporate culture promotion may suffer from a measurement error problem.For example,if a firm does not have a dedicated culture webpage,this does not mean the firm has no corporate culture;every firm has its own culture regardless of whether the firm promotes it.In fact, firms with a weaker culture may be more likely to advertise their culture on their websites.Thus,our results could suffer from the measurement error problem.Fourth,Schein(1984,2010)categorizes cultures on three different levels:the first level represents artifacts,such as physical manifestations of corporate culture;the second includes espoused values and beliefs or documented norms;and the third is the basic underlying assumptions by which the first two levels can be truly understood(Taylor,2014).The corporate culture promotion proxy we use falls into the second level of corporate culture;as such,without understanding the underlying assumptions of culture from the third level,our results should be interpreted with caution.
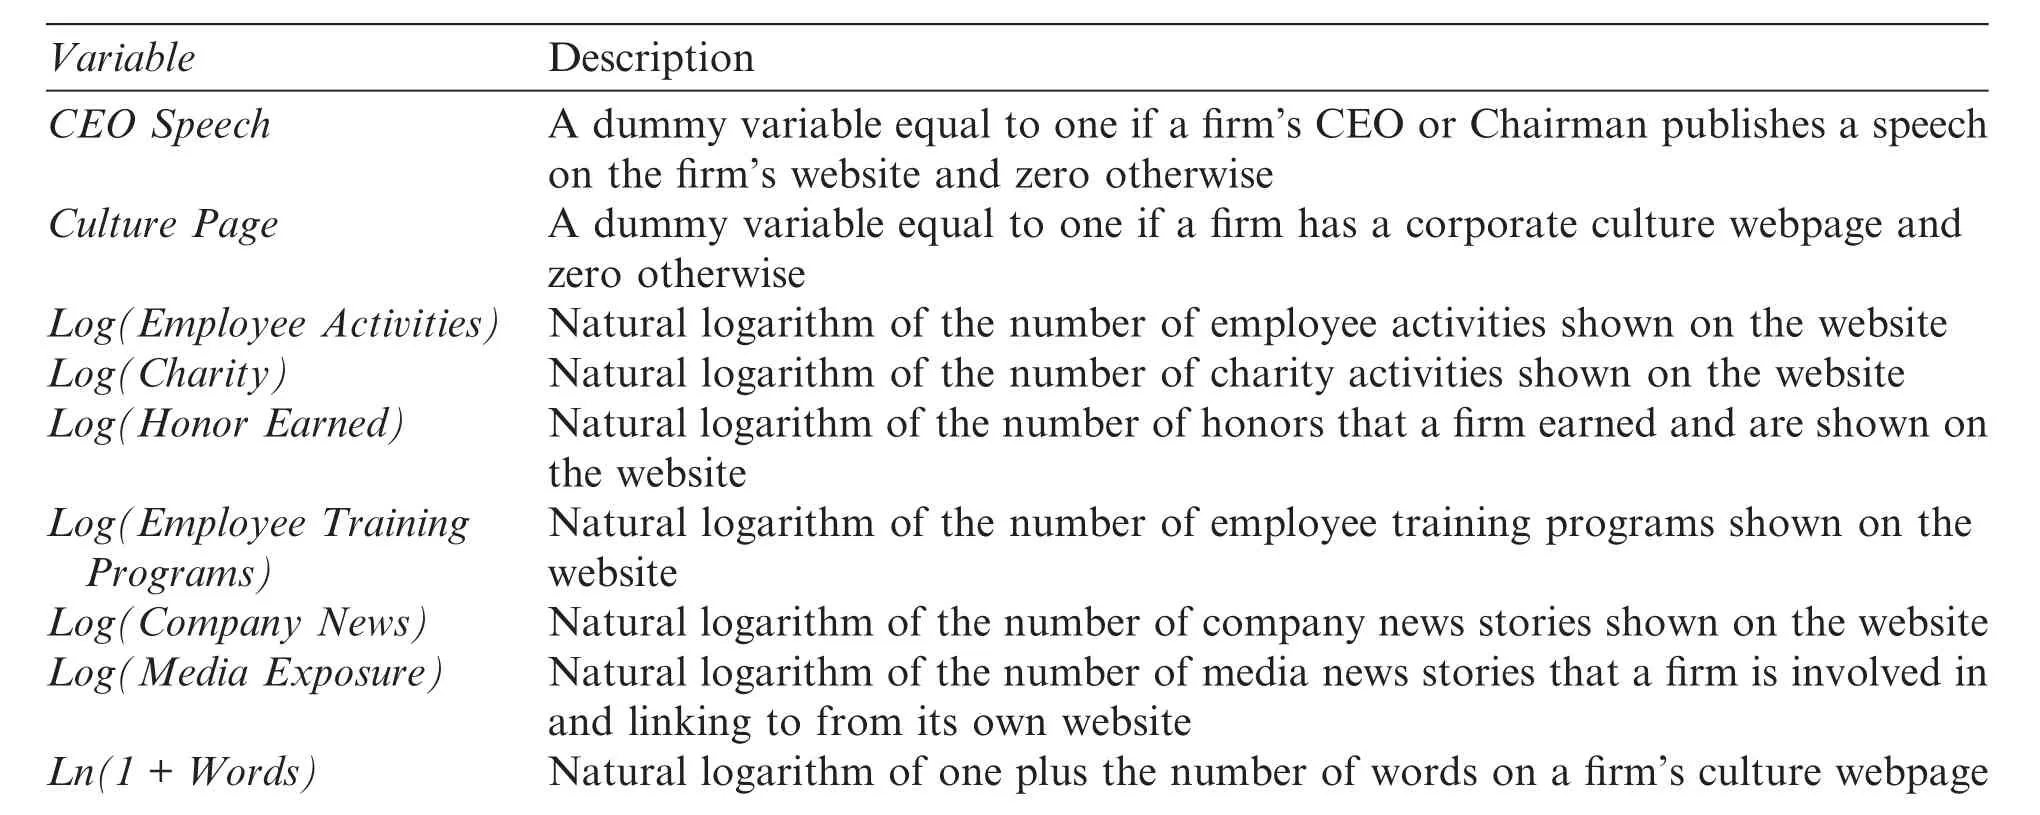
Appendix A.Definitions of variables
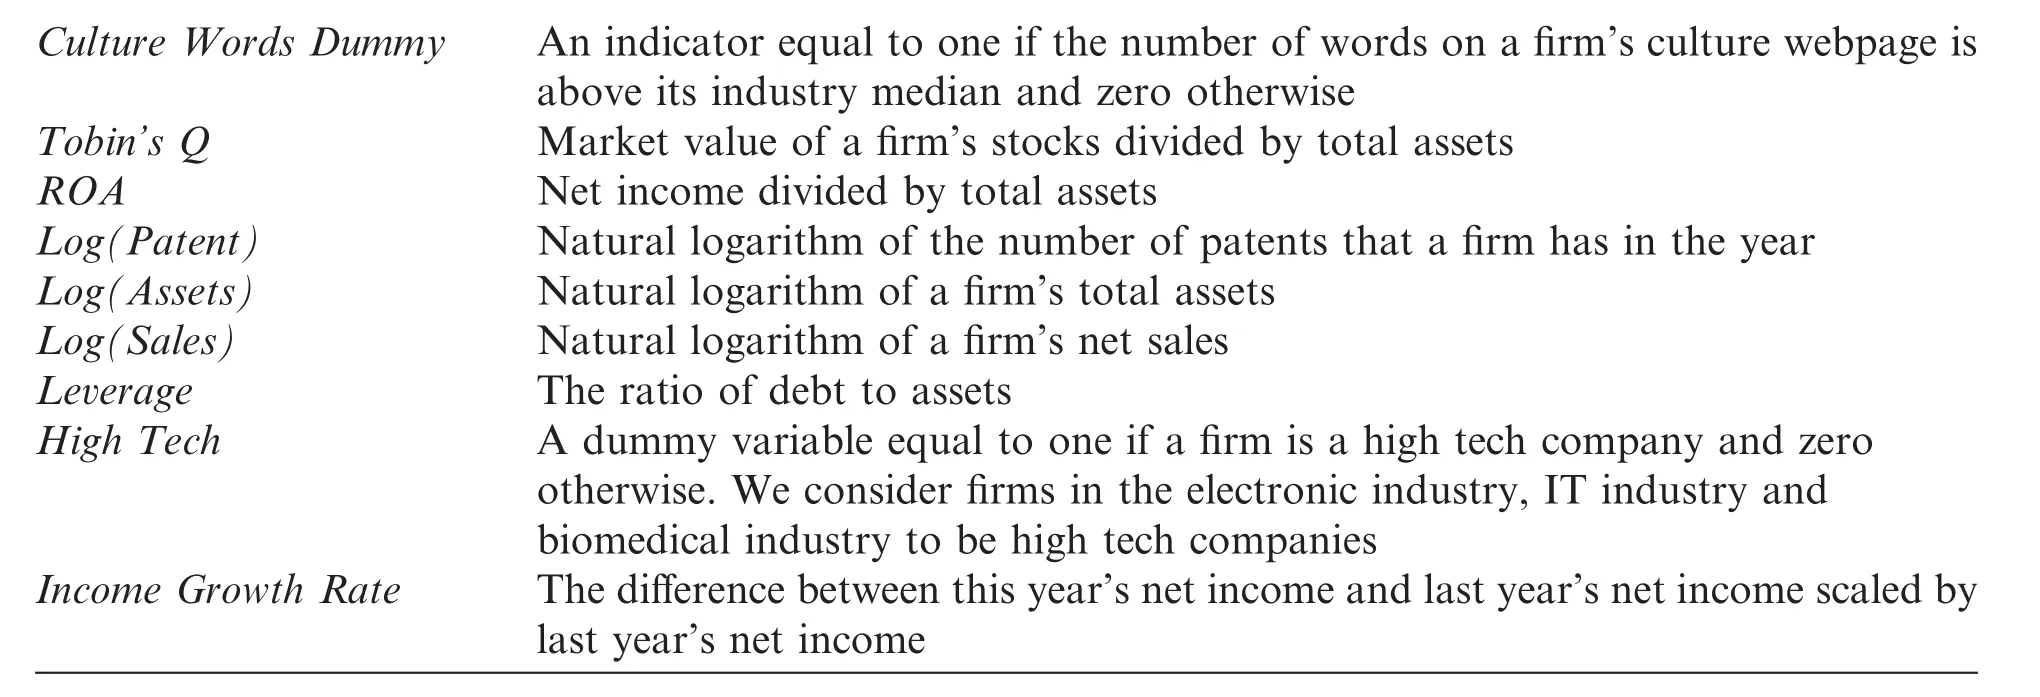
Culture Words DummyAn indicator equal to one if the number of words on a firm’s culture webpage is above its industry median and zero otherwise Tobin’s QMarket value of a firm’s stocks divided by total assets ROANet income divided by total assets Log(Patent)Natural logarithm of the number of patents that a firm has in the year Log(Assets)Natural logarithm of a firm’s total assets Log(Sales)Natural logarithm of a firm’s net sales LeverageThe ratio of debt to assets High TechA dummy variable equal to one if a firm is a high tech company and zero otherwise.We consider firms in the electronic industry,IT industry and biomedical industry to be high tech companies Income Growth RateThe difference between this year’s net income and last year’s net income scaled by last year’s net income
Ahern,K.R.,Daminelli,D.,Fracassi,C.,2015.Lost in translation?The effect of cultural values on mergers around the world.J.Financ.Econ.117(1),165–189.
Barney,J.B.,1986.Organizational culture:Can it be a source of sustained competitive advantage?.Acad.Manage.Rev.11(3)656–665.
Bird,R.,Hall,A.,Moment,F.,Reggiani,F.,2007.What corporate social responsibility activities are valued by the market?J.Bus.Ethics 76(2),189–206.
Braguinsky,S.,Mityakov,S.,2015.Foreign corporations and the culture of transparency:Evidence from Russian administrative data.J.Financ.Econ.117(1),139–164.
Cohen,D.A.,Dey,A.,Lys,T.Z.,2008.Real and accruals-based earnings management in the pre-and post-Sarbanes Oxley periods.Account.Rev.83(3),757–787.
Deal,T.E.,Kennedy,A.A.,1982.Corporate Cultures.Addison-Wesley,Reading,MA.
Dechow,P.M.,Kothari,S.P.,Watts,R.L.,1998.The relation between earnings and cash fl ows.J.Account.Econ.25(2),133–168.
Denison,D.R.,1984.Bringing corporate culture to the bottom line.Organ.Dyn.13,4–22.
Deshpande´,R.,Farley,J.U.,2004.Organizational culture,market orientation,innovativeness,and firm performance:an international research odyssey.Int.J.Res.Mark.21(1),3–22.
Gordon,G.,1985.The relationship of corporate culture to industry sector and corporate performance,Page 125.In:Kilmann,R.H.,Saxton,M.J.,Sherpa,R.(Eds.),Gaining Control of the Corporate Culture.Jossey-Bass,San Francisco,CA.
Graham,J.R.,Harvey,C.R.,Popadak,J.,Rajgopal,S.,2017.Corporate culture:evidence from the field(No.w23255).Natl.Bureau Econ.Res.
Greve,H.R.,Palmer,D.,Pozner,J.E.,2010.Organizations gone wild:the causes,processes,and consequences of organizational misconduct.Acad.Manage.Ann.4,53–107.
Guiso,L.,Sapienza,P.,Zingales,L.,2015.The value of corporate culture.J.Financ.Econ.117(1),60–76.
Hall,B.H.,Jaffe,A.,Trajtenberg,M.,2005.Market value and patent citations.Rand J.Econ.36,16–38.
House,R.J.,Hanges,P.J.,Javidan,M.,Dorfman,P.W.,Gupta,V.(Eds.),2004.Cultures,Leadership and Organizations:A 62 Nation GLOBE Study.Sage,Thousand Oaks,CA.
Izzo,M.F.,di Donato,F.,2012.The relation between corporate social responsibility and stock prices:An analysis of the Italian listed companies.SSRN Working Paper Series,pp.1–36.
Jacobs,R.,Mannion,R.,Davies,H.T.O.,Harrison,S.,Konteh,F.,Walshe,K.,2013.The relationship between organizational culture and performance in acute hospitals.Soc.Sci.Med.76,115–125.
Jones,J.J.,1991.Earnings management during import relief investigations.J.Accounting Res.29,193–228.
Kotter,J.P.,Heskett,J.L.,1992.Corporate Culture and Performance.Free Press,New York.
O’Reilly,C.,1989.Corporations,culture,and commitment:Motivation and social Control in organizations.California Manage.Rev.31,9–25.
O’Reilly,C.A.,Chatman,J.A.,1996.Culture as social Control :corporations,cults,and commitment.Res.Organiz.Behav.18(8),157–200.
O’Reilly III,C.,Caldwell,D.,Chatman,J.,Doerr,B.,2014.The promise and problems of organizational culture:CEO personality,culture,and firm performance.Group Organiz.Manage.39(6),595–625.
Peters,T.,Waterman,R.H.,1982.In Search of Excellence.Harper and Row,New York.
Reichers,A.E.,Schneider,B.,1990.Climate and culture:an evolution of constructs.Organiz.Climate Cult.,5–39
Roychowdhury,S.,2006.Earnings management through real activities manipulation.J.Account.Econ.42(3),335–370.
Schein,E.H.,1984.Coming to a new awareness of organizational culture.Sloan Manage.Rev.25(2),3–16.
Schein,E.H.,1991.The role of the founder in the creation of organizational culture.Organiz.Cult.,14–25
Schein,E.H.,2010.Organizational Culture and Leadership,fourth ed.Jossey-Bass,San Francisco,CA.
Smircich,L.,1983.Concepts of culture and organizational analysis.Adm.Sci.Q.28,339–358.
Sørensen,J.B.,2002.The strength of corporate culture and the reliability of firm performance.Adm.Sci.Q.47(1),70–91.
Taylor,J.,2014.Organizational culture and the paradox of performance management.Public Perform.Manage.Rev.38(1),7–22.
Van Dyck,C.,Frese,M.,Baer,M.,Sonnentag,S.,2005.Organizational error management culture and its impact on performance:a twostudy replication.J.Appl.Psychol.90(6),1228–1240.

