Analyzing Structure and Driving Force of Steel Consumption in China
Chengkang Gao, Hongming Na, Mingyan Tian, Zhou Ye, Zhaoqian Qi
1 State Environmental Protection (SEP) Key Laboratory of Eco-Industry, School of Metallurgy, Northeastern University, Shenyang, 110819, China
2 Department of Civil and Environmental Engineering, University of Michigan, Ann Arbor, MI 48109, United States
1 Introduction
Over the past decades, steel industry has been rapidly developed and growth in China. The crude steel output reached 8.04×10⁸tons in 2015 compared to 1.29×10⁸tons in 2010, which has already accounted for 50.26%in the global crude steel output. Correspondingly, China's steel consumption grew quickly. From 2000 to 2015, steel consumption climbs from 1.41×10⁸tons to 7.01×10⁸tons, increasing by nearly 5.60×10⁸tons(CSY, 2001; CSY, 2016). As the result, China's iron and steel industry has changed from short supply to excess supply (namely, overcapacity) during these years. This problem not only is detrimental to the development of steel industry, but also causes much pressure on environment and resources. If appropriate measures were not taken immediately into the steel industry, it would come to a vicious cycle at the end with a series of terrible problems, like excessive energy consumption and waste pollution. Hereby, the “13thFive-year” Plan of iron and steel industry explicitly proposed the strategic objectives of removing excess capacity and optimizing the industrial structure (MIIT, 2016). Therefore, the prediction of the steel demand and the analysis of the driving force of steel consumption is a crucial project for improving international competitiveness of China’s iron and steel industry and strengthening environmental protection.
These years, most scholars have taken the economic factor as the leading factor or sub sectors to study the steel consumption or others. For example, Huh (2011) examined the long-term and short-term causal relationships between steel consumption and economic activity coupling vector error correction and vector autoregression models in Korea between 1975 and 2008. The results demonstrate that total steel consumption and GDP have a long-term equilibrium relationship. Geyer et al. (2007) presented a detailed account of the supply chain for iron and steel in the UK using material flow analysis, and not only quantified the iron and steel flows through the UK economy, but also explored more elusive flows of scrap generation and recycling. Döhrn and Krätschell (2014) examined the interrelation of steel demand with GDP. The findings show that there seems to be an increase of steel demand in an initial stage of economic development and a decline after economies have reached a certain level of per capital income. Besides, Dahlström and Ekins (2007) analyzed value chain of UK aluminum flows combining economic and environmental dimensions. The findings applies that value chain analysis is a robust methodology for exploring various aspects of the economy-environment interface, and a useful complement to material flow or life cycle analyses, which is a potentially widely application. These studies provided conflicting views on the nature of the relationship between steel consumption and economic growth (Park et al., 2011). However, the impact of steel recycling on steel consumption is less considered in these researches.
Therefore, the content of this paper is organized as following: Firstly, defining the basic concept and the calculation method; and then establishing Chinese steel consumption structure during 2003-2011. Additionally, considering the amount of in-use stock of steel and its average service life-span, productivity per unit inuse stock of steel and steel output per unit GDP, the driving factors of steel consumption are analyzed by mean of factor decomposition. And the steel consumption was simulated up to 2020 by mean of BP neural network combining four driving factors. Finally, according to above analyzing, rational suggestions were concluded. Besides, this paper could provide the scientific basis for steel industry to optimize their production process.
2 Theory and Method
Steel consumption is a very complicated nonlinear system. Firstly, the basic concepts of this study are given.Then, considering economic efficiency resource recovery, steel production and so on, the influencing factors of the consumption are established in this paper. Finally, the back propagation neural network is introduced in order to simulate steel consumption.
2.1 Basic concept
Steel consumption is affected by several factors. This paper selects the following concepts or factors to analyze steel consumption in China, referring to Lu (2005), Lu et al. (2010) and Lu et al. (2013).
(1) Steel consumption (A)
To analyze the consumption structure of steel, the steel consumption industry is divided into six categories,including construction, infrastructure industry, transportation industry, light industry, machinery industry and other industries. Each industry is divided into several sub-categories. Considering the steel consumption coefficient and the steel consumption structure, the steel consumptionAof the six categories is calculated by(Zhang et al., 2007; Wang et al., 2014)

In Eq. (1),Ais the total steel consumption in one year;Aiis the steel consumption from industryiin one year;Aijis the steel consumption from thejthsub-category in theithindustry;aijis the steel consumption per products,xijthe products’ output from thejthsub-category in theithindustry.
(2) Service life-span (Δτ)
Service life-span (Δτ) is the average service life of steel. No matter how to classify the consumption structure of steel, the average service life of the annual steel products could be calculated by the steel product consumption and its average life. Based on weighted average method,Δτis calculated by (Cooper et al., 2014;Zhang et al., 2007).

In Eq. (2),Δτijis the average life of steel products from thejthsub-category in theithindustry.Ais the steel consumption;iβ is equal toAi/A;ijβ is equal toAij/Ai.
(3) In-use stock of steel (Sn)
In-use stock of steel is the sum of equivalent steel from all kinds of containing-steel products under service in thenthyear. The service life-span of the (n-Δτ)thyear is assumed to be Δτas shown in Fig.2, which means,steel products from (n-Δτ)thyear tonthyear is under service. When the permanent loss is not considered in this paper, namely, in-use stock of steel in thenthyear,Sn, could be calculated by (Lu et al., 2013)

In Eq. (3),Snis in-use stock of steel innthyear;An,An-1,An-Δτ+1is the steel consumption of thenthyear,(n-1)thyear, (n-Δτ+1)thyear, respectively.
(4) Average service life-span (Y)
Average service life-span is weighted average life-span of steel in service. Average service life-span of steel in thenthyears,Yn, is calculated by (Zhang et al., 2007)

In Eq. (4), is the weight of steel consumption inithyear, and it is equal toAi/Sn;biis the number of years of steel consumption from theithyear to thenthyear, and it is equal ton-Δτ+i.
(5) Productivity per in-use stock of steel (H)
Productivity per in-use stock of steel is the GDP engendered by per in-use stock of steel. It reflects the economic performance of in-use stock of steel and is calculated by (Lu et al., 2010; Lu et al., 2013; Li et al., 2014)

Fig.1 The schematic diagram of in-use stock of steel

Fig.2 Driving force of steel consumption based on factor decomposition method. Steel consumption (A); In-use stock of steel (Sn); Average service life-span (Y); Productivity per in-use stock of steel (H); Steel output per unit GDP (T)

In Eq. (5),Hiis productivity per in-use stock of steel;Giis GDP inithyear.
(6) Steel output per unit GDP (T)
Steel output per unit GDP is put forward to show the consumed natural resources or basic materials through economic efficient, and is calculated by (Lu, 2005; Lu et al., 2013; Li et al., 2014).

In Eq. (6),Piis the steel output inithyear.
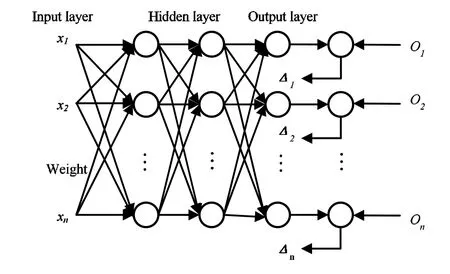
Fig. 3 Structure of back propagation neural network
It is an important index to reflect the modernization level of the country, and a significant & intuitive macro-control index to reflect the coordinated development of the steel industry and the economy.
2.2 Factor decomposition of steel consumption
The factors of influencing the steel consumption are very complex. In this paper, the steel consumption is taken as the criterion to analyze the trend of steel consumption.A, the steel consumption, is decomposed as following by the index decomposition method in factor identification method as following (Lu et al., 2010;Lu et al., 2013; Li et al., 2014):

In Eq. (6),Kis the influencing indicator of steel consumption, relevant to price, production limitation, technical progress and so on.
In addition,Y, average service life-span, is also an important factor to reflectSwhich indirectly decides to the consumption of steel. Considering the material recycle and the economic factors, it is divided into 4 main factors: in-use stock of steel (Sn), average service life-span (Y), productivity per in-use stock of steel (H) and in-service steel output per unit GDP (T), as showed in detail in Fig.2.
2.3 Back Propagation Neural Network (BP Neural Network)
In order to analyze the steel consumption accurately, the BP neural network, which analysis the complex nonlinear system, is used in scene simulation. It includes input layer, hidden layer and output layer, as shown in Fig.3. Specially, the hidden layer adopts S type function, which can find the nonlinear mapping relationship between input layer and output layer by adjusting the threshold value of its network (Liu et al, 2004; Liu,2012).
The BP neural network has wide applications in prediction and intelligent information management, such as stock market prediction, earthquake prediction, and securities management. Considering the economic efficiency and the recycling, the BP neural network of steel consumption is set up by MATLAB. And it provides a platform to simulate by multiple functions, such as S-Curve and polynomial model. Taking in-use stock of steel (Sn), average service life-span (Y), productivity per in-use stock of steel (H) and steel output per unit GDP (T) as the input matrix, the steel consumption as the output matrix, then we can get the simulation value through the BP network model.

Fig.4 Steel consumption in 5 industries: (a) construction industry, (b) machinery industry, (c) Infrastructure, (d) Transportation, (e) Light industry
3 Analysis on structure of steel consumption in China
Because of extremely huge and complex data required and limited data source, the steel consumption (including construction, infrastructure industry, transportation industry, light industry and machinery industry) from 2003 to 2011 is analyzed by the above method and is shown in Fig.4, according to the consumption characteristics of downstream industries and related references (Chyxx, 2015). Especially, the main sources of data in this paper are statistical yearbook and government websites, such as China Statistics Yearbook on Construction, China Steel Yearbook, Yearbook of China Transportation and Communication, China Industrial Economy Statistics Yearbook and China Machinery Industry Yearbook.
The construction industry in China is divided into 11 categories, including dwelling houses, office & education accommodation and so on, as shown Fig.4(1). Most steel was used in dwelling houses, accounting for 59.1% to 67%. In recent years, the steel structure building in China is booming, so steel consumption is increasing year by year. Now, the average annual housing construction is about 2.00×10⁹m2(housing construction area was 3.20×10⁹m2in 2009). At the same time, Yushu, Wenchuan and other earthquake experiences,show that the steel structure housing with safety, economy and harmony environment is the future direction of the development of human settlements.
According to Fig.4 (2), China made great efforts to strengthen the independent innovation after 2006. The steel consumption of machine tool industry increased steadily. In recent years, there is a substantial reduction in total imports while the export volume gets larger. China's iron ore resources are rich, reaching 7.44×10¹⁰tons, but the development rate is only 7.6%. Although China's mining is in a rising trend in recent years, it still cannot meet the demand. Therefore, the amount of mining machinery will increase and the steel consumption will continue to grow. From 2006 to 2010, China's petrochemical general machinery and equipment made a major breakthrough in the localization of some high-end equipment. The subsidy of RMB 96,160,000,000 from the central government and promoting local governments & farmers to invest RMB 418,300,000,000 directly, will become the first driving force of agricultural machinery market. But the high price of agricultural machinery is also difficult for most farmers to afford, agricultural machinery popularization still has a long way to go.
According to Fig.4(3), the steel consumption of basic facilities is the total amount of steel consumption in road, railway, electric power and bridge construction, having been rose from 1.62×10⁶tons to 3.60×10⁶tons from 2002 to 2007. In 2007, the economic crisis had an impact on the infrastructure, but after 2008 China began to expand domestic demand, which promoted the construction of steel consumption in the infrastructure sector to gradually increase and maintain growth. The proportion of steel consumption of highway has decreased from 56.36% to 39.54%. It indicated that other infrastructure has developed rapidly, In May, 2017,"National Highway Network planning” was released, in which highway planning and construction was a mark that the highway construction will continue to maintain the amount of consumption of steel. From 2003 to 2011, China's railway construction was in the upward trend, which have been rose from 3.49×10⁶tons to 2.10×10⁷tons in the 8 years, During the period of the 13th Five-year, Chinese railway investment will remain at a high level and the Chinese railway market will continue to be the world's largest railway market.
In Fig.4 (4), transportation tools include two parts (vehicles and ships). The automobile industry occupies an important position in the consumption of steel. In 2013, national automobile production and sales data showed that the car production and sales was maintaining a stable growth with the amount of more than 2.00×10⁷cars in both production and sales. In 2013, car production reached 2.21×10⁷cars, and car sales reached 2.20×10⁷cars, making an increase of 14.76% and 13.87%. The production and sales on passenger cars reached 1.81×10⁷and 1.79 ×10⁷, increasing by 16.50% and 15.71%. The production and sales on commercial vehicles reached 4.03×10⁶and 4.06×10⁶, increasing by 7.56% and 6.40%. Overall, the proportion of cars is basically stable at more than 50% and the proportion of trucks and buses are close to 25%. It shows that the prospects of China's passenger car development are broad.
Light industry represents household appliances, bicycles, metal manufacturing and other industries as shown in Fig. 4(5). In this paper, bike, motorcycle and electric bicycle are classified as small traffic tools,whose amount of steel consumption belongs to light industry. In 2009, because of the expanding domestic demand, home appliances to the countryside and other national macroeconomic policies, light industry began to gradually rise. Overall, the proportion of domestic demand in the whole industry gradually increased which at the same time also led to the growth of steel consumption.
Hereby, this paper establishes the structure of steel consumption from six industries as shown in Fig.5.

Fig.5 Structure of steel consumption
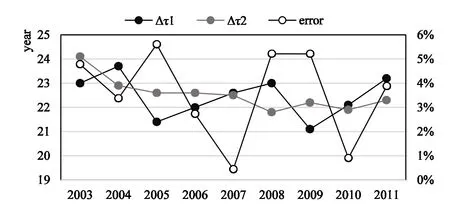
Fig.6 Compare with Δτ1 (steel consumption-based) and Δτ2 (steel output-based)
Above all, the steel consumption of the five industries is obtained as following. Construction industry is the main battlefield of China's steel consumption, accounting for 43.2% to 53.7%. Following that of construction industry, the steel consumption of machinery industry accounts for 12.5% to 15.2%. Since 2006, China has put forward to strengthen independent innovation and machinery industry has developed rapidly, therefore, the consumption of steel has also increased. From 2005 to 2009, other industries instead of the five industries occupied a large proportion in steel consumption. The main reason was the steel industry had eliminated backward production capacity before, and reconstructed some new capacity in line with the current technical requirements of environmental protection. In 2005, steel production capacity was in the release period and steel prices rose at first and then fell, which made inventory increase, to such an extent as to lead to the proportion of steel consumption of five major sectors decreased.
4.Analysis on the driving force of steel consumption
4.1 Analysis of service life-span (Δτ)
According to the Eq. (2) mentioned above, service life-span is calculated on the basis of steel consumption or steel output, and the results are presented in Fig. 6.

Fig.7 Analysis of the driving forces on the steel consumption. (a)A and Sn ,(b) Y and Sn, (c) A and H, (d) A and T. Steel consumption (A); Inuse stock of steel (Sn); Average service life-span (Y); Productivity per in-use stock of steel (H); Steel output per unit GDP (T)
According to the diagram above, life-span in service is about 21-24 years, which is calculated either by steel consumption or by steel output. Moreover, compared Δτ1, calculated by steel consumption, and Δτ2,calculated by steel output, the results show that the error of each year is less than 6% from 2003 to 2011. It is feasible to calculate the service life-span of steel products according to the steel output and to analyze the driving force of steel consumption in China.
4.2 Analysis on the driving force of Sn, Y, H and T on steel consumption
This paper gives the analysis of the data after 1988. According to direct import and export of steel, the calculation results are as following (Fig.9) based on Eq. (1)-(6).
As shown in Fig. 7(1), the amount of in-use stock of steel is increasing year by year. The larger amount of in-use stock of steel (Sn), the larger amount of steel in the society which needs more steel to replace, so steel consumption will increase.
As shown in Fig. 7(2), the average service life-span of in-use stock of steel (Y) was about 8~8.5 years before 1995, and it was increasing from 1995 to 2001. Through analysis, although steel consumption increased year by year and the proportion of consumption of steel increased, steel was fully utilized. After 2002, China's average service life-span of in-use stock of steel (Y) began to decline rapidly, the main reason of which was because of the substantial growth of Chinese steel consumption and accelerated & premature retirement of inuse stock of steel, which led into that steel had not been fully used before being scrapped.
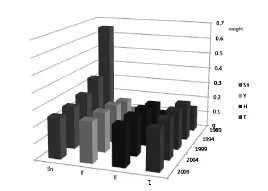
Fig.8 Driving force analysis
As shown in Fig. 7(3), productivity per in-use stock of steel (H) was declining from 1990 to 2011 because the growth rate of GDP was lower than that of in-use stock of steel, the premature retirement of in-use stock of steel increased and steel had not been fully used. So that steel consumption growth was relatively fast.From 1990 to 1998, productivity per in-use stock of steel (H) was increasing year by year. At that time the growth rate of GDP was higher than that of in-use stock of steel. Steel products were used more fully, the early retired in-use stock of steel was less and the growth of steel consumption was relatively slow.
As shown in Fig. 7(4), steel output per unit GDP (T) was declining from 1990 to 2000. The growth rate of GDP was higher than that of steel consumption. Relatively speaking, steel was fully used, so early retired inuse stock of steel as well as inventory was less and the growth rate of steel consumption was relatively slow.After 2000, steel output per unit GDP (T) grew rapidly, and the growth rate of GDP was lower than that of the steel consumption, so steel was not fully used and early retired in-use stock of steel increased. When steel output per unit GDP (T) grows rapidly, steel consumption growth will be more quickly.
According to the entropy weight, the weights of the four indicators in 1989, 1994, 1999, 2004 and 2009 are obtained and shown in Fig.8.
According to Fig. 8, the impact of in-use stock of steel is becoming smaller and smaller for steel consumption, then it is equal with the other three factors in 2009. The main reason is that steel accumulation in China has reached a higher value. Comparing with that in 1988, construction of each row is on the right track after nearly 30 years of development, and the in-use stock of steel in China gradually tends to peak.
If average service life-span (Y) is low and other conditions remain unchanged, steel cannot be fully utilized, and it will step into the cycle of production of steel earlier. It must lead to produce more new steel to meet the production and consumption. So the driving effect of average service life-span (Y) on the production and consumption of steel is rising at first and tending to be stable at about 25%.
Driving effect of productivity per in-use stock of steel (H) on the steel consumption is also rising at first and stable at about 25%. When the growth rate of GDP are lower than the growth rate of the in-use stock of steel, productivity per in-use stock of steel (H) decreases and in-use stock of steel don’t been fully utilized. So early retired in-use stock of steel increased and steel consumption growth is relatively fast. On the contrary,productivity per in-use stock of steel (H) increase, then the use of in-use stock of steel is more adequate and the growth of steel consumption is relatively slow.
Driving effect of steel output per unit GDP (T) on the steel consumption is also rising at first and tending to be stable at about 25%. The higher steel output per unit GDP (T), the higher rate of steel production than the rate of GDP and the increased steel production inevitably promote the growth of steel consumption. After 2000, the driving force on steel consumption by average service life-span (Y), productivity per in-use stock of steel (H) and steel output per unit GDP (T) reach the same level with the driving force by in-use stock of steel(Sn), which shows that the effect of the three factors should not be ignored and making some changes among them can control the steel consumption.
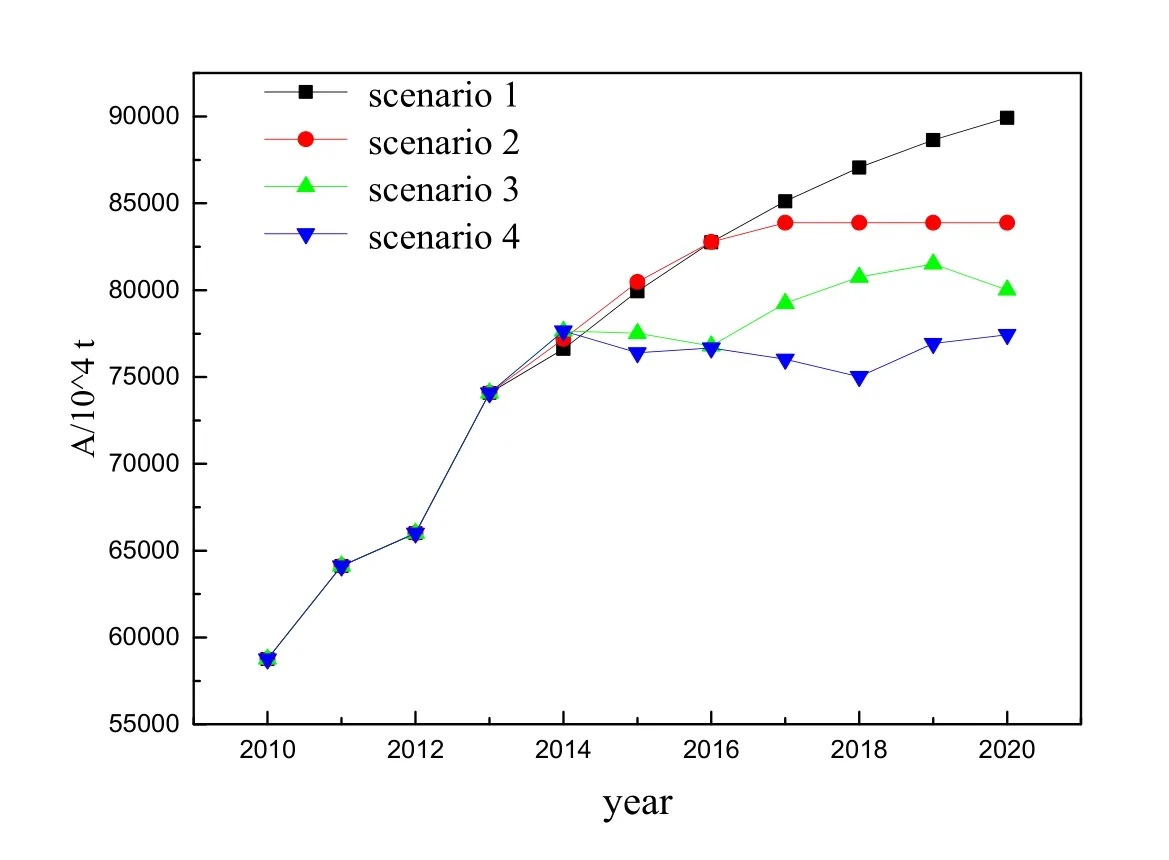
Fig. 9 Scenario 1, 2, 3 and 4

Table 1 Scenario 1 to Scenario 4
5 Scenario analysis
This paper tries to forecast steel consumption by dividing it into several terminal consumer industries, according to the total amount of GDP. To some extent, steel output per unit GDP (T) can reflect a certain consumption and production structure, so this paper uses time series simulation method to simulate, combining with steel output per unit GDP (T). The method of curve fitting is used to establish the simulation polynomial and theScurve. Besides, BP neural network is used for modeling and simulation. Due to the data size and continuity, it is difficult to ensure the accuracy of the medium and long term simulation. Therefore, the paper simulates the steel consumption of the next several years.
In this paper, we consider theSgrowth model, polynomial model and BP neural network model, setting up four scenarios to simulate the steel consumption in China as shown in Table 1.
Scenario 1 and Scenario 2 are usingSgrowth model and polynomial growth model, in accordance with the current steel consumption growth model for simulation.
Scenario 3 and Scenario 4, using BP neural network. Put the data of in-use stock of steel (Sn), average service life-span (Y), productivity per in-use stock of steel (H), steel output per unit GDP (T) from 1988 to 2013 as the input vector and the steel consumption as the target vector to build 3 layer neural networks. The Scenarios are simulated that adjust the industrial structure to make the steel output decline by 3% and 2% every year. Here are the results.
According to the diagram above, Scenario 1 is the overall trend of growth, and steel consumption would reach 8.99×10⁸tons by 2020. The trend of Scenario 2 is decreasing after an initial increase, which could reach the top steel consumption in 2017 (8.34×10⁸tons). The trend of Scenario 3, which is similar to scenario 2, is increasing firstly and then decreasing. But its steel consumption will be the highest in 2019 (8.34×10⁸tons),and average service life-span will reach 8.2 years in 2020. The trend of Scenario 4 is increasing firstly, then drop to the lowest point in 2018 (7.40×10⁸tons), later increase again. And its average service life-span will increase to 8.4 years, steel output per unit GDP (T) could be up to 0.1248 t/RMB 104and steel consumption will reach to 7.7×10⁸tons in 2020. Moreover, this Scenario not only is accordant with our current development and the “13th Five-year” Plan of iron and steel industry but also is more beneficial to both environmental protection and economic situation of steel enterprises comparing with all Scenarios, because fewer raw materials will be needed to produce steel when steel consumption goes down.
In the analysis process, we also find that in-use stock of steel (Sn) is the biggest driving force on steel consumption in the long term, so changing the amount of in-use stock of steel (Sn) is an important way to influence the consumption of steel. Therefore, the development of new materials to take the place of steel has an important influence on reducing the amount of in-use stock of steel (Sn) and the steel consumption.
Improving the average service life-span (Y) of steel products can effectively keep down the growth of steel consumption. And reducing the phenomenon of early retirement of in-use stock of steel can effectively reduce the increase of invalid steel, which plays an important role in the rational use of steel and the easement of the pressure on the resource environment.
The improvement of productivity per in-use stock of steel (H) is an important symbol of adjusting the industrial structure to improve the contribution rate of the third industry in GDP which can effectively reduce steel consumption. Steel output per unit GDP (T) is very effective for the promotion of steel consumption.Adjustment of the structure of GDP and reasonable control of steel production can control the steel consumption to a large extent and reduce energy consumption and emission.
6 Conclusion
The following conclusions are drawn through the research in this paper:
(1) The proportion of steel consumption in China's construction industry reached about 50%. Steel consumption ratio of machinery industry reached about 15% and the proportion of the rest of the industries is low.
(2) The influence on the steel consumption by in-use stock of steel (Sn) is reduced, but it is equal with the other three factors, accounting for 25%. The driving effect of average service life-span (Y), productivity per in-use stock of steel (H) and steel output per unit GDP (T) on steel consumption increases at first, while in recent years, it is basically unchanged and stable at around 25%.
(3) If the annual GDP growth rate could be kept on 7%; and annual steel output decrease by about 3%. By 2020, the steel output of per unit of GDP would be 0.1248t/RMB 104and the average service life of in-use stock of steel would grow to 8.4 years. Compared with Scenario 1, 2 and 3, Scenario 4 is the best one for both environmental protection and steel enterprises in the economic situation.
Acknowledgements
The authors are grateful to the financial support provided by Research Project of Northeastern University(No.150204006), the China Scholarship Council (201606085050); the National Natural Science Foundation of China (NO.41301643) and (NO.71373003; NO.71403175).
Chyxx (2015),Demand analysis of China's iron and steel downstream industry.Available on:http://www.chyxx.com/industry/201507/330432.html (in Chinese).
Cooper, D.R., Skelton, A.C.H., Moynihan, M.C. and Allwood, J.M. (2014), Component level strategies for exploiting the lifespan of steel in products,Resources Conservation & Recycling84(84), 24-34.
Döhrn, R. and Krätschell, K. (2014), Long-term trends in steel consumption,Mineral Economics27(1), 43-49.
Dahlström, K. and Ekins, P. (2007), Combining economic and environmental dimensions: value chain analysis of UK iron and steel flows,Ecological Economics58(3), 507-519.
Geyer, R., Davis, J., Ley, J., He, J., Clift, R., Kwan, A., Sansome, M. and Jacksond, T. (2007), Time-dependent material flow analysis of iron and steel in the UK: part 1: production and consumption trends 1970-2000,Resources Conservation & Recycling51(1),101-117.
Huh, K.S. (2011), Steel consumption and economic growth in Korea: long-term and short-term evidence,Resources Policy36(2),107-113.
Lu, Z., Yue, Q. and Gao, C. (2013), Study on steel output per unit GDP and steel production, energy consumption, materials consumption & wastes emission of steel industry,Engineering Sciences28(6), 17-27 (in Chinese).
Lu, Z. and Yue, Q. (2010), Resolution of the mechanism of steel output growth and study on the reasons of the excessive growth of steel output in China in 2000-2007,Engineering Sciences12(6), 4-11 (in Chinese).
Li, H., Wang, B. (2014), Analysis of environmental and economic benefits in iron and steel enterprises by entropy weight fuzzy comprehensive evaluation model,Environmental Engineering & Management Journal13(5), 1213-1219.
Lu, Z. (2005), Crossing "environmental mountain" - on the increase and decrease of environment impact in the process of economic growth,Iron & Steel Scrap of China06(2), 11-19.
Liu, L.J. and Xie, M.P. (2004), Prediction research of the recursive neural network of nonlinear dynamic system prediction analysis of the iron and steel output in China,Study of Finance & Economics02(1), 7-11 (in Chinese).
Liu, L. (2012), The forecast of Qinhuangdao logistic based on BP neural network,International Journal of Digital Content Technology & Its Application6(8), 8-16 (in Chinese).
MIIT. (2016),Planning for adjustment and upgrading of iron and steel industry. Available on:http://www.miit.gov.cn/n1146295/n1652858/n1653018/c5355576/content.html.
Park, J.A., Hong, S.J., Kim, I., Lee, J.Y. and Hur, T. (2011), Dynamic material flow analysis of steel resources in Korea,Resources Conservation & Recycling55(4), 456-462.
The editorial board of China steel yearbook (2016),China Steel Yearbook 2016 (CSY 2016). Metallurgical industry press, 316-317 (in Chinese).
The editorial board of China steel yearbook (2001),China Steel Yearbook 2001(CSY 2011). Metallurgical industry press,224-225 (in Chinese)
Wang, L., Qi, Z.Y. and Pan, F. (2014),Economic output and social stock of steel: Evidence from dynamic material flow analysis and statistical time series analysis. International Conference on Management Science & Engineering (pp.719-725). IEEE.
Zhang, J.H. and Lu, Z.W. (2007), Average service life of zinc products in China,Journal of Northeastern University28(9), 1309-1312 (in Chinese).
 Journal of Environmental Accounting and Management2018年1期
- Journal of Environmental Accounting and Management的其它文章
- Disclosure of Environmental Matters – Galp Energy
- A Risk-averse Two-Stage Stochastic Optimization Model for Water Resources Allocation under Uncertainty
- Examining the Effect of Emotion to the Online Shopping Stores’ Service Recovery: A Meta-Analysis
- Ecological Interstate Systems as an Object of Legal Research
- The Relationships Between Contextual Variables and Perceived Importance and Benefits of Environmental Management Accounting (EMA) Techniques
- The Relationship Between Environment Operational Performance and Environmental Disclosure of Nigerian Listed Companies
