Exploratory use of ultrasound to determine whether demyelination following carpal tunnel syndrome co-exists with axonal degeneration
Xue Deng, Lai-Heung Phoebe Chau, Suk-Yee Chiu, Kwok-Pui Leung, Sheung-Wai Li, Wing-Yuk Ip,
1 Department of Orthopedics & Traumatology, The University of Hong Kong, Hong Kong Special Administrative Region, China
2 Clinical Electro-diagnostic Unit, Tung Wah Hospital, Hong Kong Special Administrative Region, China
3 Department of Medicine, The University of Hong Kong, Hong Kong Special Administrative Region, China
Introduction
Carpal tunnel syndrome (CTS) is the mostly reported peripheral nerve compression injury at the wrist with an estimated incidence rate of 8% across life-span (Rempel et al.,1998; Werner and Andary, 2002). Clinically, it usually manifests numbness, tingling, and/or pain in the sensory median nerve-innervated area of the hand (Ntani et al., 2013). CTS is pathologically a disorder with segmental demyelination,and secondary axonal degeneration may co-exist following demyelination (Caetano, 2003). It is of great clinical significance to distinguish this as the optimal treatment may differ with or without axonal degeneration. However, there are many challenges in the discrimination using conventional methods. Nerve conduction studies (NCS) combined with clinical tests,e.g., Phalen’s test, Tinel’s sign test (Miedany et al., 2008; Baiee et al., 2015) are the gold standard in the diagnosis of CTS. NCS can only differentiate axonal degeneration by comparing distal and proximal evoked responses(Lesser et al., 1995). Palmar stimulation is usually not taken as a distal record, resulting in a difficulty in differentiation(Caetano, 2003). In addition, conduction block and temporal dispersion may also blur its accuracy because both may also cause amplitude drop (Kiernan, 1999). Needle electromyography and nerve biopsy can provide more sensitive and accurate information in the determination of axonal degeneration, but they are restricted in the clinical practice(Werner and Andary, 2011).
To overcome these shortcomings, ultrasound has been cross-validated by NCS in the diagnosis and severity grading of CTS (Cartwright et al., 2012; Tai et al., 2012; Fujimoto et al., 2015). It can complementarily provide anatomical information, including thickness of retinaculum, echogenicity,and cross-sectional area (CSA) of the median nerve to reflect the severity of CTS (Klauser et al., 2015). Previous studies in which NCS was used for diagnosis confirmation and severity classification have validated the cut-off values of ultrasound parameters,e.g., CSA (Wong et al., 2002; Baiee et al., 2015;Fujimoto et al., 2015; Zhang et al., 2015). However, it remains unknown about the cut-off values of the parameters of the current NCS-ultrasound severity classification system in the differentiation of axonal degeneration. A previous NCS study revealed that over half of the patients with mild and moderate CTS developed secondary axonal degeneration (Caetano, 2003). This ambiguity may constrain the accuracy of treatment prescription. It is necessary to explore the cut-off values to compensate the deficit.
Baiee et al. (2015) reported that median nerve swelling can induce lower amplitude of the compound motor action potential (CMAP) and sensory nerve action potential (SNAP)of the median nerve, suggesting the potential axonal degen-eration with the enlarged CSA. We hypothesized that there were cut-off values of ultrasound parameters with acceptable sensitivity, specificity, and accuracy for differentiating CTS accompanied by secondary axonal degeneration.
The purpose of this study was to explore the cut-off values of ultrasound parameters used to differentiate demyelinating CTS accompanied by axonal degeneration. To our best knowledge, this is the first study in this field. Its findings can help to clarify the pathological progress, providing more accurate treatment guidance. The NCS-ultrasound technique has great potential for application in the general clinical practice owing to the non-invasiveness, low cost, and great efficiency of ultrasound.
Subjects and Methods
Subjects
This is a non-randomized, cross-sectional cohort study. It was approved by the Institutional Review Board of the University of Hong Kong/Hospital Authorities in Hong Kong West (HKU/HA HKW IRB, Ref. Number: UW17-129), Hong Kong Special Administrative Region, China and performed in strict accordance with theDeclaration of Helsinki. Written informed consent were obtained from all patients. They were initially screened at hand clinic by an experienced hand surgeon, and then referred to a physician subspecialized in NCS and ultrasound for diagnosis confirmation and severity gradation. The diagnostic criteria for CTS severity gradation was in accordance with Bland’s classification (Bland, 2000).
Procedures of nerve conduction studies
An NCS machine (Nicolet, Middletown, WI, USA) was utilized following standard practice: supramaximal percutaneous stimulation and surface electrode recording were performed. Skin temperature was maintained above 32°C. Motor evoked potential of the median nerve was measured by stimulation at the palm (4 cm distal to the wrist), the wrist(6.5 cm proximal to the thenar muscle) and the elbow (just above the crease of antecubital fossa, lateral to the medial epicondyle and medial to the biceps tendon) respectively(Figure 1A). Whereas motor evoked potential of the ulnar nerve was measured by stimulation at the wrist (7 cm proximal to the belly of the abductor digiti minimi muscle), below(3 to 4 cm distal to the medial epicondyle) and above elbow(6 to 7 cm proximal to the medial epicondyle) respectively(Figure1B). Sensory evoked potentials were obtained by orthodromic stimulation at the wrist and recording from the 2nd finger (median nerve) or the 5th fingers (ulnar nerve)with ring electrodes at a distance of 12 or 14 cm in terms of the upper limb length and hand size (Figure 1C).
Ultrasound procedures
A real-time ultrasound scanner (MyLabTM Twice, ESAOTE, Maastricht, the Netherland) with a 4–13 MHz linear array transducer was used for ultrasound scanning by the same physician skilful in musculoskeletal ultrasonography soon after NCS assessment. Subjects were seated on a plinth facing the examiner, with hands resting in a horizontal supine position and fingers semi-extended. Transverse scans of the median nerve would be performed from the distal segment of the forearm to the tunnel outlet. Cross-sectional area (CSA) and perimeter (P) measurements at the distal and proximal levels were traced continuously by outlining the hyperechoic epineurium at the correspondent sites: (1) distal level was taken at the tunnel or level of radial head (Figure 2A) while (2) proximal level was taken at one third distal forearm (DF-CSA, DF-P) (Figure 2B). Then, ratios (R-CSA and R-P) were calculated by dividing wrist over one third distal forearm measurements. Changes from wrist to one third distal forearm (ΔCSA and ΔP) were obtainedviawrist minus one third distal forearm measurements. These measurement sites were taken because many studies have reported high sensitivity and specificity using CSA at tunnel inlet, while much reproducible landmark in the proximal third of pro-nator quadratus muscle in the distal forearm (Duncan et al.,1999; Wong et al., 2002, 2004; Wiesler et al., 2006; Mondelli et al., 2008; Klauser et al., 2009, 2015; Miyamoto et al., 2014).
Data analysis
SPSS 24.0 software (IBM, Armonk, NY, USA) was used to analyze the data. Independent samplest-test was used to investigate the differences in demographics (age), NCS findings and ultrasound parameters between groups A and B.Pairedt-test was used to compare palmar and wrist CMAP amplitude within groups. Mann-WhitneyUtest was applied to explore differences of severity of CTS between groups A and B. Pearson’s chi-square test was used to examine categorical variables (gender, wrist site) between groups A and B. The area under the receiver operating characteristic curves (AUROC) was used to figure out the cut-off values of ultrasound parameters to explore acceptable sensitivity and specificity.
Results
Baseline data
Seventy-three patients were included in this study. Among these patients, 40 patients (45 hands) and 33 patients (35 hands) were assigned into group A (demyelination only)and group B (demyelination plus secondary axonal degeneration) respectively. Gender (Pearson’s chi-square value= 1.589,P= 0.208) and handedness (Pearson’s chi-square value = 0.288,P= 0.591) were not significantly associated with grouping. There were significant differences in age (t=–3.703,P< 0.001) and severity grade (Z= –3.774,P< 0.001)between groups. Overall, the recruited hands in the group A were less severe than those in the group B (Table 1).
Findings of NCS
As shown inTable 2, there were significant differences in motor latency (t= –4.35,P< 0.0001), CMAP amplitude (t= 2.49,P= 0.015), and conduction velocity (t= 4.106,P< 0.0001)of the median motor nerve at the wrist between groups A and B. Significant differences in motor latency (t= –4.885,P< 0.0001) and CMAP amplitude (t= 2.785,P= 0.007) of the median motor nerve at the elbow between groups. There were no significant differences in motor latency (t= –1.746,P= 0.085) and CMAP amplitude (t= 1.25,P= 0.215) of the median motor nerve at the palmar site between groups. In the group B, CMAP amplitude of the median motor nerve at the palmar site was significantly higher than that at the wrist(t= 3.32,P= 0.002), but there was no significant difference in CMAP amplitude of the median motor nerve between palmar site and wrist in the group A (t= –0.186,P= 0.854).There were significant differences in the distal sensory latency (t= –3.17,P= 0.003) and SNAP amplitude (t= 7.88,P<0.0001) of the median sensory nerve between groups A and C. No significant difference in conduction velocity (t= 1.95,P= 0.057) of the median sensory nerve at the wrist was found between groups A and B. As shown inTable 3, there were no significant differences in all variables of the evoked potentials of ulbar motor and sensory nerves, except SNAP amplitude at the wrist (t= 2.88,P= 0.005) between groups A and B. The outcomes of NCS variables of the median nerve at the wrist in the group A were superior to those in the group B while the ulnar nerves remained normal in both groups.
Findings of ultrasound parameters
There were significant differences in wrist cross-sectional area (W-CSA;t= –3.17,P= 0.003), wrist perimeter (W-P;t= –3.68,P= 0.001), ratio of cross-sectional area of wrist over one third distal forearm (R-CSA;t= –3.68,P= 0.001), ratio of perimeter of wrist over one third distal forearm (R-P;t=–2.65,P= 0.01), changes of cross-sectional area from wrist to one third distal forearm (ΔCSA;t= –3.589,P= 0.001) and changes of perimeter from wrist to one third distal forearm(ΔP;t= –3.406,P= 0.001) while no significant differences in DF-CSA (t= 0.29,P= 0.77) and DF-P (t= –0.33,P= 0.74)(Table 4). The overall outcomes of ultrasound parameters in the group A were inferior to those in the group B.
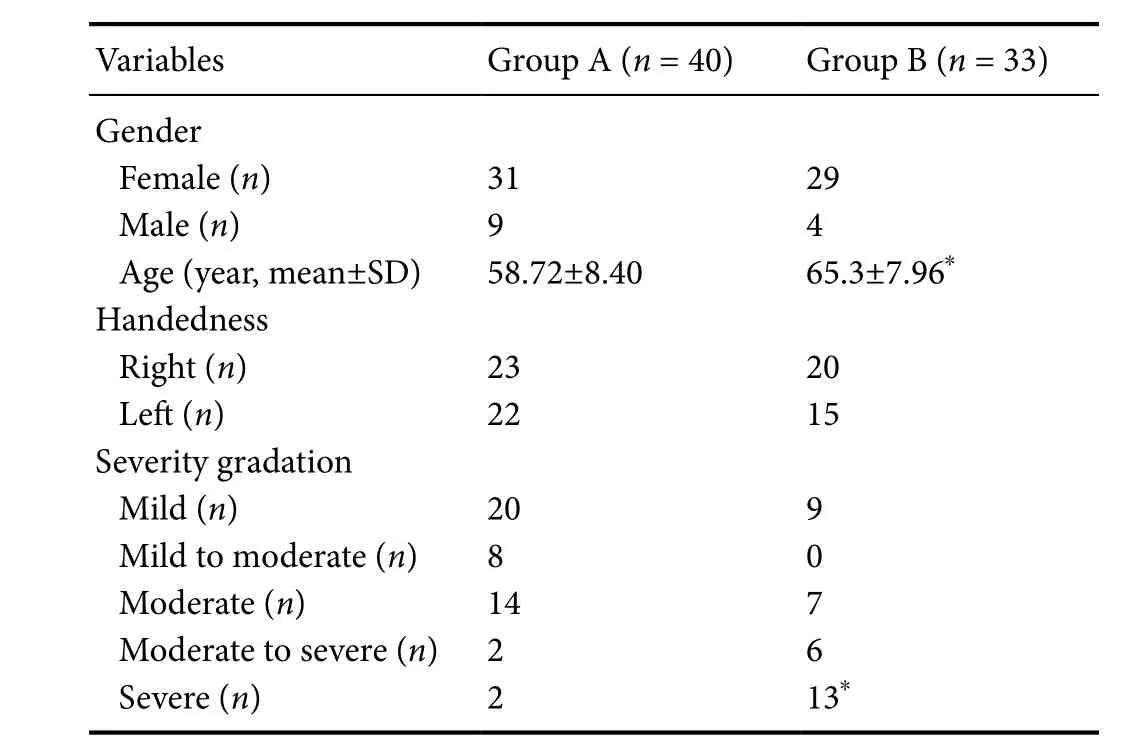
Table 1 Baseline data of the included 73 patients with carpal tunnel syndrome
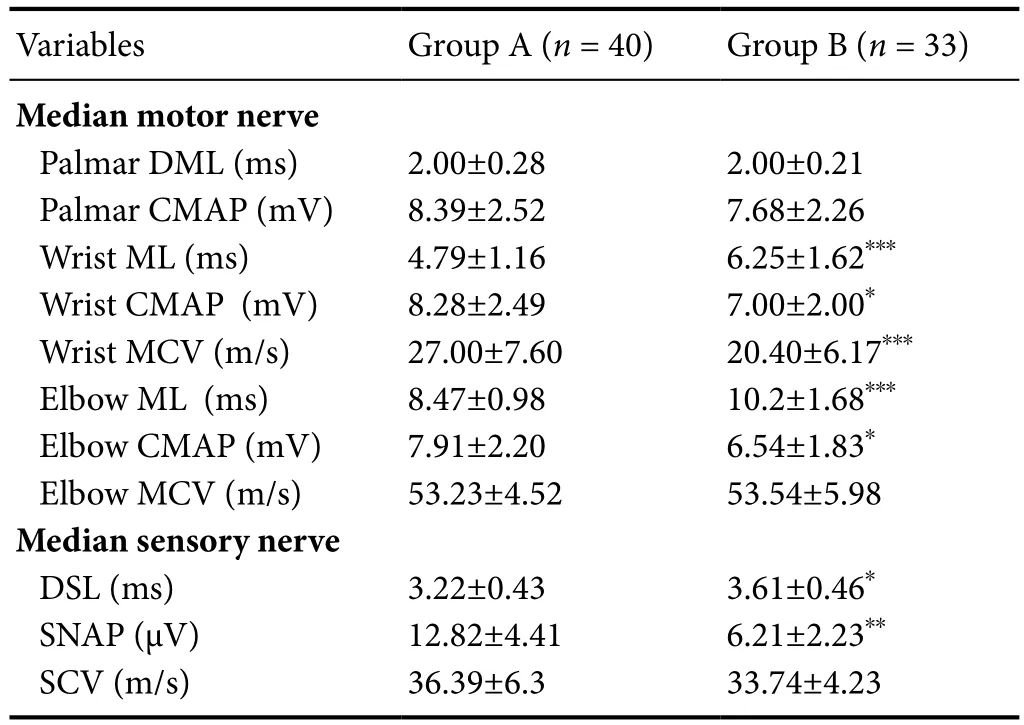
Table 2 Nerve conduction studies of the median nerve in patients with carpal tunnel syndrome
Cut-off values, sensitivity, specificity, and ROC curves
The sensitivity and specificity of the cut-off values measured by ultrasound were plottedviaROC curves (Figure 3A–C).All the ultrasound parameters indicated good sensitivity, fair specificity and fair to good accuracy to differentiate demyelination from axonal degeneration among patients with CTS.
As shown inTables 5and6, the AUC of W-CSA was 0.71 at 12.00 mm2, with sensitivity of 80% and specificity of 48.9%; the AUC of the W-P was 0.748 at 16.27 mm, withsensitivity of 88.6% and specificity of 51.1%; the AUC of R-CSA was 0.725 at 1.85, with sensitivity of 85.7% and specificity of 48.9%; the AUC of R-P was 0.676 at 1.48 with sensitivity of 80% and specificity of 40%; the AUC of ΔCSA was 0.758 at 6.98 mm2, with sensitivity of 77.1% and specificity of 62.2%; the AUC of ΔP was 0.717 at 5.77 mm, with sensitivity of 80% and specificity of 46.7%.
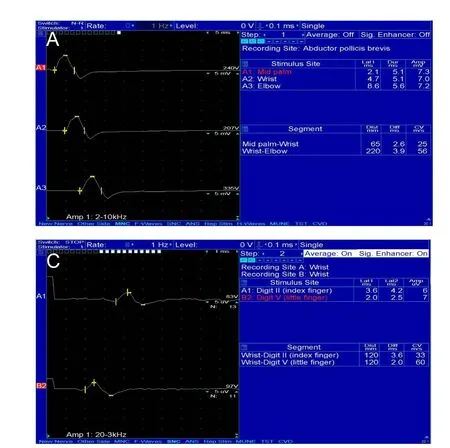

Figure 1 Graphs of nerve conduction studies for diagnosing carpal tunnel syndrome.

Figure 2 Ultrasound measurements of the median nerve for diagnosing carpal tunnel syndrome.

Figure 3 The sensitivity and specificity of the cut-off values measured by ultrasound plotted via Receiver Operative Characteristics (ROC)curves.
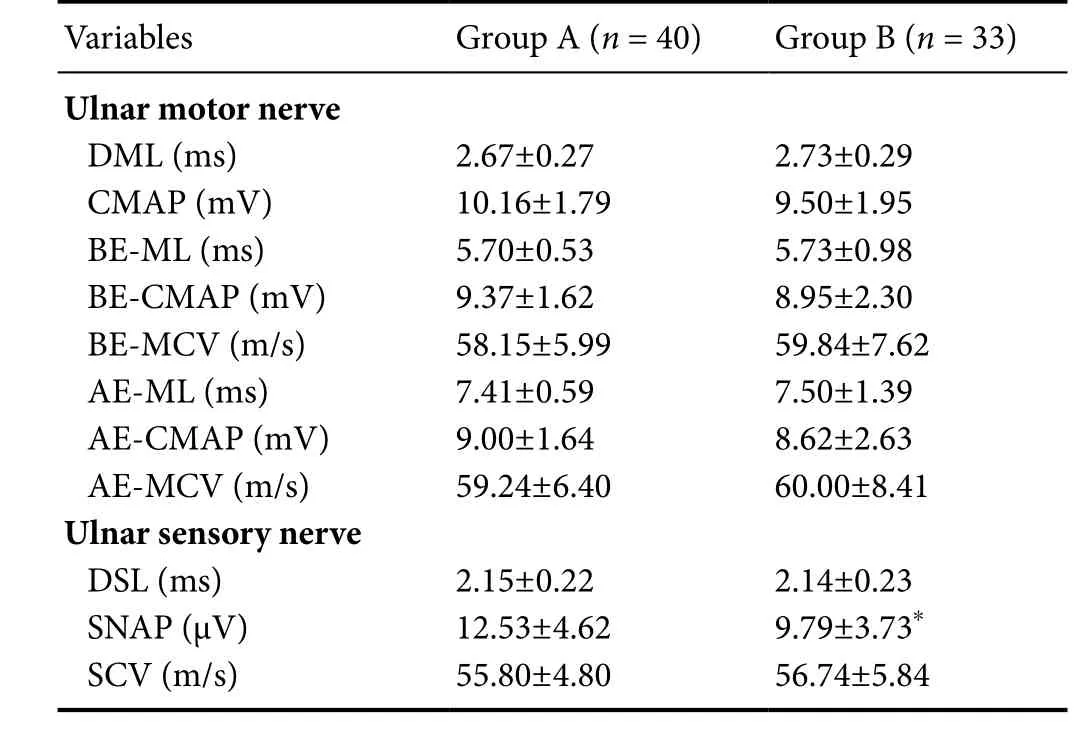
*P < 0.05, vs. group A. Data are expressed as the mean ± SD(independent samples t-test). DML: Distal motor latency; CMAP:compound motor action potential; BE-ML: below elbow motor latency;BE-CMAP: below elbow compound motor action potential; BE-MCV:below elbow motor conduction velocity; AE-ML: above elbow motor latency; AE-CMAP: above elbow compound motor action potential amplitude; AE-MCV: above elbow motor conduction velocity; DSL:distal sensory latency; SNAP: sensory nerve action potential; SCV:sensory conduction velocity.

Table 4 Ultrasound measurements of patients with carpal tunnel syndrome
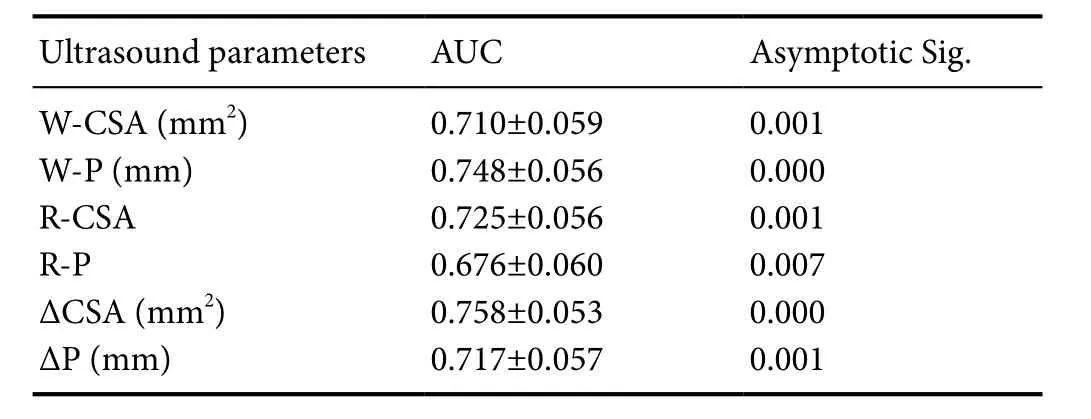
Table 5 Area under the curve (AUC) of ultrasound parameters in patients with carpal tunnel syndrome
Discussion
Cut-off values for severity gradation vs. differentiation between demyelination and secondary axonal degeneration
CTS with secondary axonal degeneration is a more severe pathological stage compared to CTS with demyelination alone (Caetano, 2003). Our results consistently indicated that the grade of severity, NCS and US outcome in the group B were more inferior than those in the group A. Regarding cut-off values for severity gradation, Klauser et al.(2015) suggested 1.7 and 6 mm2as cut-off values of R-CSA and ΔCSA to distinguish mild from moderate CTS while 2.2 and 9 mm2to distinguish moderate from severe CTS. Baiee et al. (2015) revealed 12.95 (± 3.19) mm2as the mean value of CSA for moderate CTS. A recent study also revealed 16.0(± 2.7) mm, 18.5 (± 3.4) mm and 19.7 (± 3.8) mm as cutoff values of W-P to classify the severity of CTS from mild,moderate to severe grade, indicating W-P and R-P as a potential ultrasound parameters for grading severity of CTS in a logistic regression model (Filius et al., 2015). These cut-offvalues for severity gradation match with the cut-off values identified in our studies to differentiate CTS with axonal degeneration, where R-CSA was recorded at 1.85, ΔCSA at 6.98 mm2, CSA at 12.00 mm2, and W-P at 16.27 mm respectively.In this study, R-CSA was 1.85, which is between 1.7 and 2.2;ΔCSA was 6.98 mm2, which is between 6 mm2and 9 mm2;CSA was 12.00 mm2, which is within the moderate grade,and W-P was 16.27 mm, which is estimated to be mild to moderate grade. These values may serve as clearer indicators to interpret the pathological progress based on the current ultrasound severity classification system. In this study, among hands with moderate CTS, R-CSA was 1.87 and 2.79, ΔCSA was 6.22 mm2and 9.56 mm2, W-CSA was 13.5 (± 6.21) mm2and 16.85 (± 10.67) mm2, W-P was 18.11 mm and 19.68 mm respectively in group A and group B. If the above cut-off values were taken into account, then the treatment approaches may differ regardless of the same severity grade. Previous ultrasound studies mainly focused on exploring cut-off values for CTS severity gradation, however, different pathological progresses may co-exist within the same grade, as was also reflected from our identified cut-off values. These findings can help to locate ultrasound cut-off values for clearer pathological progress based on the current gradation system. It can further support a more refined treatment regime for future CTS patients, in particular for those who fulfill the surgical criteria but diagnosed as less severe grade.

Table 6 Cut-off values with sensitivity and specificity using Receiver Operating Characteristics Curve
Sensitivity, specificity, and accuracy of cut-off values for diagnostic confirmation, severity gradation versus differentiation between demyelination and secondary axonal degeneration
CSA has been mostly studied in previous studies for its use in the diagnostic confirmation and severity gradation. As for diagnostic confirmation, a variety of CSA values were explored, including 8.5 mm2(sensitivity 97%, specificity 98%,accuracy 97.2%) (Mohammadi et al., 2010), 9 mm2(sensitivity 65–100%, specificity 92.5–97%, accuracy 78.9%) (Duncan et al., 1999; Altinok et al., 2004), 10 mm2(sensitivity 82–82.8%,specificity 72.7–87%, accuracy 79.3–83.4%) (Wong et al., 2004;Ziswiler et al., 2005), 11 mm2(sensitivity 70–73%, specificity 57–63%) (Sarria et al., 2000; Swen et al., 2001), 12 mm2(sensitivity 67–83%, specificity 50–97%, accuracy 71.5–82%) (Nakamichi and Tachibana, 2002; Klauser et al., 2011), 13 mm2(sensitivity 86%, specificity 97%) (Fujimoto et al., 2015) and 15 mm2(sensitivity 88%, specificity 96%) (Lee et al., 1999). ΔCSA was reported to be 4 mm2for diagnostic confirmation (sensitivity 92.5%, specificity 96.4%, accuracy 93.9%) (Klauser et al.,2011). For severity gradation, the sensitivity, specificity, and accuracy of the method using 1.7 as the cut-off value of R-CSA to discriminate between mild and moderate CTS were 77%,79% and 84.1%, respectively, while they were 53%, 84%, and 71% respectively for the method using 2.2 as the cut-off value of R-CSA (Klauser et al., 2015). As shown inTables 5and6in this study, by comparison with those for diagnostic confirmation, the performance of CSA in our study were comparable while ΔCSA appeared lower but still within acceptable range.In comparison with severity gradation, the sensitivity of R-CSA in our study was higher, while the accuracy was lower but acceptable. However, the specificity of R-CSA appeared lower than that in previous studies. As for ΔCSA, the sensitivity and accuracy in our study were comparable with that for severity gradation but lower in specificity. Overall, the sensitivity and accuracy of our suggested CSA (12 mm2), R-CSA (1.85) and ΔCSA (6.98 mm2) to differentiate demyelination from secondary axonal degeneration are comparable with those for diagnostic confirmation and severity gradation in previous studies.However, the fair specificity in our suggested cut-off values may be explained due to lack of the universal agreement upon differentiating demyelination from secondary axonal degeneration based on NCS test. In order to set up the criteria, we used previous clinical evidences, including those recommended by American Association of Neuromuscular & Electrodiagnostic Medicine into account. In addition, we also followed the well-established rules of our own laboratory to perform the study. Electromyography and biopsy, as more accurate and sensitive methods for detecting axonal degeneration, were not used in our study because these methods were ethically challenging and have difficulties in subject enrolment due to their invasiveness. We also excluded patients with cervical radiculopathy, plexopathy or other focal mono-neuropathies (e.g.,cubital tunnel syndrome), therefore, needle electromyography is not mandatory (Werner and Andary, 2011). Nevertheless,this is the first clinical study to explore the cut-off values based on current ultrasound severity classification system for CTS.Future studies involving larger samples will be promising to generate more robust results.
Correlation between ultrasound parameters and NCS fifindings and limitations
CSA is a well-accepted ultrasound parameter that can reflect the severity of CTS (Gagliardo et al., 2015). Its correlation with NCS and ultrasound obtained in this study is consistent with that in previous studies. In this study, the mean value of median nerve CSA with no SNAPs was 18.05 mm2, which was comparable to 17.7 mm (Rempel et al., 1998; Kasius et al., 2012), 17.4 mm (Rempel et al., 1998; Azami et al., 2014),16.6 mm (Rempel et al., 1998; Fujimoto et al., 2015) and 16.3 mm (Rempel et al., 1998; Rahmani et al., 2011) reported in previous studies. In addition, the mean value of median nerve CSA with no CMAP in our study was 19 mm2, which was also similar to 18.4 mm2reported by Fujimoto et al.(2015). Fujimoto et al. (2015) also reported the correlation between CSA and motor nerve conduction velocity. Similar finding regarding these two parameters was also observed in this study (r= –0.254,P= 0.03).
Nevertheless, there are several limitations in our studies.First, this is a non-randomized, cross-sectional cohort study with a small sample size. Second, the overall fair specificity of ultrasound parameters may be due to lack of standard criteria as described above. It may constrain the popularization of our findings. However, this is the first clinical study to explore this issue. Further longitudinal studies with a larger sample size are required to investigate if treatment outcome can be improved by taking these cut-off values into account for better treatment planning.
Conclusion
Ultrasound can be used to differentiate CTS accompanied by axonal degeneration. The defined cut-off values of W-CSA, W-P, R-CSA, R-P, ΔCSA and ΔP suggested in our study may help to clarify the pathological progress based on current ultrasound severity classification system, which provides clinical evidence to support better prognosis prediction and treatment guidance.
Author contributions:Conception and design of the study: XD and WYI;definition of intellectual content: XD, LHPC, KPL, SWL, and WYI; literatureretrieval, data analysis, statistical analysis, and manuscript editing: XD; clinical and experimental studies, data acquisition, and manuscript preparation:all authors; manuscript review: XD, KPL, SWL, and WYI; guarantor: WYI.All authors approved the final version of this paper for publication.
Conflicts of interest:The authors declared no competing interest.
Financial support:None.
Research ethics:This study was approved by the Institutional Review Board ofThe University of Hong Kong/Hospital Authorities in Hong Kong West (HKU/HA HKW IRB, Ref. Number: UW17-129), Hong Kong Special Administrative Region, China and performed in accordance with the Declaration of Helsinki.
Declaration of patient consent:The authors certify that they have obtained all appropriate participant consent forms. In the form, the participants have given their consent for their images and other clinical information to be reported in the journal. The patients understand that their names and initials will not be published and due efforts will be made to conceal their identity,but anonymity cannot be guaranteed.
Data sharing statement:Individual participant data (including data dictionaries) that underlie the results reported in this article, after deidentification(text, tables, figures, and appendices) are available. Study Protocol, Analytic Code and Clinical Study Report are shared. The data will be available beginning 9 months and ending 36 months following article publication for researchers who provide a methodologically sound proposal for individual participant data meta-analysis. Proposals may be submitted up to 36 months following article publication. After 36 months the data will be available in our University’s data warehourse but without investigator support other than deposited metadata.
Plagiarism check:Checked twice by iThenticate.
Peer review:Externally peer reviewed.
Open access statement:This is an open access article distributed under the terms of the Creative Commons Attribution-NonCommercial-Shar eAlike 3.0 License, which allows others to remix, tweak, and build upon the work non-commercially, as long as the author is credited and the new creations are licensed under identical terms.
Altinok T, Basysal O, Karakas H, Sigirci A, Alkan A, Kayhan A (2004) Ultrasonographic assessment of mild and moderate idiopathic carpal tunnel syndrome. Clin Radiol 59:916-925.
Azami A, Maleki N, Anari H, Iranparvar, Alamdari M, Kalantarhormozi M,Tavosi Z (2014) The diagnostic value of ultrasound compared with nerve conduction velocity in carpal tunnel syndrom. Int J Rheum Dis 17:612-620.
Baiee RH, AL-Mukhtar NJ, Al-Rubiae SJ, Hammoodi ZH, Abass FN (2015)Neurophysiological findings in patients with carpal tunnel syndrome by nerve conduction study in comparing with ultrasound study. J Nat Sci Res 5:111-128.
Bland JD (2000) A neurophysiological grading scale for carpal tunnel syndrome. Muscle Nerve 23: 1280-1283.
Caetano MR (2003) Axonal degeneration in association with carpal tunnel syndrome. Arq Neuropsiquiatr 61:48-50.
Cartwright MS, Hobson-Webb LD, Boon AJ, Alter KE, Hunt CH, Flores VH, Werner RA, Shook SJ, Thomas TD, Primack SJ, Walker FO, American Association of N, Electrodiagnostic M (2012) Evidence-based guideline: neuromuscular ultrasound for the diagnosis of carpal tunnel syndrome. Muscle Nerve 46:287-293.
Duncan I, Sullivan P, Lomas F (1999) Sonography in the diagnosis of carpal tunnel syndrome. AJR Am J Roentgenol 173:681-684.
Filius A, Scheltens M, Bosch HG, van Doorn PA, Stam HJ, Hovius SE,Amadio PC, Selles RW (2015) Multidimensional ultrasound imaging of the wrist: Changes of shape and displacement of the median nerve and tendons in carpal tunnel syndrome. J Orthop Res 33:1332-1340.
Fujimoto K, Kanchiku T, Kido K, Imajo Y, Funaba M, Taguchi T (2015)Diagnosis of severe carpal tunnel syndrome using nerve conduction study and ultrasonography. Ultrasound Med Biol 41:2575-2580.
Gagliardo A, Toia F, Maggì F, Mariolo AV, Cillino M, Moschella F (2015)Clinical neurophysiology and imaging of nerve injuries: preoperative diagnostic work-up and postoperative monitoring. Plast Aesthet Res 2:149-155.
Jablecki CK, Andary MT, So YT, Wilkins DE, Williams FH (1993) Literature review of the usefulness of nerve conduction studies and electromyography for the evaluation of patients with carpal tunnel syndrome.Muscle Nerve 16:1392-1414.
Kasius KM, Claes F, Verhagen WI, Meulstee J (2012) Ultrasonography in severe carpal tunnel syndrome. Muscle Nerve 45:334-337.
Kiernan CM, Mogyoros I, Burke D. (1999) Conduction block in carpal tunnel syndrome. Brain 122:933-941.
Klauser AS, Halpern EJ, Faschingbauer R, Guerra F, Martinoli C, Gabl M(2011) Bifid median nerve in carpal tunnel syndrome: assessment with US cross-sectional area measurement. Radiology 259:808-815.
Klauser AS, Halpern EJ, Zordo TD, Feuchtner GM, Arora R, Gruber J, Martinoli C, Loscher WN (2009) Carpal tunnel syndrome assessment with US-value of additional cross-sectional area measurements of the median nerve in patients versus healthy volunteers. Radiology 250:171-177.
Klauser AS, Abd Ellah MM, Halpern EJ, Siedentopf C, Auer T, Eberle G, Bellmann-Weiler R, Kremser C, Sojer M, Loscher WN, Gabl MF,Feuchtner GM, Jaschke WR (2015) Sonographic cross-sectional area measurement in carpal tunnel syndrome patients: can delta and ratio calculations predict severity compared to nerve conduction studies? Eur Radiol 25:2419-2427.
Lee D, Van HM, Janevski PK, Ganos DL, Ditmars DM, Darian VB (1999)Diagnosis of carpal tunnel syndrome: ultrasound versus electromyopathy. Radiol Clin North Am 37:859-872.
Lesser E, Venkatesh S, Preston D, Logigian E (1995) Stimulation distal to the lesion in patients with carpal tunnel syndrome. Muscle Nerve 18:503-507.
Miedany EY, Ashour S, Youssef S, Mehanna A, Meky FA (2008) Clinical diagnosis of carpal tunnel syndrome: old tests-new concepts. Joint Bone Spine 75:451-457.
Miyamoto H, Halpern EJ, M. K, Gabl M, Ar ora R, R. B, Feuchtner GM,Jaschke WR, Klauser AS (2014) Carpal tunnel syndrome- diagnosis by means of median nerve elasticity–improved diagnostic accuracy of US with sonoelastography. Radiology 270:481-486.
Mohammadi A, Afshar A, Etemadi A, Masoudi S, Baghizadeh A (2010) Diagnostic value of cross-sectional area of median nerve in grading severity of carpal tunnel syndrome. Arch Iran Med 13:516-521.
Mondelli M, Filippou G, Gallo A, Frediani B (2008) Diagnostic utility of ultrasonography versus nerve conduction studies in mild carpal tunnel syndrome. Arthritis Rheum 59:357-366.
Nakamichi K, Tachibana S (2002) Ultrasonographic measurement of median nerve cross-sectional area in idiopathic carpal tunnel syndrome:diagnostic accuracy. Muscle Nerve 26:798-803.
Ntani G, Palmer KT, Linaker C, Harris EC, Van der Star R, Cooper C,Coggon D (2013) Symptoms, signs and nerve conduction velocities in patients with suspected carpal tunnel syndrome. BMC Musculoskelet Disord 14:242.
Rahmani M, Ghasemi Esfe AR, Vaziri-Bozorg SM, Mazloumi M, Khalilzadeh O, Kahnouji H (2011) The ultrasonographic correlates of carpal tunnel syndrome in patients with normal electrodiagnostic tests. Radiol Med 116:489-496.
Rempel D, Evanoff B, Amadio PC, De Krom M, Franklin G, Franzblau A,Katz JN (1998) Consensus criteria for the classification of carpal tunnel syndrome in epidemiologic studies. Am J Public Health 88:1447-1451.
Sarria L, Cabada T, Cozcolluela R, Martinez-Berganza T, Garcia S (2000) Carpal Tunnel Syndrome-usefulness of sonography. Eur Radiol 10:1920-1925.
Stevens JC (1997) AAEM Minimonograph #26: The electrodiagnosis of carpal tunnel syndrome. American Association of Elecrodiagnostic Medicine. Muscle Nerve 20:1477-1486.
Swen WA, Jacobs JW, Bussemaker FE, de Waard JW, Bijlsma JW (2001)Carpal tunnel sonography by the rheumatologist versus nerve conduction study by the neurologist. J Rheumatol 28:62-69.
Tai TW, Wu CY, Su FC, Chern TC, Jou IM (2012) Ultrasonography for diagnosing carpal tunnel syndrome: a meta-analysis of diagnostic test accuracy. Ultrasound Med Biol 38:1121-1128.
Valls-Sole J, Leote J, Pereira P (2016) Antidromic vs orthodromic sensory median nerve conduction studies. Clin Neurophysiol Pract 1:18-25.
Weber F (1997) Conduction block and abnormal temporal dispersion--diagnostic criteria. Electromyogr Clin Neurophysiol 37:305-309.
Werner RA, Andary M (2002) Carpal tunnel syndrome: pathophysiology and clinical neurophysiology. Neurophysiol Clin 113:1373-1381.
Werner RA, Andary M (2011) Electrodiagnostic evaluation of carpal tunnel syndrome. Muscle Nerve 44:597-607.
Wiesler ER, Chloros GD, Cartwright MS, Smith BP, Rushing J, Walker FO(2006) The use of diagnostic ultrasound in carpal tunnel syndrome. J Hand Surg Am 31:726-732.
Wong SM, Griffith JF, Hui AC, Tang A, Wong KS (2002) Discriminatory sonographic criteria for the diagnosis of carpal tunnel syndrome. Arthritis Rheum 46:1914-1921.
Wong SM, Griffith JF, Hui AC, Lo SK, Fu M, Wong KS (2004) Carpal tunnel syndrome: diagnostic usefulness of sonography. Radiology 232:93-99.
Zhang L, Rehemutula A, Peng F, Yu C, Wang TB, Chen L (2015) Does the ratio of the carpal tunnel inlet and outlet cross-sectional areas in the median nerve reflect carpal tunnel syndrome severity? Neural Regen Res 10:1172-1176.
Ziswiler HR, Reichenbach S, Vogelin E, LM B, Villiger P, P J (2005) Diagnostic value of sonography in patients with suspected carpal tunnel syndrome: aprospective study. Arthritis Rheum 52:304-311.
- 中国神经再生研究(英文版)的其它文章
- Neuroprotective effects of statins against amyloid βinduced neurotoxicity
- Detection of thinned corticospinal tract and corticoreticular pathway in a patient with a calf circumference discrepancy
- Dyslipidemia modulates Müller glial sensing and transduction of ambient information
- Mitochondrial transplantation strategies as potential therapeutics for central nervous system trauma
- A new direction for Alzheimer’s research
- DNA plasticity and damage in amyotrophic lateral sclerosis

