
A Cloud-Assisted Malware Detection and Suppression Framework for Wireless Multimedia System in IoT Based on Dynamic Differential Game
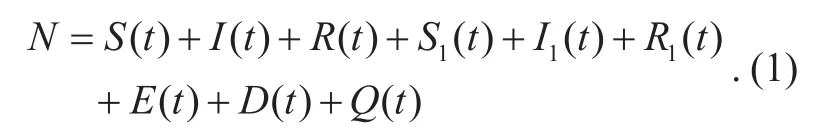
2018-03-13 06:26:34WeiweiZhouBinYu
China Communications 2018年2期
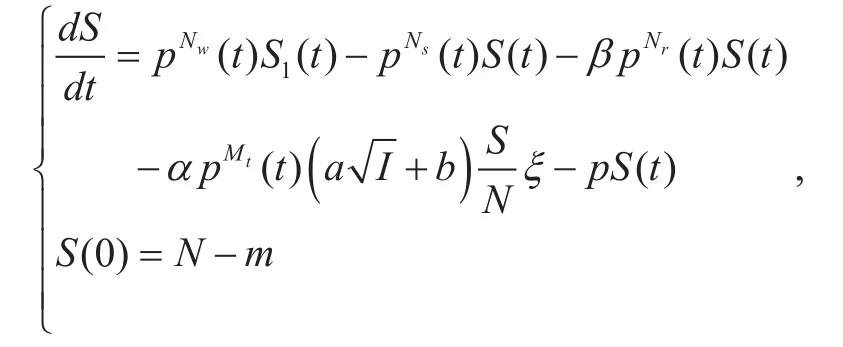
Weiwei Zhou*, Bin Yu
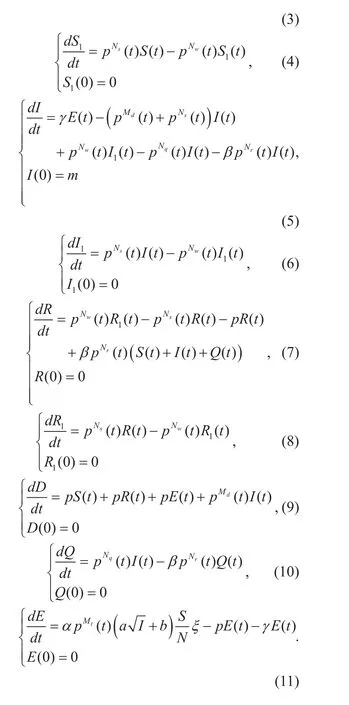
Zhengzhou Institute of Information Science and Technology, Zhengzhou 450001, China
I. INTRODUCTION
Numerous intelligent sensor nodes with constrained computational capabilities and security mechanisms are currently embedded into various multimedia devices worldwide. As an emerging urban infrastructure, the Internet of Things (IoT) with multiple wireless multimedia devices is increasingly gaining attention in the field of next-generation information perception and massive information processing [1]. Mobile applications and ubiquitous connectivity provided by the IoT have been an indispensable part of our daily life for work,banking, tasking, entertainment and even medical treatment. Wireless multimedia system (WMS) is widely adopted to continuously collect mass information and control the state of remote epuipments. The data collected by multimedia devices traditionally includes temperature, voices and binary images. Since the transmitting power and processing capability is constrained, the sensor nodes embedded in multimedia devices deliver the data to neighbors according to routing table and optimal path. The distributed topology of WMS makes it easy to transmit data to the sink ultimately.Then the access point between the sink and cloud platform is constructed for data aggregation, cloud computing and other further services. Finally, the processed results will be presented to the clients again.
Malwares such as malicious codes, worms,viruses and reprogramming frames can easily infect the target nodes and seriously threaten multimedia devices such as the wireless routers and terminals with the constrained storage, limited transmition distance and finite battery [2]. Alternatively, both the domestic and international achievements indicate that a new generation of wireless reprogramming protocols are equipted with the functions to reconfigure sensor nodes in WMS without physical contact. This property provides the convenience of network construction. At the same time, it brings the possibility to execute malware propagation throughout the WMS.Due to constrained resource, the sensor nodes in WMS is of low authentication intensity and intrusion-detection capability, which is seriously vulnerable to the malware propagation with self-replication instinct. Besides,the property of multi-hop path in distributed network brings the flexibility and convenience of data gathering to sensor nodes with the increase of great concerns for malware infection. Malware can read data from and write data to the memory cache and eavesdrop on the privacy data gathered or relayed by the infected nodes. What’s more, the infected nodes can broadcast the malicious codes to the neighbors for further propagation. Thus, in order to promote the domains of IoT application,it is crucial to construct the malware detection and suppression model to prevent the malware propagation in WMS.
In recent years, many researches related to malware detection and suppression have been illustrated to protect the data and the security of network architecture. Many kinetic equations and state-transition graphs that accurately depict the process of malware propagation have been successively proposed [3]-[5].The epidemiological model (EMM) in which infected state is divided into two sub-states can efficiently depict the characteristics of malware propagation in one-to-many network[6]. In classical EMM model, the sensor nodes are divided into Susceptible (S), Infected (I),Quarantine (Q) and Recovery (R) depending on the allocation of behavior sets directed by network system and malware. However, the EMM model is based on the assumption that infected nodes have sufficient computational resorce, which is extremely in contradiction with resource-constrained WMS. To solve these conflicts, some researchers started to investigate self-learning model for the construction of security traces among susceptible nodes, which introduced Markov chain based graph into the kinetic analysis [7]. But Markov chain does not take it into consideration that the coordinator has the ability to broadcast frames to influence the state of sensor nodes.Depending on the characteristics of malicious codes and cellular automata propagation model, Penget alput forward an examination of classification algorithm to evaluate the malware propagation in short-range wireless protocol [8]. More classical epidemic models [9]-[13] are introduced through the combination of multiple features and different states, whose state-transition graphs are classified as SI,SIS, and SIR for different scenarios. However,these state transition architectures need further improvements in reflecting actual communication modes of multimedia devices. Considering the cloud-assisted framework and specific states in WMS, the modified epidemic model for situation awareness is expended, which is one of the highlights in this paper.
In addition to the calculation of nodes in different states, optimal straregies for malware suppression are also emerging as important considerations. The coordinator can immune susceptible nodes according to the strategy updating and broadcast security patches to cure the infected nodes. The state transition of nodes can be influenced by communication parameters, which are controlled by the WMS and malware. Thus, the crucial problem is to acquire the Nash equilibrium of the dynamic differential game based on modified kinetic equations.
Nowadays, game formulations has been widely adopted in the field of strategy optimization in wireless communications [14]. According to the network topology and parameter constraints in time-variant environment,the model-free reinforcement learning game is proposed in literature [15]. But there are obvious distinctions between the time-variant network and WMS. Compared with the one-tomany framework in time-variant encironment,coordinator in hierarchical distributed network plays an vital role in malware suppression.Numerical configuration of parameters (data reception rate, sleeping rate, security patching rate,etc) is the main measure to execute the defense of malware, which is the fundamental function of the coordinator. [16], [17] present a static strategy mechanism in which the value of control parameters is allocated to the devices depending on the constraints of Nash equilibrium. However, the game model is lack of real-time adjustment. When malicious strategies are updated dynamically, the strategies will be disabled.
Generally, the existing malware-defense researches are not completely suitable for the hierarchical topology of WMS. Thus, more attention should be paid to the combination of the framework to facilitate malware detection and dynamic defense strategy in WMS. The security cost should be minimized with the finite intervals of network parameters in WMS.
•Contribution.In this paper, depending on the distributed topology of WMS and dynamic differential game, a modified epidemic model is established and the cloud-assisted malware detection and suppression framework is designed in WMS. Compared with SIR model,the characteristics of sensor nodes and base station linked with the coordinator in WMS is taken into consideration, which adds exposed state and quarantine state into the construction of kinetic formulations. Considering the constrained transmission range, the number of susceptible nodes that infected nodes can send malicious codes to is accurately computed. The target cost function is calculated in dynamic differential game between the attacker and defender and the existence of Nash equilibrium is proved using the linear model and Hamiltonian function. Combining the target cost function and constraint conditions of Hamiltonian function, the solution to malware suppression is calculated and the corresponding algorithm towards malware detection and suppression is illustrated.
•Organization.The rest of this paper is organized as follows. Section II briefly reviews the structure of WMS and introduces the cloud-assisted malware detection model and the assumptions of malware-infected system.Then the state transition and modified epidemic model to evaluate the malware propagation in WMS are constructed and the range of infected nodes with actual infectivity to susceptible nodes is analyzed in Section III. In Section IV, the solution towards malware-infected WMS is calculated. The algorithm of cloud-assisted malware detection and suppression is presented in Section V and then the performance evaluation of the new proposal is followed in Section VI.
II. PRELIMINARY STUDIES
The structure of classical multimedia system and cloud-assisted malware detection model are described in this section.
2.1 Structure of multimedia system
The characteristics of multimedia system in IoT which include convenience, inexpensiveness and ubiquity make it possible to connect a huge amount of wired and wireless devices.Due to the constrained resource, wireless multimedia devices are commonly equipped with multiple sensor nodes, which adopt the communication protocol of wireless sensor networks (WSNs) for low-power consumption,high redundancy and reliability. These wireless multimedia devices constitute the WMS to achieve network communication, situation awareness, data aggregation, and remote automatic control. Unfortunately, openness of the wireless channel and homogenesis of the sensor nodes make it easily infected by malicious codes. With the rapid development of WMS in various fields, its security and privacy are getting more and more attention, especially in the information condentiality and privacy.
The network architecture of the WMS in IoT is illustrated in Figure 1. Traditionally,the structure of multimedia system mainly includes the multimedia relay system, multimedia sensing system, wired service system and multimedia service system. Usually, the processor are embedded into wired service system(WSS). The WSS, which has high intelligence in the fields of information matching and screening, cloud computing, and neural network, consists of access point, cloud and other communal facilities. Due to the mobility of data transmission and the wide range of data collection in WMS, the sensor nodes in WMS are adopted for multi-hop data transmission.The WMS includes sensor nodes and base station, which is similar to WSNs. Base station can configure network settings and send commands. Most importantly, it interacts with other sensor nodes to achieve the malware suppression through broadcasting data frame to update the secutity parameters and variables in WMS. Since the WMS is set up to broadly execute unverified applications, the malware can easily infect the sensor nodes and spread in WMS. For example, the vulnerabilities of applications and protocol can be exploited by malware, and infected nodes infiltrate the WMS to launch vicious attacks. Moreover, the illegitimate sensor nodes may tamper with relayed multimedia data or excessively exhaust the energy resource to make QoS routing paths unavailable to other sensor nodes. Thus,it is an extremely urgent task to construct the security algorithm to defend against malware in WMS.
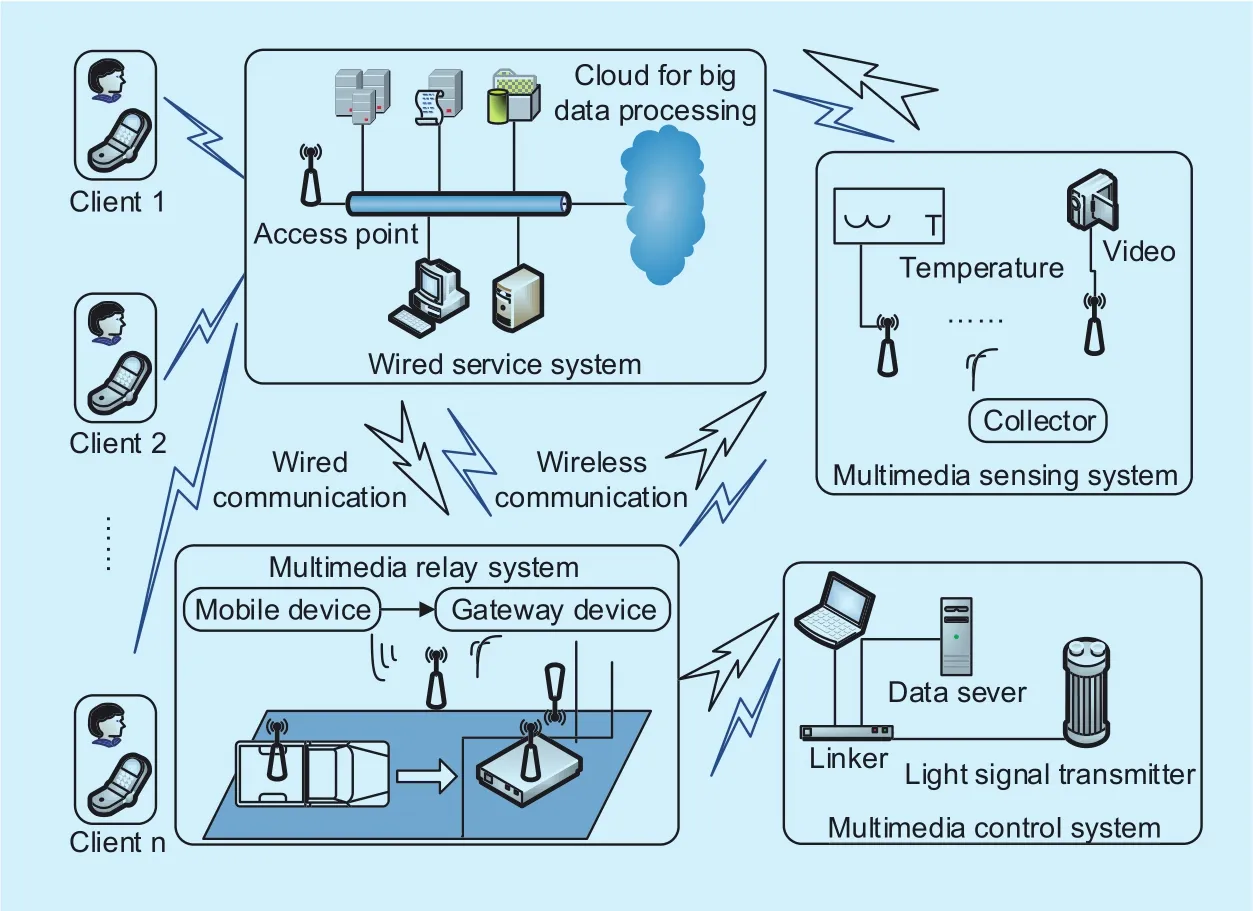
Fig. 1. Network architecture of WMS in traditional IoT.
2.2 Cloud-assisted malware detection model
In order to evaluate if it’s time to start or turnoff the malware suppression mechanism in WSM, The cloud-assisted malware detection model is presented in this subsection. In the framework, the malware detection model is divided into two parts: learning malware behaviors and detecting malware intents. As is shown in Figure 2, the learning phase consists of droidsniffer, performance examination and machine learning, which needs to consume significant storage and computation resource for data processing. Hence, the cloud in wired service system is introduced into the learning phase in WMS.
Droidsniffer is a data sniffer for network behavior collection in WMS. Then performance examination is responsible for index checking to trace the suspicious behaviors.The result analysis to make a database of malicious behaviors is conducted by cloud-assist-ed machine learning devices. The screening methods in machine learning include SVM,BP neural network, modified Markov chain,etc. Depending on the modified database, the set of malicious behaviors in wireless sensor nodes is updated.
The other half bottom of Figure 2 depicts the flowchart of malware-intent detection. This phase is executed by sensor nodes in WMS.The actual detection procedures include program execution, feature matching and malware detecting. Then the feedback of the results will be transmitted to droidsniffer for further improvement. It is assumed thatmode=1 represent the WMS is attacked by malware. Conversely,mode=0 indicates a secure system.
III. SYSTEM MODEL
In this section, based on the characteristics of malware propagation and communication rules in WMS, the graph of state evolution is constructed, which indicates the relationship among various states. Then the modified epidemic model with a set of kinetic equations is introduced, which takes exposed, sleeping and quarantine nodes into account. The transitions between nodes in different states are clearly presented and the number of nodes in each state is precisely calculated through initial values and dynamic differential equations.
3.1 State evolution
In traditional epidemic model, the architecture of WMS can be represented by regions containing susceptible nodes, infected nodes, and recovered nodes [18], [19], [20]. The distribution characteristics of the nodes in each state is shown in Figure 3.
A susceptible node (S) is a short-range wireless node which is not infected by the malicious codes, but is prone to infection.A sensor node which is contaminated by the malware can be defined as infected node (I).A functional sensor node in setRis referred to as recovered sensor node. The state that the energy resource of sensor node is exhausted is typically denoted asD.
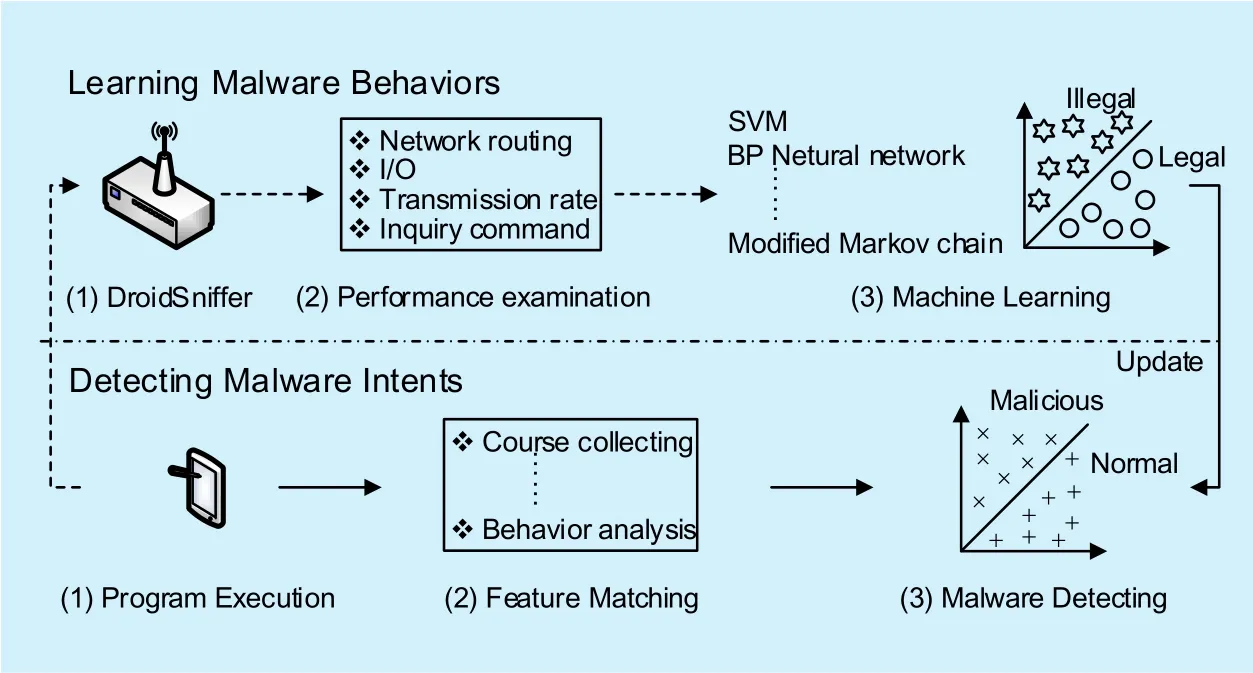
Fig. 2. Flowchart of the cloud-assisted model for malware detection.
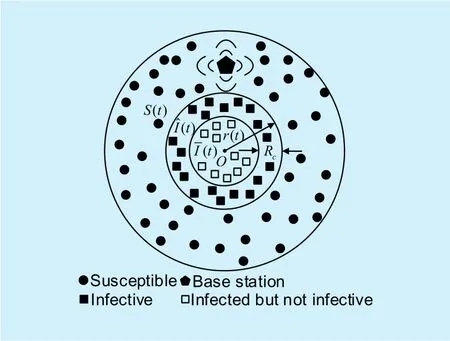
Fig. 3. Structure of WMS.
Let the total number of nodes in the network beN.σdenotes the average density of sensor nodes in each unit area. When the distribution of nodes is uneven in actual deployment, it can eventually be equivalent to a uniform density.Let the number of susceptible, infected, and recovered nodes at timetbe denoted byS(t),I(t), andR(t), respectively. An omnidirectional antenna is embedded in each of the sensor nodes, whose communication radius is denoted byRc.r(t) is the region radius of infected nodes at timet. Since the distance between infected nodes inand susceptible nodes inS(t) exceeds the maximum transmission rangeRcin Figure 3., these nodes cannot infect the external susceptible nodesS(t). Thus, the number of infected but not infective nodes can be denoted byindicates the number of infected nodes whose distance from the susceptible nodes is less than radiusRc. Then we haveThe coordinator embedded in base station has the ability to broadcast security patches to immunize the susceptible nodes and restore infected nodes to recovered nodes.
The security mechanism in WMS, such as anormaly detection and misuse detection, can verify and quarantine infected nodes based on the illegal behaviors and operations. The nodes switch to the sleeping state with the probability controlled by the WMS and can be awaked again after it receives the command. Furthermore, sensor nodes in the sleeping state lose its ability of transmitting and receiving the data.Thus, the states of sensor nodes can be classified into the following sets according to their characteristics and classical epidemic model.
Due to the characteristics of multimedia system, there are five more states in WMS. A sensor node switches from stateStoS1if it executes the sleep command. Similarly, the stateI1andR1are transformed fromIandRseparately.The set in which the infected nodes are isolated by the malware-detection mechanism and lose the ability to infect susceptible nodes is denoted as quarantine (Q). Before the sensor nodes in setSbecome fully infected its network performance is partially affected such as low forwarding efficiency, slow processing speed,etc. This set is defined as exposed set (E).
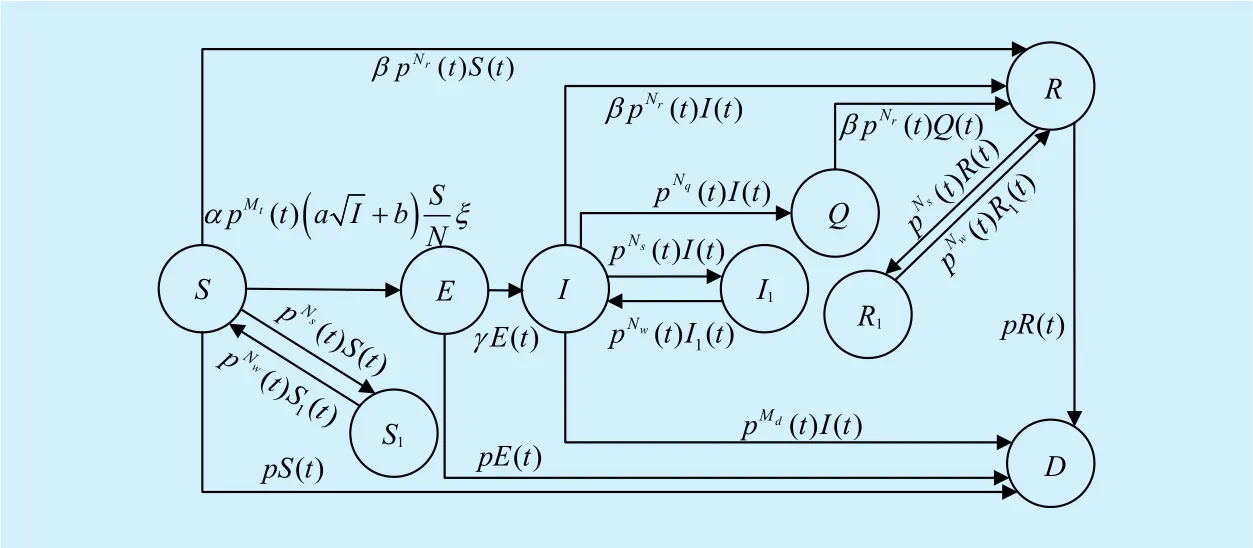
Fig. 4. Diagram of state transition in WMS.
3.2 Modified epidemic model
Let the number of nodes in stateS,I,R,S1,I1,R1,D,EandQbe denoted byS(t),I(t),andQ(t) at timet, respectively. Assume that the correlation coefficient of the nodes converted fromStoIis denoted byα, which is positively correlative to the maximum transmission rate of malicious code controlled byI. The ratio of actual transmission rate to the maximum ofIis denoted byThe probability that a node is transformed fromItoDisandindicate the probability of the node fromStoS1andS1toS, respectively. Since the probability of transition between work state and sleeping state is only correlative to the configuration of protocol parameters, we assume thatpNts()denotes the probability fromItoI1andRtoR1, andindicates the probability fromI1toIandR1toR. For a sensor node in setI,QorS, it is transformed to node in setRwhen the node receives the security patch and immunizes or cures itself. In order to simplify the calculation, the ratio of actual patch-transmission rate to the maximum controlled by base station can be denoted byβis a correlation coefficient of a node fromStoRorItoRdepending on the maximum patch-transmitting rate of base station. The sensor node transformed fromItoQis controlled by intrusion detection mechanism with the transition rate
The relationship of sensor nodes in each state can be described as
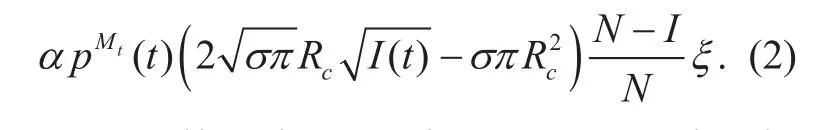
Assume that there exist only infected nodes and susceptible nodes in the network,which has been shown in Figure 3. Let the region radius of infected nodes be denoted byThe number of infected nodes which have the ability to infect other susceptible nodes can be calculated asThe assumption is that the average number of neighbors of sensor nodes isξ. Therefore, there are onlysusceptible nodes in the neighbors of each node. Thus, the instantaneous increase of infected nodes is given as:
Actually, there exist sensor nodes in nine states and the state-transition diagram is clearly presented in Figure 4..Assume that the initial conditions areI(0)=man dThe energy resource of susceptible or recovered sensor nodes is exhausted due to overload of data transmission with constant probabilityp. The probability fromEtoIis denoted asγ. Then,the instantaneous increase of the number of nodes in each state at timetis calculated and marked in Figure 4..σ1represents the average density of infected nodes in each unit area in this situation, which can be expressed as:

In order to simplify the equation, assume thatAccording to the formula (2), it can be inferred that the instantaneous increase of sensor nodes fromStoIispending on the above analysis and state transition diagram, the differential equation of each state is calculated as follows.
IV. DYNAMIC DIFFERENTIAL GAME MODEL
In this section, the modified epidemic model proposed in section 3 is employed to construct the multi-stage game controlled by the malware and WMS over time. The differential game involves a group of kinetic equations in each state and the target cost functionJ. The malware takes efforts to maximize the functionJ, while the system chooses defense strategies to minimizeJfor the highest security intensity towards the malicious codes. Then the Hamiltonian function is introduced to simplify the solution of Nash Equilibrium. The optimal malware-defense strategies of the WMS are shown in Theorem 1.
4.1 Formulation
Definition 1:Assume that the total duration is denoted byT. The time interval in each game stage isT0, which is related to the characteristics of the protocol in WMS. Consequently,the number of game stages in durationIfmis an integerotherwise,is the integer which is greater thanmbut smaller thanm+1. The malware-defense gameKin WMS is a 4-tuplewhere:
•N={malwareA, the WMSD} is a set of attacker and defender;

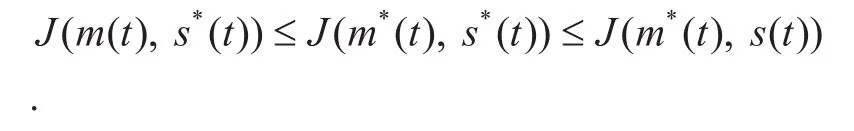
If the malware always selects the optimal strategiesm*(t) after learning the defense strategiess(t), thenis the maximum value ofJ. Conversely,denotes the lower value of the game. Obviously, we haveAssume thatWhen the malware chooses the strategiesm*(t), the value ofJis at least equal toV, regardless of the strategies taken by the WMS. Conversely, the value ofJcan not exceedV. If the malware and WMS take the optimal strategies, then
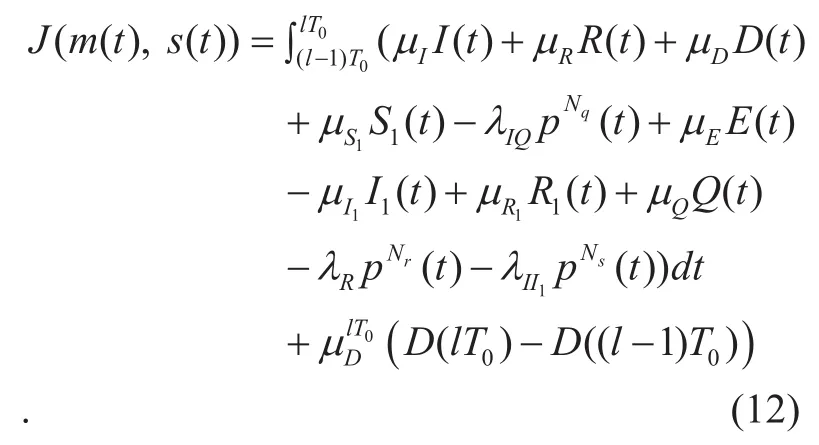
Note that the target cost functionJis related to the measured value of QoS in WMS.Due to the destruction of data confidentiality and privacy and the negative impact on computation and communication in infected nodes, the instantaneous cost of setIcontrolled by malware at timetis defined asµII(t), whereµIdenotes the coefficient of instantaneous cost related to infected nodes andµI>0. The exhausted dead nodes will not transmit or relay the data through routing path. Thus, the instantaneous cost at timetin this situation can be denoted byµDD(t),whereµDis the correlation coefficient andµD>0. Similarly, the recovered nodes install security patches. They will run the security mechanism at timetto defense malware and thus instantaneous costµRR(t), whereµR>0. Let the instantaneous cost of sleeping nodes inS1,R1andI1at timetbe denoted byrespectively,whereindicates the sleeping from infected nodes can suppress the malware propagation. For the quarantine nodes, they lose the ability to communaticate with other sensor nodes. Therefore, the instantaneous cost above is denoted asµQQ(t),whereµQ>0. The instantaneous cost ofE(t)can be expressed asµEE(t).
The coordinator desseminates the security patches or sleeping commands and executes the malware detection to quarantine the infected nodes at timetsimultaneously. Moreover, the increased sensor nodes in setQ,RandI1benefit the QoS in WMS. Hence, the instantaneous cost of them can be denoted byrespectively, whereThe terminal cost) represents the behavior that dead nodes are replaced with newly deployed ones at the end of game stage.
From the above analysis and assumptions,the target cost functionJcan be expressed as:
The WMS selects the optimal defense strategies to minimize the value ofJ. Henceforth,the objective of the game is to calculate the solution of Nash equilibrium in the differential gameK.
4.2 Computation of optimal solutions
The optimal defense strategy is in accordance with the aim to minimize the target cost functionJin differential gameK. In this subsection, the Hamiltonian is introduced to simplify the solution process. Combining the state function with the initial value of the states, the optimal stragegies of the players in different intervals of the coefficients is obtained.
As the range of parameters in players’ control strategies is a continuous interval, the optimal strategy of the game can not be directly solved by the linear analysis and comparision of numerical calculation. Moreover, the uncertainty of the parameters in control strategies makes it impossible to analyze the convexity of target cost functionJ. Therefore, the Hamiltonian is used to convert the nonlinear optimization problem into a linear solution problem.
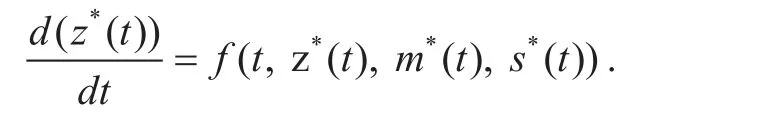
Letz(t) be the trajectory of nine states that vary with the timet. Thus,z*(t) represents the state trajectory of the saddle point (i.e.,andAt the beginning of thelthgame stage, we haveThen, the differential system is derived:
Due to the existence of saddle-point strategies, the target cost functionJand functional analysis is adopted to construct the Hamiltonian. The co-state function can be expressed as:
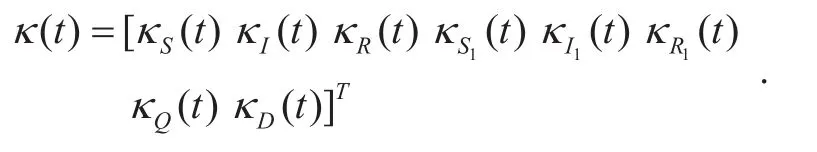
Depending on the Lagrange multiplication operator, the new augmented functional is constructed as:
whereκ(t) denotes the coefficient vector of Lagrangian multiplier with nine dimensions.
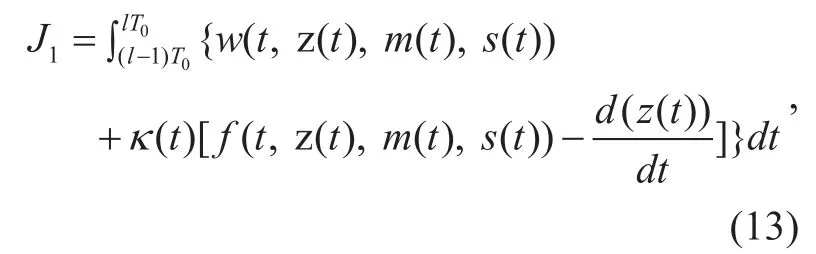
From the Eq. (13), the scalar function can be described as:

More specifically, the Hamiltonian is defined asThen the Eq. (13) can be simplified as:
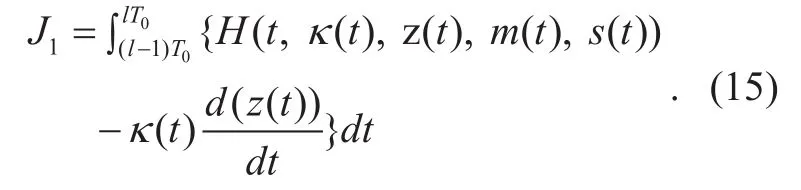
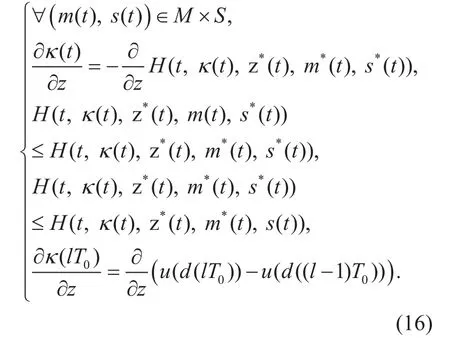
Mathematically, the Eq. (15) can be extended with the euler’s formula to derive the necessary conditions of the extremum in functionalJ. The conditions can be shown as:
Combining the Eq. (12) with (14), the Hamiltonian can be distinctly calculated, which is expressed as:
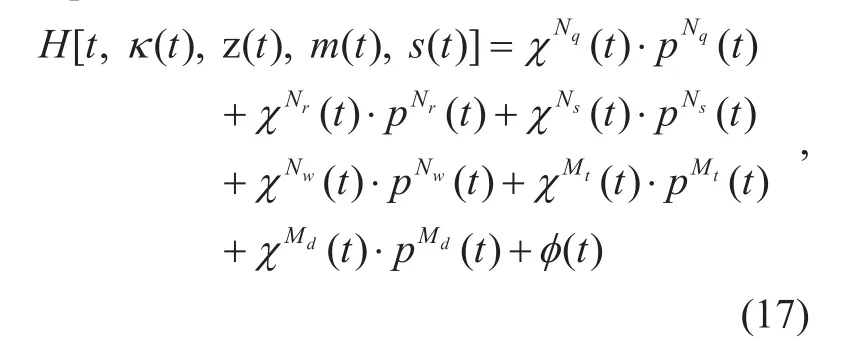
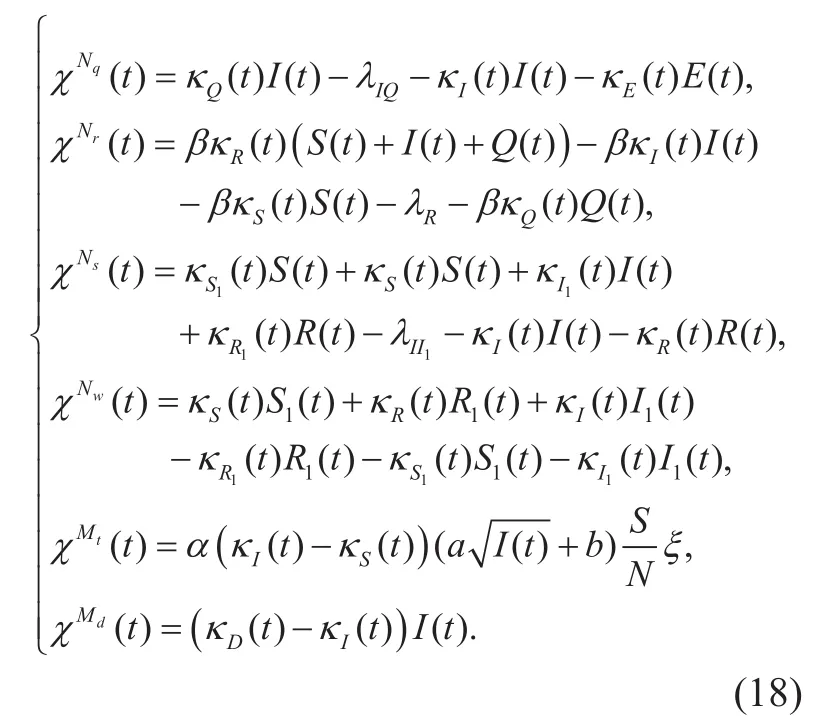
whereχNq(t),χNr(t),χNs(t),χNw(t),χMt(t), andχMd(t) refers to the coefficientandpMt
d() at timet, respectively. Thus, the coefficients of control strategies (i.e.,controlled by WMS andcontrolled by malware) are derived from the corresponding Hamiltonian computed in Eq. (17).
In accordance with the Hamiltonian (i.e.,in Eq. (17)) and the necessary conditions of the extremum in functionalJ(i.e., the conditions in Eq. (16).),the differential equations of the co-state function in each state (i.e.,andand its extremumsandcan be calculated.
Now, according to the solutions of the Eq.(3)-(11) and the differential equations of the co-state function, the state and the co-state functions at timetcan be uniquely specified.It can be inferred that the opitmal defense strategies of saddle-point in the gameKare to acquire the conditions to maximize the Hamiltonian. Conversely, the optimal strategies for the malware correspondingly minimize the Hamiltonian. Hence, the solution to the dynamic differential gameKis established in Theorem 1.
Theorem 1:Depending on the differential gameKdeclared in Definition 1, the optimal strategies of control parameters (i.e., saddle point) for malware and WMS subject to constraints in the 4-tuplecan be expressed as follows.
The optimal strategies of control parameters for malware are shown as below.
IfχMt(t)≥ 0, thenotherwise
Meanwhile, the optimal strategies of defense parameters for WMS are presented as follows.
IfχNw(t)≥ 0, can be linearly denoted by the parameters of control strategies and the corresponding coefficients in Eq. (17).More importantly, considering the necessary conditions for the functional extremum, the optimal strategy of saddle point are required to satisfy
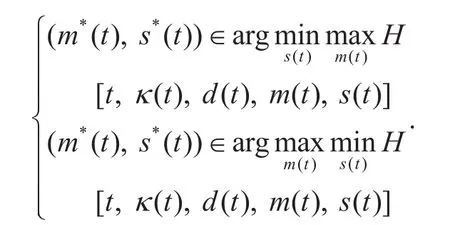
Therefore, if the coefficients of defense strategies for WMS (i.e.,χNq(t),χNr(t),χNs(t), andχNw(t)) in the Hamiltonian are over zero, the parameters for optimal defense strategiesandtake the minimum values within the constraint range in Definition 1. Conversely,these parameters choose the maximum ones.On the other hand, if the coefficients of control strategies for malware are less than zero,the corresponding parameters (i.e.,pNtw() andpMt
t()) choose the minimum values.
V. PROPOSED ALGORITHM FOR MALWARE DETECTION AND SUPPRESSION
In this section, combining the cloud-assisted malware detection model and Nash equilibrium (saddle point) of the dynamic differential gameK, a malware-defense algorithm is proposed to suppress the propagation of malicious codes in WMS. The proposed algorithm minimizes the value of target cost functionJfor the WMS to achieve the maximum security intensity against malware propagation.
Note that the state and co-state functions at timetis feasible. Depending on the Eq.(18), it is worth noting thatχNq(t),χNr(t),χNs(t),χNw(t),χMt(t), andχMd(t) can be computed respectively. Actually, according to the Eq. (3)-(11) and the kinetic equations of the co-state function,andκ(t) are accurately calculated at timet. Thus,the optimal strategies to set the values of the parameters in each game stage are determinate to the WMS. The malware detection and suppression algorithm in WMS with saddle point solution are presented in detail.
Malware detection and suppression algorithm
Input: initial values of control parametersand the state conditionsI(0)=m,R(0)=R1(0)=S1(0)=E(0)=I1(0)=Q(0)=D(0)=0,S(0)+I(0)+E(0)+R(0)+S1(0)+I1(0)+R1(0)+Q(0)+D(0)=N. Sett=1.
Output: strategies for malware detection and suppression
Step1. Ift≤kandmode=1, compute the total number of sensor nodes in each state in thetthgame stage via the Eq. (3)-(11), i.e.,S(t),I(t),R(t),S1(t),I1(t),R1(t),Q(t),E(t),D(t);otherwise, go to Step7.
Step2. Substitute the values of state function into the kinetic equations of co-state functions to calculate the corresponding values (i.e.,κS(t),κI(t),κR(t),κS1(t),κI1(t),κR1(t),κQ(t),κD(t)).
Step3. Substitute the values of the state and co-state function into the Eq. (18) to compute the coeffients of control strategies for malware suppression(i.e.,χNq(t),χNr(t),χNs(t),χNw(t)).
Step4. SubstituteχMt(t) andχMd(t) into the Theorem 1. Then, calculate the values of
Step6. Sett=t+1. Go to Step1.
Step7. End.
Table I. Parameter conguration.
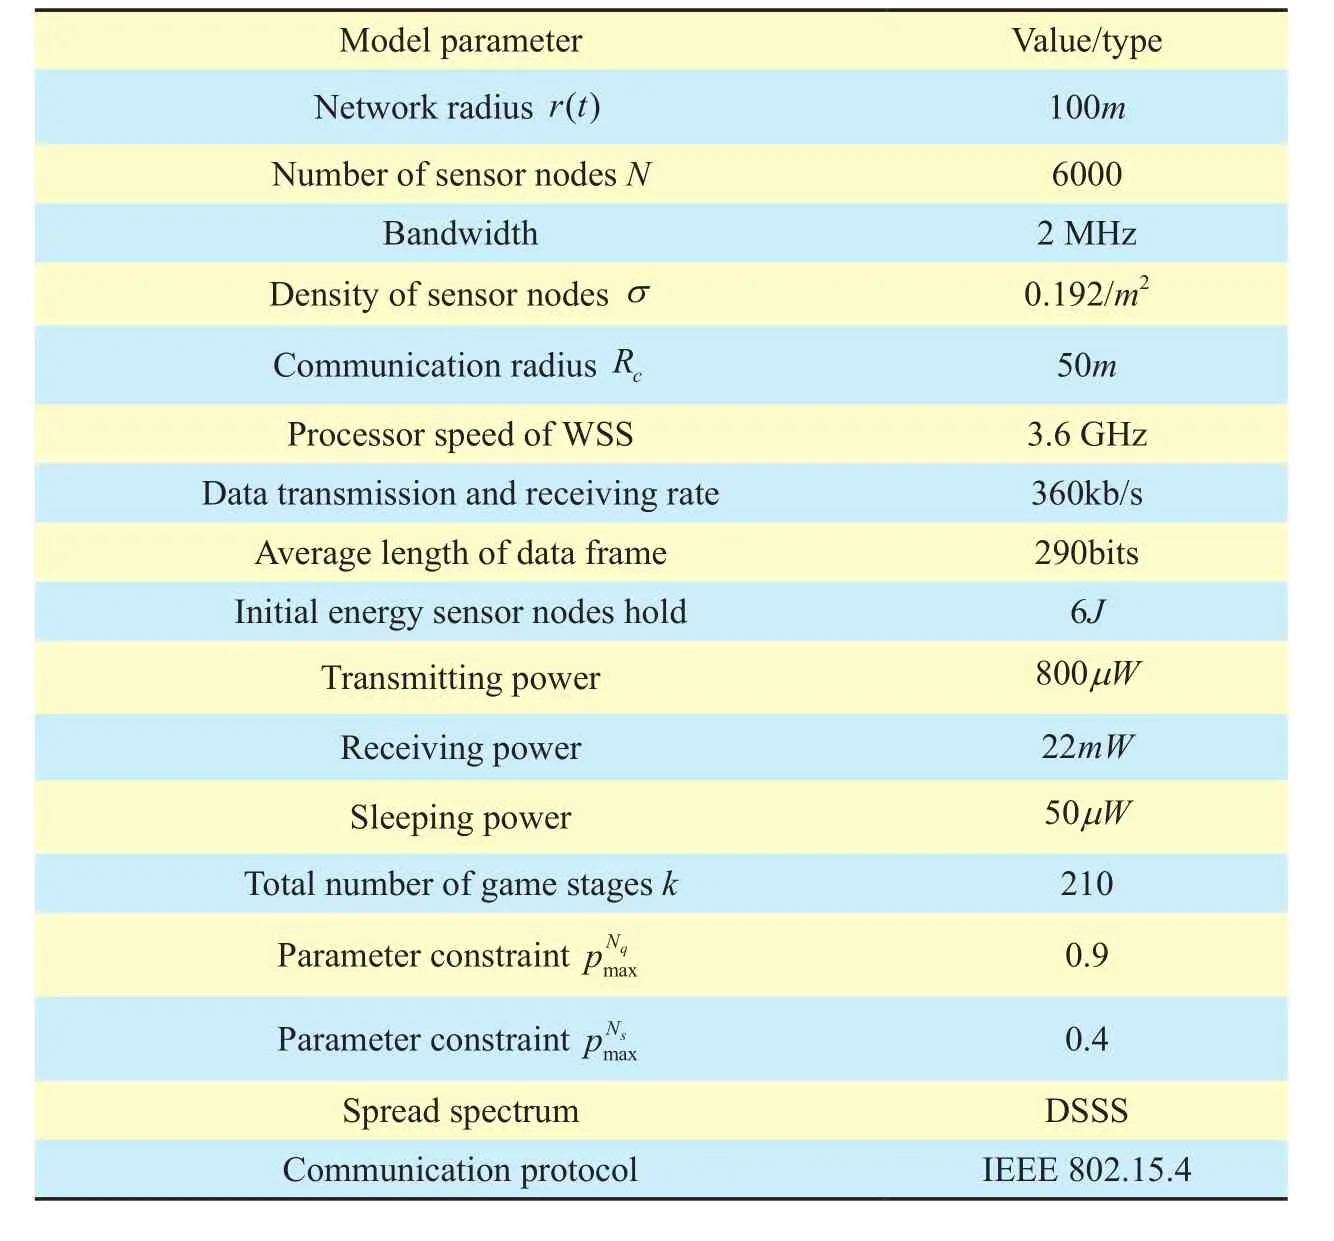
Table I. Parameter conguration.

Fig. 5. Framework of multimedia system.
VI. SIMULATION RESULTS AND ANALYSES
Experiments and network simulations have been performed by evaluating the number of sensor nodes in each state to validate the performance of the proposed algorithm in this section. Then the overall damageJ(target cost function) in different schemes and game stages is presented and analysed. Finally, the comparison of indicators shows that the new proposal can provide the higher security intensity against malicious codes and efciently suppress the malware propagation in WMS.
The algorithms in literature [7], [8] and this paper are performed via the simulator NS2,while corresponding numerical computations and comparisons are executed via MATLAB 2014b. IEEE 802.15.4 is adopted as the fundamental protocol and network environment in WMS. Figure 5. illustrates the hierarchical topology of WMS in the simulation.
Depending on the real-time simulation deployed by NS2, it is analysed in depth how the state transition is controlled by the parameters (i.e.,controlled by the malware,controlled by the WMS) over time.
In order to simplify the computation and data processing, assume that there is only one sensor node in each multimedia device. Then,the paremeter setting and corresponding network conguration is illustrated in Table 1 and Table 2.
Note that only one sensor node is embedded in each multimedia device. Thus, the changes of the number of multimedia devices in different states can be denoted by the fraction of sensor nodes. In order to compare the fraction of sensor nodes in each state accurately, the experiments are repeated 20 times and the average of all the results is presented in Figure 6.
Numerical curve of literature [7] reveals that the fraction of sensor nodes inSin the final game stage is approximately 1.96%.The kinetic equations in literature [7] do not take into consideration the effects of exposed,sleeping and quarantine sensor nodes on Nash equilibrium, which leads to a non-negligible deviation in the computation of the thresholds of malware-defense mechanism. In the first game stage, the switching of defense parameters in literature [7] is delayed, and thus the fraction of susceptible nodes decline rapidly.As is shown in Figure 6, fraction of infected nodes rises to the maximum of 44.71% in the 43thgame stage. With the increase in the fraction of recovered nodes, the possibility to infect susceptible nodes is smaller and smaller.Thus, infected nodes start to reduce the rate to disseminate malicious codes to neighbors and execute the command to kill themselves.Moreover, in the framework of the state transition in literature [7], it is assumed that all the infected nodes have the ability to execute the infection. However, infected nodes with a distance greater thanRcfrom the susceptible ones are non-infective to other nodes, which is analysed in Figure 3. Unfortunately, it is not taken into account to construct the set of differential equations. When the repeated game in literature [7] achieves the Nash equilibrium,the fraction of susceptible nodes is at a low level and the probability of nodes fromItoDis relatively too large. There is a significant difference between the trajectory of simulation results and the calculated values in literature[7]. Consequently, the kinetic equations in literature [7] can not accurately depict the process of state transition in WMS.
Compared with the literature [7], the epidemic model in literature [8] is modified in which the range of the infected nodes with actual infective ability is taken into consideration. But the kinetic equations of exposed,sleeping and quarantine nodes are not constructed. As shown in Figure 6., the fraction of susceptible nodes in literature [8] is 8.19%in the 210thgame stage, which is significantly better than that in literature [7]. Besides, the peak point of the curve of infected nodes in literature [8] is later than that in literature [7]and the rate at which dead nodes increase is slower. Nevertheless, the exposed, sleeping and quarantine nodes are regarded as susceptible ones in literature [8] for further calculation. Due to this reason, the malware-defense model in literature [8] is lack of accuracy in parameter switching. The fraction of dead and infected nodes remains constantly at a high level under the Nash equilibrium.
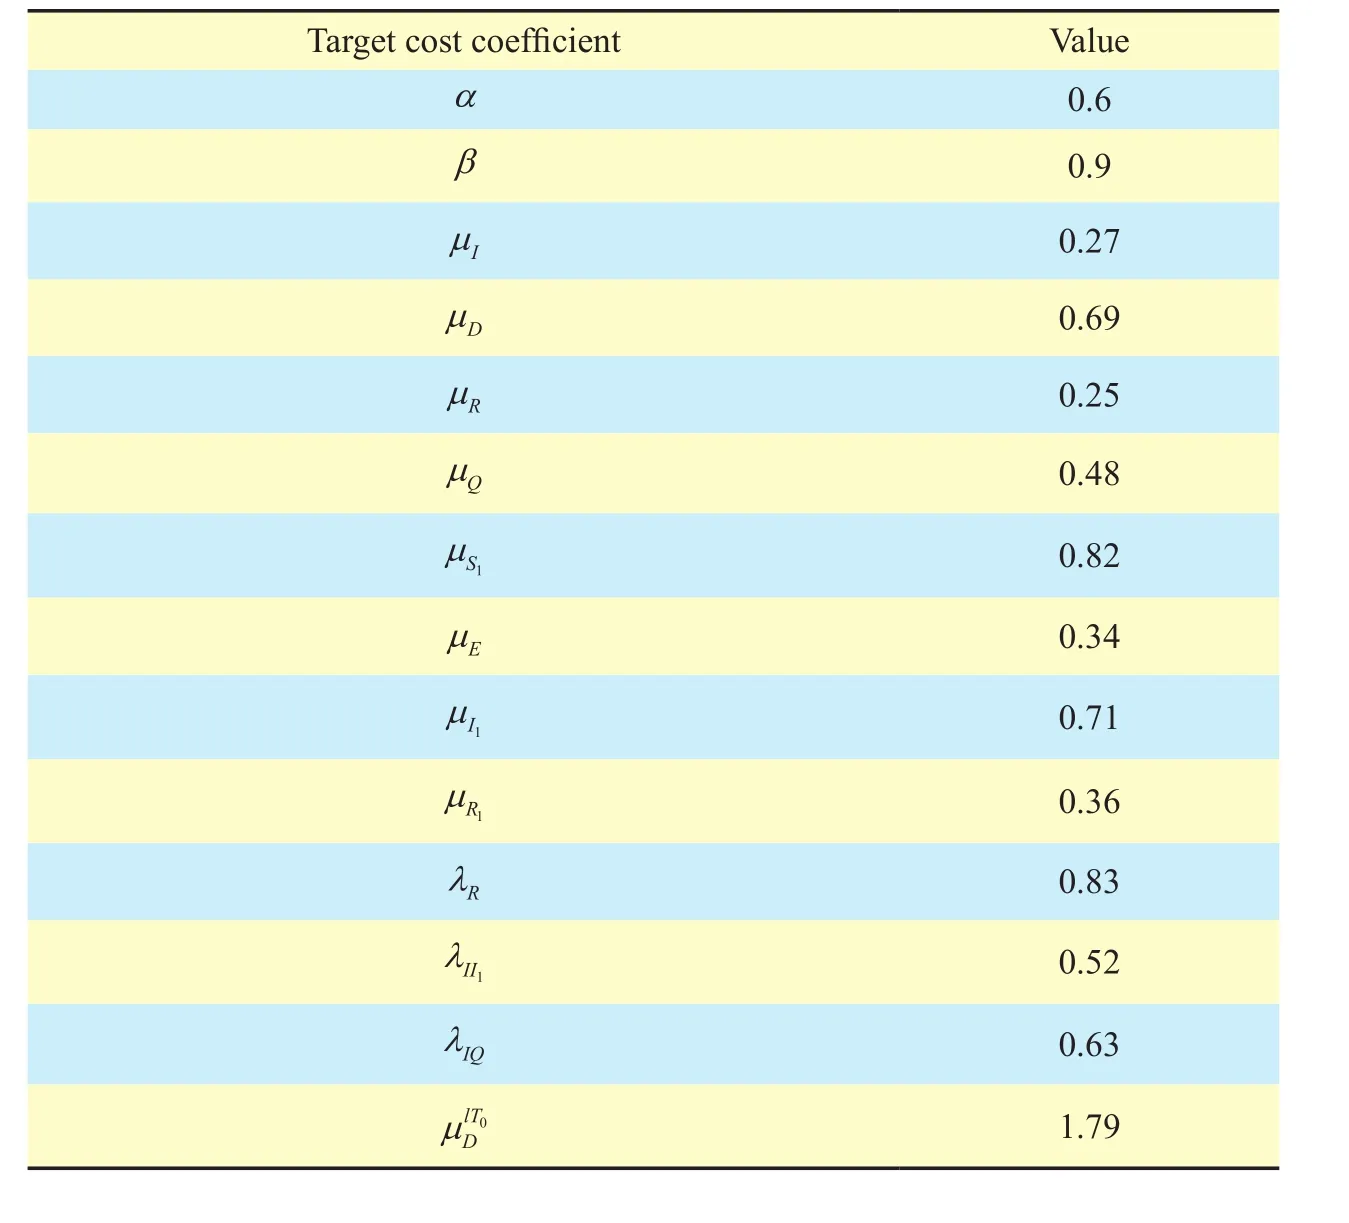
Table II. Target cost coefficient configuration
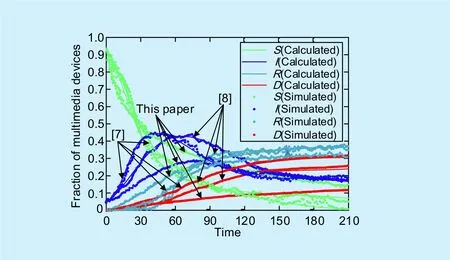
Fig. 6. Fraction of multimedia devices in each state.
The curve in this paper indicates a suitable match between simulated results and theoretical values. The exposed nodes, sleeping nodes and quarantine nodes are introduced to state-transition diagram and the modified epidemic model is constructed in Figure 4..It indicates that fraction of susceptible nodes in this paper is obviously improved and fraction of dead nodes is decreased to less than 10% over time. Moreover, fraction of infected nodes in the 96thgame stage reaches a maximum of 22.17%, which is much lower than other algorithms. From the 96thgame stage,the coordinator embeded in base station disseminates a mass of security patches to the network, while plenty of nodes are converted into sleeping state to prevent the malware propagation. Hence, fraction of recovered nodes does not grow rapidly.

Fig. 7. Overall damage of J in different game stages.
Here, the overall damage (target cost function) ofJin literature [7], literature [8], and this paper in each stage of the dynamic game is presented in Figure 7., respectively. The curve is the average of experimental results in 30 runs of the simulation in NS2.
Obviously, the overall damage for initial conditionI(0)=80 is always less than that for the conditionI(0)=160, which is determined by the propagation rules of state transition and target cost function. WhenI(0)=80 orI(0)=160, the overall damage in this algorithm is much smaller than that of other schemes over time. With the updating of the game stage, the performance superiority in the overall damage ofJis gradually increasing.Therefore, the cloud-assisted malware detection and suppression framework proposed can prevent malware propagation in WMS to the maximum extent while incurring a little overall damage compared with algorithms in literature [7] and [8].
VII. CONCLUSION
Defensive strategy optimization in the malware detection and suppression is equal to minimize the overall cost in the game between the attacker and defender. Note that the malware and WMS are rational. In this paper, a state-based dynamic differential game is formulated and the Nash equilibrium of the game is derived, showing how the WMS chooses its values of control parameters to make a balance between the overall cost and the detection and suppression performance. A cloud-based malware detection model has been presented for the selection to switch on or off the suppression algorithm. Depending on the characteristics of the nodes in WMS, a modified epidemic model with nine states and the kinetic equations are proposed for the differential game in WMS. Then the Hamiltonian function has been introduced to simplify the solution for saddle point. The cloud-assisted malware detection and suppression algorithm is further put forward. Simulation results have shown that the proposed algorithm can suppress the propagation of malicious codes evidently and efficiently and is suitable to the resource constrained WMS.
ACKNOWLEDGMENT
We are deeply grateful for the encouragement and guidance of our research group. This work is supported by the National Science Key Lab Fund under Grant No. KJ-15-104;the Project of Henan Provincial Key Scientific and Technological Research under Grant No.132102210003.
[1] Q. Yang, H. Wang, M. Dohler,et al, “Guest editorial multimedia communication in the Internet of Things, ”IEEE Internet of Things Journal, vol.4, no. 2, 2017, pp. 484-486.
[2] D. He, S. Chan, M. Guizani, “Mobile application security: malware threats and defenses, ”IEEE Wireless Communications, vol. 22, no. 1, 2015,pp. 138-144.
[3] A. Dadlani, M. S. Kumar, S. Murugan,et al, “System dynamics of a refined epidemic model for infection propagation over complex networks,”IEEE Systems Journal, vol. 10, no. 4, 2016, pp.1316-1325.
[4] Y. Li, P. Hui, D. Jin,et al, “Optimal distributed malware defense in mobile networks with heterogeneous devices, ”IEEE Transactions on mobile computing, vol. 13, no. 2, 2014, pp. 377-391.
[5] O. Trullols-Cruces, M. Fiore, J. M. Barcelo-Ordinas, “Worm epidemics in vehicular networks, ”IEEE Transactions on Mobile Computing, vol. 14,no. 10, 2015, pp. 2173-2187.
[6] Y. Guo, C. W. Ten, S. Hu,et al, “Preventive maintenance for advanced metering infrastructure against malware propagation, ”IEEE Transactions on Smart Grid, vol. 7, no. 3, 2016, pp.1314-1328.
[7] S. Shen, L. Huang, J. Liu,et al, “Reliability evaluation for clustered WSNs under malware propagation, ”Sensors, vol. 16, no. 6, 2016, pp. 1-16.
[8] A. Fathinavid and M. Ansari, “CLAIDS: cellular learning automata based approach for anomaly nodes detection in clustered mobile Ad hoc networks, ”Ad Hoc & Sensor Wireless Networks,vol. 29, no. 1, 2015, pp. 31-51.
[9] S. Peng, S. Yu, and A. Yang, “Smartphone malware and its propagation modeling: A survey, ”IEEE Communications Surveys & Tutorials, vol.16, no. 2, 2014, pp. 925-941.
[10] S. Wen, W. Zhou, J. Zhang,et al, “Modeling and analysis on the propagation dynamics of modern email malware, ”IEEE transactions on dependable and secure computing, vol. 11, no. 4,2014, pp. 361-374.
[11] V. Karyotis and S. Papavassiliou, “Macroscopic malware propagation dynamics for complex networks with churn, ”IEEE Communications Letters, vol. 19, no. 4, 2015, pp. 577-580.
[12] Y. Wang, S. Wen, Y. Xiang,et al, “Modeling the propagation of worms in networks: A survey,”IEEE Communications Surveys & Tutorials,vol.16, no.2, 2014, pp. 942-960.
[13] L. Sun, C. Fu, M. Fu,et al, “System recovery-aware virus propagation model and its steady-state analysis, ”China Communications,vol. 13, no. 5, 2016, pp. 151-161.
[14] R. Yu, J. Ding, X. Huang,et al, “Optimal resource sharing in 5g-enabled vehicular networks: A matrix game approach, ”IEEE Transactions on Vehicular Technology, vol. 65, no. 10, 2016, pp.7844-7856.
[15] L. Xiao, Y. Li, X. Huang,et al, “Cloud-based malware detection game for mobile devices with oラoading, ”IEEE Transactions on Mobile Computing, vol. 16, no. 10, 2017, pp. 2742-2750.
[16] S. Shen, H. Ma, E. Fan,et al, “A non-cooperative non-zero-sum game-based dependability assessment of heterogeneous WSNs with malware diffusion, ”Journal of Network and Computer Applications, vol. 91, 2017, pp. 26-35.
[17] S. Shen, H. Li, R. Han,et al, “Differential gamebased strategies for preventing malware propagation in wireless sensor networks, ”IEEE Transactions on Information Forensics and Security,vol. 9, no. 11, 2014, pp. 1962-1973.
[18] W. Liu, C. Liu, Z. Yang,et al, “Modeling the propagation of mobile malware on complex networks, ”Communications in Nonlinear Science and Numerical Simulation, vol. 37, 2016,pp. 249-264.
[19] S. Hosseini and M. A. Azgomi. “A model for malware propagation in scale-free networks based on rumor spreading process, ”Computer Networks, vol. 108, 2016, pp. 97-107.
[20] Z. Lu, W. Wang and C. Wang, “On the evolution and impact of mobile botnets in wireless networks, ”IEEE Transactions on Mobile Computing,vol. 15, no. 9, 2016, pp. 2304-2316.

- China Communications的其它文章
- CYBERSPACE SECURITY: FOR A BETTER LIFE AND WORK
- An Integration Testing Framework and Evaluation Metric for Vulnerability Mining Methods
- Powermitter: Data Exfiltration from Air-Gapped Computer through Switching Power Supply
- CAPT: Context-Aware Provenance Tracing for Attack Investigation
- Decentralized Attribute-Based Encryption and Data Sharing Scheme in Cloud Storage
- TPTVer: A Trusted Third Party Based Trusted Verifier for Multi-Layered Outsourced Big Data System in Cloud Environment