
CAPT: Context-Aware Provenance Tracing for Attack Investigation
2018-03-13 06:26:23ChengTanLeiZhaoWeijieLiuLaiXuLinaWang
China Communications 2018年2期
Cheng Tan, Lei Zhao*, Weijie Liu, Lai Xu, Lina Wang
School of Computer, Wuhan University, Wuhan 430072, China
Key Laboratory of Aerospace Information Security and Trusted Computing Ministry of Education,Wuhan University, Wuhan 430072, China
I. INTRODUCTION
With the increasing impact of Advanced Persistent Threat (APT) attacks, the modern world has moved from individual hackers for fun to nation states and cybercriminals for strategic advantage or profits. For example, the Black Vine attack group [1] targeted aerospace and healthcare since 2012, and resulted in the largest known healthcare data breach to date, with 80 million patient records exposed. Flame,a.k.a. sKyWIper [2], was a complex malware for targeted attacks, it targeted systems in the Middle East and North Africa to steal information and shot screen. OceanLotus [3] targeted Chinese Government and research institutions since 2012, and broke out in 2014 and stole massive secret data. WannaCry ransomware attack [4], began on 12 May 2017, and within a day was reported to have infected more than 230,000 computers in over 150 countries.
As a result, there is a great need of detecting and investigating APT attacks. Now provenance tracing has been considered as an important and promising approach to address this problem, as it discloses the root cause, the attacking path, and the results of APT attacks[5]. Generally, the provenance tracing method analyzes audit logs generated by the systems to capture multiple aspects of a suspicious entity: what the entity’s origin is, how the entity is derived, and when it originated [6]. In the context of attack investigations, entities contain processes, end points, files and so on.The what-provenance about an entity is the set of other entities that have causally influenced its value or state; the how-provenance and the when-provenance about it demonstrate how and when other entities influence its value or state. The purpose of provenance tracing is to find evidences about the attack, and we name all these evidences as attack footprints.
However, the features of APT attacks make themselves hardly detected by traditional audit log-based provenance tracing methods.Emerging APT attacks have exhibited the following features:
Firstly, APT attacks are prolonged and have multiple stages [7]. Attackers usually take much time to conduct reconnaissance to the target organization, to penetrate into it, to steal secret information from it. During these stages attacks usually span a lot of specific targets.With such a feature, attack footprints left by the multi-stage attack pattern are hard to be aggregated since they are spatio-temporally dispersed across many different logs in target machines. As mentioned before, OceanLotus[3] may reside in the victim’s environment for up to 2 years before it broke out. In the scenario of a phishing attack, the downloading action may leave evidence in the web browser’s log,but accessing confidential files may only be revealed in the system audit log. Most existing log-based intrusion analysis and detection systems [5], [8] focus on only single log types, so they are unable to understand the whole attack trace. While others [6] have non-trivial space and run-time overhead, so they cannot monitor such a long time.
Secondly, APT attacks usually utilize zero-day or one-day exploits aimed at being penetrating and stealthy. With such a feature,attackers have various methods to penetrate into the target machines. They may use social engineering attack (phishing email containing trojaned software) [9], [10], watering-hole attack [11], or man-in-the-middle attack (unofficial patch containing malicious payloads)[2]. By leveraging such methods attackers always get advanced permissions, which enable them to do anything they want, including even forcedly closing the log system in the target machines. Thus, the techniques of attack analysis which rely on systematic audit systems [5] are highly susceptible to APT attacks. After successfully exfiltrating confidential information or eavesdropping on secret communications, attackers usually clean up attack footprints. They can delete downloaded malwares or unofficial patches, and also try to modify log files so that victims could hardly trace attacks. In previous examples, WannaCry[4] and Flame [2] automatically delete downloaded malwares after the attack.
In this paper, we propose a context-aware provenance tracing system, called CAPT,which leverages the advantages of virtualization technologies to overcome the above challenges. By leveraging the context-aware method we correlate different types of events together to provide a panoramic view to the attack investigation, while virtualization technologies ensure that our method is robust to the attack in the target. Our observation is that different types of events can be correlated with their execution contexts. We define an event as a recorded interaction among entities such as processes, files, end points, etc. It contains information such as the timestamp, the type of operation, and information flow directions,which all can be used as the execution contexts to reconstruct the correlations between several events. Thus, CAPT utilizes the contexts among system events and network events to correlate them to achieve effective provenance tracing. CAPT cannot prevent security breaches from propagating or causing potentially irreversible damages (e.g., leaks of confidential information or denial of service), but is able to investigate the root cause, the attacking path,and the results of the attacks after the fact so that the victim can fix the vulnerabilities and increase the possibility to detect similar attack.It can be used to investigate any attack which target virtual machines.
In summary, our work makes the following contributions:
• We propose a context-aware provenance tracing system called CAPT. Based on the observation that different types of events can be correlated with their execution contexts, our system bridges the gap between those events. CAPT is able to provide a panoramic view to the attack investigation,and our evaluation results show that it is effective to investigate the emulated attack scenarios.
• By leveraging the virtualization technologies, we develop an efficient transparent event gathering module which is transparent to the attackers in the target machine. It collects fields from the target memory and utilizes these fields to constitute system operation status and network operation status based on run-time operation resolves. This module is out of the target machine, it can avoid being deceived or forcibly closed by the attacker, and introduce no space overhead to the target machine.
• We propose a log processing method to correlate system operation status and network operation status into log entries to temporally display the system and/or network operation information of the process.
The rest of this paper is organized as follows. We discuss our motivation in Section II.Section III outlines the system architecture.Then, we introduce the system design and implementations in Section IV. We evaluate the performance of our scheme in Section V and discuss the related work in Section VI. Section VII concludes our paper.
II. CYBER-ATTACK SCENARIO AND MOTIVATION
In this section, we firstly utilize a cyber-attack scenario to motivate our work. Then we introduce previous studies and analyze their limitations. Based on a key observation, we present the basic idea of our work.
Cyber-attack scenario.Consider a phishing attack, the victim used Firefox to check the mailbox and received an email with a link.The email said that the link was about a beta version program that victim expected to use.The victim was willing to click the link to download the program. However, this program had been added a malicious backdoor, and when the program was executed, the attacker utilized the backdoor to get unauthenticated user remote root access to the system. The attacker then ordered the target machine to collect sensitive information and sent them back.After finishing these operations, he modified.bash history file to remove the footprints of the attack.
This scenario is quite challenging to traditional log-based attack investigation, because the attacker has modified log files. Meanwhile,most existing log analysis systems could hardly reconstruct the attack story as they lack the panoramic view to understand the whole attack trace. In other words, these systems only focus on individual entities. For example, network intrusion analysis techniques [8],[12] leverage deep packet inspection or packet headers from a single network log, such as a DNS log or an HTTP proxy log, while hostbased systems [5], [13] perform analysis on a system’s audit log.
So far, HERCULE [14] is the only one that builds multi-dimensional weighted graphs by multiple logs and discovers “attack communities” embedded within the graphs. However,it relies on the default systematic audit system which makes it difficult to detect the attack in our scenario.
Our observation.Our key observation is that different types of events can be correlated with their execution contexts. Thus,an efficient way is needed to collect process operation information. One reliable way is traversing the memory. After a permanent change to the memory such as file close, file delete, or process terminate, process memory page will be changed. Before such changes, we can traverse memory pages to gather theelds about the execution contexts of process operation.
We try to perform data gathering on Linux Operation System. Process is described as a task by Linux Kernel using data structure“task_struct”. Data structure “task_struct”contains all the necessary information of the process Linux Kernel needs to manage,including process address space, openle information, IPC stuff, and so on. We can gather the interesting fields of the process through traversing data structure “task_struct”, and constitute system operation status and network operation status of the process based on runtime operation resolves.
If the data gathering module resides on the target, it has an excellent view of what is happening in that host’s software, but is highly susceptible to the attack. We follow [15] to utilize virtual machine introspection (VMI)technology to perform data gathering outside of the target. VMI leverages the isolation provided by virtual machine monitor (VMM) as well as the new abstract level between hardware and virtualized operating system and hence has a comprehensive understanding to the internal states of virtual machines. We perform data gathering by using VMI technology to monitor kernel data structures out of the target. Even if attackers implement process hiding technology or clean up footprints after the attack, their operations are transparent to our method, and all of their operations will be recorded. This virtualization technology ensures that our method is robust to the attack in the target.

Fig. 1. System architecture overview.
III. SYSTEM OVERVIEW
The architecture of CAPT is shown in Figure 1. The system contains the event gathering module, the log processing module, and the provenance tracing module. The event gathering module constitutes system operation status and network operation status with the fields collected from the target memory. The log processing module correlates system operation status and network operation status into log entries based on the event entities. The provenance tracing module reads the log file and correlates log entries based on their shared contexts to a panoramic view which provides an efcient support for both of the what, how,and when-provenance queries on suspicious entities such as processes, sockets andles.
To implement the transparent event gathering module, we utilize VMI technology to traverse target memory out of it. Kernel function“unlink” is a signal about memory changing,as it is called by the process to remove link to thele inode. Since such calling is the key step ofle close orle delete operations, we instrument the function to generate an interrupt to the VMM when being called. This interrupt is used to trigger the event gathering module to gather the interesting fields from target memory (More details can be found in Section 4.1). The interestingelds we traverse is aboutle operations and socket communications of the process. After gathering those fields, the event gathering module will constitute system event status and network event status based on run-time operation resolves (More details can be found in Section 4.2), and send them to the log processing module with a triggering timeTg. In our scenario, the attacker have modified log files, which make traditional log analysis systems useless, but his/her action could not affect our event gathering module. This module is able to transparently collect what has happened in the target machine.
With event status and triggering time as input, the log processing module records life circle information and operation information of each process to temporally display its system and/or network operation information.The generation and termination time of the process with parent process name belong to the former, while the start and end time of process operation with target name belong to the latter. These log entries are able to temporally display the system and/or network operations of the process. In our scenario, there must be log entries which record the generation time of process Firefox, and record the start and end time of checking emails, visiting link, and downloading backdoored program. There are also log entries which record the generation time of backdoored program process, and record the start and end time of remote connecting with an IP address. More details can be found in Section 4.3.
When needed, the provenance tracing module will read the log and model the relationship between multiple log entries to spatially display the relationship between entities. This module bridges the gap between those events and provide a panoramic view to the attack investigation. We make some association rules to describe the space correlation between two log entries, which are composed of the execution contexts such as timestamp and information flow directions. More details can be found in Section 4.4. We can easily locate the attacker’s footprints in the panoramic view.In our scenario, the victim operates the provenance tracing module to check if the backdoor has been exploited, and if so, what damages have been inflicted. First of all, with the email address, the name of downloaded file and the backdoored program process as the key words,the provenance tracing module searches for the log entries containing such words. According to the contexts of the chosen log entries,the module conducts the context search to find out all the log entries which share the same contexts with them. With the shared contexts, several log entries can put together to generate a panoramic view which provides an efficient support for both of the what, how,and when-provenance queries on suspicious entities. From the results the victim finds that the backdoored program process has created a remote connecting with an IP address, while another process has communicated with the same IP address, and accessed some files. The victim confirms that the backdoor has been exploited, and the accessed sensitive files have been leaked.
IV. SYSTEM DESIGN AND IMPLEMENTATIONS
In this section, we start with the implementation of field collection from the target memory,then present run-time operation resolves which utilize collected fields to constitute system event status and network event status. Finally,we introduce how to correlate events into log entries, and how to model the relationship between log entries. Our project is based on Xen platform.
4.1 Field collection
To effectively perceive changes in the target virtual machine’s (TVM) memory, we instrument kernel function “unlink” to generate an interrupt to the VMM when being called, and this interrupt is used to trigger the event gathering module to gather the interesting fields from target memory. To achieve this goal, we utilize VMI technology and Xentrace technology.
LibVMI is an introspection library focused on accessing memory from virtual machines(VMs). It is designed to work across multiple operation systems and provide intuitive APIs which help developers easily implement their functions. What we need to do in the TVM is running a script once to collect the offsets of its data structure. We implement a field collec-tion program based on LibVMI library.
Table I. Description of the elds.
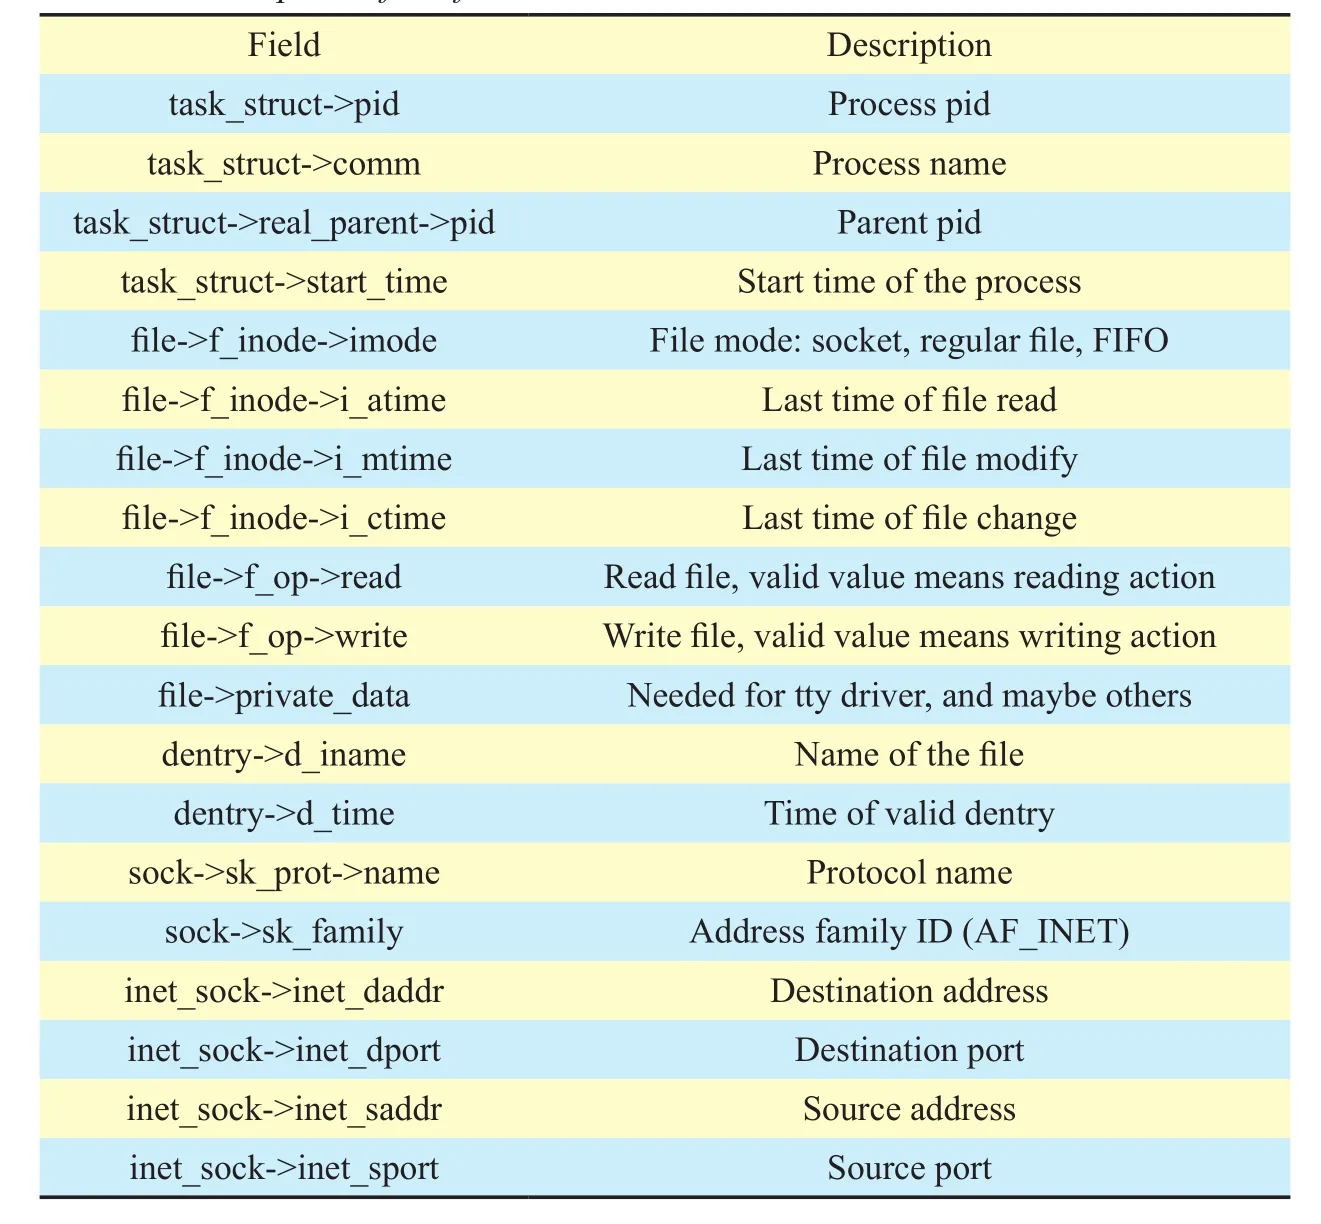
Table I. Description of the elds.

Fig. 2. Interesting elds in the memory.
Xen uses a number of trace points at key locations to record what is going on inside of Xen. When these trace points are enabled, Xen will write the tracing information into percpu buffers. Specically, there is a program in dom0 called Xentrace which is used to periodically read these buffers and write them to disk. We modify the source code of Xentrace to monitor specic events. When a process in the TVM calls kernel function “unlink” to remove the link to thele inode, an interrupt to the VMM will be generated and used to trigger a transfer of control to Xen, the corresponding trace point will monitor such event and write a record to the buffer. As soon as such a record is achieved, Xentrace will start our program to collect interestingelds from the memory of the TVM.
The interesting fields we want to collect is shown in Figure 2, and Table I shows their descriptions. After gathering these fields, the event gathering module is able to constitute system event status and network event status of the process based on run-time operation resolves, and send them to the log processing module with a triggering timeTg.
4.2 Run-time operation resolves
Table II describes seven run-time operation resolves which are used to constitute system event status and network event status with the fields in the event gathering module. The purpose of provenance tracing is to recognize the root cause, the attacking path, and the result of the attack. Based on the technical reports of[1][4], such kind of APT attacks span a lot of target machines through network communication, and utilize the process to operate files to implement their goals. Referring to the recent researches [6], [14], we record the interaction among processes, files, and end points, as all of them are the possible operation objects of the attackers.
The interaction among processes and files include file open, file read, file write, and file close. The first three related event status constitution are described by Run-time Operation Resolves 1 - 3. File close event is displayed by changes in the memory that the link from“task_struct” to “inode” is deleted, thus there is no need to create an operation resolve about file close. There are four common fields: S_ISREG (file->f_inode ->imode) means that the object is a regular file, fields task_struct->pid and task_struct->comm are used to describe process id and process name, while field dentry->d_iname is the name of the regular file.
If processpopens regular filefbefore field gathering, the dentry of filefwill be updated,thus dentry->d_time can be used to describe the file open time.
If processpreads regular filefbefore field gathering, file->f_inode->i_atime can be used to describe the last time of file reading, and the value of file->f_op->read shall be a valid value.
If processpwrites regular filefbefore field gathering, file->f_inode->i_mtime can be used to describe the last time of file modifying, and the value of file->f_op->write shall be a valid value.
The interaction among processes include inter process communication and process fork.Run-time Operation Resolves 4 and 5 are to describe inter process communication related event status constitution. There are four common fields: S_ISFIFO (file->f_inode-> imode)means that the object is a named pipe, fields task_struct->pid and task_struct->comm are used to describe process id and process name,and field dentry->d_ iname is the name of the named pipe.
If processpreads named pipecbefore field gathering, file->f_inode->i_atime can be used to describe the last time of reading, and the value of file->f_op->read is a valid value.
If processpwrites named pipecbefore field gathering, file->f_inode->i_mtime can be used to describe the last time of modifying,and the value of file->f_op->write is a valid value.

Table II. Run-time operation resolves.
Socket communication is the most dominating interaction among processes and end points. Run-time Operation Resolve 6 is for socket communication status constitution.Socket communication close event is also displayed by changes in the memory that the link from “task_struct” to “socket” is deleted, thus the operation resolve is unneeded.
Processpaccesses an end pointxbefore field gathering. S_ISSOCK (file->f_inode->imode) means that the objectxis a socket,fields task_struct->pid and task_struct->comm are used to describe process id and process name, sock->sk_prot->name is the protocol name of the socket, while both inet_sock->inet_daddr and inet_sock->inet_dport represent the communication destination. Since we do not find any field to describe the beginning time of the socket, we have to use the triggering timeTgto denote the approximate time.
Run-time Operation Resolve 7 is used to describe the process fork status. There is no resolve to describe process terminate event as it is displayed by changes in the memory that“task_struct” is deleted.
Processp1is created by processp2. Field task_struct->pid is the process id ofp1, and task_struct-> start_time records the start time of child processp1, while field task_struct->real_parent ->pid is process id of parent processp2.
4.3 Log processing
With event status as the input across multi time windows, the log processing module correlates them to temporally display the system and/or network operation information of the process into log entries.
There are two types of information in the log entries: the life information of the process and its operation information. The life information contains the generation and termination time of the process with the parent process name, while the operation information contains the start and the end time of process operation with the target name. Searching for those log entries, we support for both of what,how, and when-provenance queries on processes.
The log processing module will compare current event status with the previous event status. If one current event status is the same as the previous event status, it means that there is no operation status change of the process in the TVM, thus no update will be done to the log entry by the module. If there exist a difference, the module makes a further check about whether it is a process fork status change or a process operation status change.
If it is a process fork status such as Fork(p1,p2), the module will record a new log entry forp1, with the process start time, the generation flag, and the parent process id in it. Another case is that the module fails to find an input process fork status which matches the previous event status, it means that the process was terminated before the gathering time, then the module will generate a log entry with the triggering timeTgand the termination flag.
If it is a process operation status which does not match the previous event status, it means that the process creates an operation to an object before the gathering time, and the module will generate a log entry of this process with the timestamp, the operation flag,and the objects. On the contrary, if the previous event status does not match the current process operation status, it means that the process has closed the operation, thus the module will generate a log entry of this process with the timestamp, the closed flag, and the objects.After comparison, the log processing module will cover previous event status with the current event status.
4.4 Provenance tracing
The log processing module correlates system operation status and network operation status into log entries to support for both of what, how, and when-provenance queries on processes. The provenance tracing module models the relationship between multiple log entries to support for both of what, how, and when-provenance queries on suspicious processes, files, and sockets.
We make five association rules to describe the space correlation between log entries,which are composed of the execution contexts such as the timestamp and the operation target.
Association Rule 1: Two processes made connections with the same destination address in different times, then these is a correlation between them even if they requested to different ports.
Association Rule 2: Two processes made IPC communications with the same process in different times, if this process did not create an operation to other object in the time period,then there is a correlation between three processes.
Association Rule 3: Two processes operated the same file in different times, then there is a correlation between three processes.
Association Rule 4: Though two processes did not share any operation object, if they share the same parent process or one is the parent process of another, then there is a correlation between them.
Association Rule 5: If two log entries share completely the same correlation, they can be reduced together.
With the above defined rules, we are able to capture both intra-log correlations and inter-log correlations, which can help provide a panoramic view to the attack investigation.
V. EVALUATION
In this section, we evaluate the practicality of CAPT in terms of its effectiveness for attack investigation, as well as its performance overhead. In particular, we evaluate CAPT by differentially testing three attack cases: a phishing attack, a student hacking, and an internal information theft. Our evaluation aims at answering the following research questions:1) is CAPT effective at locating attack footprints? 2) How much is its performance overhead? 3) What are the benefits and limitations of CAPT?
5.1 Experiments setup
CAPT consists of the event gathering module,the log processing module, and the provenance tracing module. The event gathering module is implemented in C with LibVMI Library, while the log processing module and the provenance tracing module are both implemented in Python.
We implemented a prototype system on Xen 4.6.0. Both of the Dom0 and the TVM are running with Ubuntu 14.04.1 LTS 64-bit operating system. The event gathering module exists in the VMM level while the others exist in the user space of Dom0.
The attacker runs on a machine with the Kali Linux 64-bit operating system. He/she also has a FTP server to download attack tools and store leaked information.
5.2 Cases studies
In this section, we use a number of attack cases to demonstrate the effectiveness of our approach. We reproduce three attack scenarios for our experiment and perform what-provenance query and how-provenance query to understand the root cause, the attacking path,and the result of the attack.
The first case is the phishing attack discussed in Section 2. The victim operates the TVM, and he receives an email with an attachment which has a backdoored ProFTPD. After installing the program, the victim provides FTP service to others. After getting a warning that the program has a backdoor, he decides to utilize the provenance tracing module to check whether the backdoor has been exploited and what damages have been inflicted. In this case, the victim has “proftpd” as the key word which can help analysis.
The second scenario is a student hacking.The professor operates the TVM, and the student spends his time using a keystroke logger to steal professor’s password so that he/she is able to hack into the computer system and change his/her grades from Fs to As. He/she makes remote connection to the professor’s computer system and replaces the grade file with a modified version, and he/she cleans up his/her footprints before disconnect. But he/she arouses suspicion by changing the professor’s password, finding the connection between process “passwd” and a remote IP address will help identify the student.
The third scenario is an internal information theft. An employee operates the TVM, he/she copies information from “secret.txt” file and pastes it to “example.html”le, and then he/she modies the public “index.html”le to generate a link to “example.html”le. His/her partner visits the public page to download the“example.html”le, and the employee deletes all the footprints about his/her modication in later time. When the company finds that the information is leaked, an administrator is required to investigate the leaking procedure and the criminal. He/she needs to pair the information leakage procedure with thele which contains the leakage information.

Table III. Attack scenarios.

Fig. 3. The analysis of whether the backdoor has been exploited.
Parts of the results are shown in Table III.The second column shows the experiment durations. The third column shows the size of the logs. The last two columns show the result of what-provenance query and how- provenance query to each case.
Figure 3 - Figure 6 show the graphs generated by the provenance tracing module. In those figures, ovals, diamonds, and boxes respectively represent processes, sockets, and files. The filled node with border is the key word of thegure, while the node with dashed border represents the suspicious object.
The dashed line is used to denote the process fork event and the arrow to indicate the father-child relationship, while the solid line is used to denote the process operation event and the arrow to indicate the operation direction.The accurate time is too long to be record in thegure, thus we use “[ ]” notation to display relative time interval. The number is used to represent relative time and “-” means that the operation is still on.

Fig. 4. The analysis of what damages have been inflicted.
Figure 3 and Figure 4 are used to analyze the phishing attack case, as the correlation graph is too big to show clearly in one figure.The victim utilizes the provenance tracing module to model the relationship between log entries, then he/she locates the parts that contain the key word “proftpd”, as shown in Figure 3. Process “[11502] proftpd” is the located keyword created by “[1169] init”. Its child process “[11717] proftpd” made a strange remote connection to “192.168.20.7: 39892”in time interval [5, 15], and it created process“[11718] ssh” to connect to “192.168.20.7:39892” too, which proves that the backdoor has been exploited. File “group”, “passwd”,“proftpd.scoreboard”, and “proftpd.delay” are the configure files of proftpd, but they were visited by “[11718] ssh” and “[11719] ssh”,thus the IP address and theseles can be utilized to make a further investigation.
As shown in Figure 4, process “[11723]telnet” and “[11725] telnet” made remote connections to “192.168.20.7: 23569” and visited proftpd configure files in time interval [15,98], which means that this time interval is the duration of remote operation after penetration.The victim locates another process “[11724]ssh” which shares the same time interval. Its child process “[11727] ssh” created “[11730]ftp” in time interval [30, 90], and this process visited file “example.zip” and socket“192.168.19.33: 5120” in the same time interval, which means that this file was uploaded to the remote FTP server. This is the answer of what damages have been infl icted.
To find the connection between process“passwd” and a remote IP address, the investigator firstly uses the provenance tracing module to model the relationship between log entries, then he/she locates the parts that contain the key word “passwd”, as shown in Figure 5. Process “[2668] passwd” is the located keyword, it was created by “[2653] bash” to change the password in time interval [6, 11].“[2652] sshd” established a remote connection to socket “10.4.86.3: 62169” and created“[2653] bash” in the same time interval, which means that this socket made a successful remote access and got a bash to operate the system. The remote IP address “10.4.86.3” is the answer of what-provenance query. How the student stole the password could not be answered by the provenance tracing module, but the module is able to answer how the student modied the gradele. As shown in Figure 5,no process was created to open the gradele,but “[2653] bash” has created “[2708] scp”in time interval [28, 30], which means that the student sent the grade file back to modify the grade. Such conjecture can be proved by the right side of Figure 5. “[2710] sshd”and “[2711] sshd” were created successively to connect socket “10.4.86.3: 62415” while“[2653] bash” was not finished. This part of the correlation graph means that the student utilized “scp” command to remotely replace the gradele with a modied version.

Fig. 5. Part of the graph generated for the Student hacking case.
To pair the information leakage procedure with thele which contains the leakage information, the administrator firstly uses the provenance tracing module to model the relationship between log entries, then he/she locates the parts that contain the key word“secret.txt”, as shown in Figure 6. File “secret.txt” was visited by “[4715] gvim” in the time interval [3, 8]. Since there was no other connection to “[4715] gvim” except its parent, the administrator traverses its siblings and finds some interesting connections. After visiting“secret.txt”, the attacker immediately visited“example.html” in time interval [11, 20] and[101, 112], and “index.html” in the time interval [23, 60] and [82, 98]. As the public page of the company, “index.html” should not be modied without permission, visiting it twice was abnormal. The administrator estimates that the attacker utilized “index.html” to leak the information, visiting “example.html” twice proves that “example.html” is the springboard between “secret.txt” and “index.html”. From his/her investigation result, the answer of what-provenance query is an employee who has the right to access “secret.txt” and “index.html”, and operated the machine in the time interval. The answer of how-provenance query is that the criminal utilized “example.html”and “index.html” to make the secret visible to his/her partner.
In summary, CAPT is effective at locating attack footprints, even if the attackers deleted their footprints in the TVM. The key benefit of CAPT is that it is transparent to the attacker in the TVM, thus it is able to avoid being deceived or forcibly closed by the attacker. Therst case study also shows a limitation that the granularity of process-level events gathered by CAPT is coarse. With the extension of attacking time, the correlation graph will be bigger and bigger which makes the provenance tracing analysis hard to conduct.
5.3 Performance
In this section, we evaluate the space overhead and the run-time overhead of our approach.Though CAPT introduces no space overhead to the target machine, if the space overhead is too big for the monitor VM to hold, it will infl uence the practicality of CAPT, and so is the run-time overhead.

Fig. 6. Part of the graph generated for the Information theft case.
Daily Usage:We emulate the daily usage of two computer users and collect logs. User 1 uses the system to run an Apache server and an FTP server to provide services to others;User 2 is programming code to implement some functions, he/she uses program Firefox to surf the Internet, program Gedit to write code, and program Terminal to compile and run his /her code.
We record the number of log entries and the logle sizes for the users. The results are presented in Table IV. Column 2 shows the applications which users operate a lot. Column 3 records how long the test is. Columns 4 and 5 show the number of log entries and the logle sizes. The benet of CAPT is that it stores these log entries in a specic machine, which introduces no space overhead to the TVM.Besides, this space overhead is acceptable to monitor VM, as user1’s usage generates 0.08 MB while user2’s usage only generates 0.21 MB in 8 hours. With 1 TB disk in monitor VM, CAPT can keep monitoring a target 4560 years.
Run-time Overhead: The major limitation of applying traditional VMI for provenance tracing is that VMI programs will pause the system which cost great run-time overhead.Luckily one of my teammates developed a new technology to switch Extended Page Table so that VMI programs can achieve live memory reads. It can avoid the system pause caused by VMI programs to improve the efficiency of VM execution. We implement CAPT with both traditional guesting-halting VMI and the new technology, and test their run-time overhead, respectively.
We choose blackscholes, canneal, dedup,and streamcluster of PARSEC Benchmark Suite as the benchmark test programs, with AES-CBC-128 and RSA-1024. After 20 repeated tests, we get normalized execution time in different situations, as shown in Figure 7.
The “Native” column represents the baseline which is the result of the native benchmark without CAPT. The “Guesting-halting method” column represents the result of CAPT with traditional guesting-halting VMI, it costs greater run-time overhead than others. “Improved method” column represents the result of CAPT with the new technology, it keeps the run-time overhead average less than 4%,which means that the improved CAPT is more practical than the traditional one.
From the results we can see that the overhead of CAPT is acceptable, but we still need to investigate more advanced techniques to further decrease the run-time overhead.

Table IV. Daily usage record.

Fig. 7. Run-time overhead with different test set.
VI. RELATED WORK
Log analysis techniques have been studied for many years to discover the footprints left by the attackers. A large number of attack detection approaches are based on analyzing network logs to detect anomalous network behaviors. DNS log data is widely used for detecting malicious domain names [16], [17].Oprea et al. [8] applied a belief propagation algorithm to DNS log data or web proxy data to identify suspicious domains. Bailey et al. [18]used raw event logs to extract higher-level malware behavior via state changes rather than system calls, and used hierarchical clustering to group malwares that have similar classes of behaviors. Gu et al. [19] leveraged network traffic to identify the coordination dialog that occurs during a malware infection. CAPT also collects network events to trace attacks, but unlike these solutions, CAPT focuses on correlating the multiple stages of an attack across network events and system events.
Many attack analysis techniques handle system activity logs. For instance, system audit logs have been used by several research efforts [20], [21]. They adopted backward and forward tracking to determine the entry point and the damages of an attack to the victim.They still focus on individual logs and thus could not detect attack stages which occur in other logs, and systematic audit systems are highly susceptible to the attack, and they may be deceived or be force closed by the attackers. On the contrary, CAPT collects system events and network events out of the target machine, which avoids being interfered by the attackers.
To obtain system-call granularity logging of an attack’s execution, LEAPS [22]performed heavyweight event logging via Event Tracing for Windows (ETW). Ma [13]also constructed a model to parse ETW log to perform accurate attack investigation and highly effective log reduction. Behavior-based detections, using higher-level abstractions of malicious logic, also rely on logging system calls or fine-grained program/kernel execution to capture intrinsic malicious behaviors [23].Dolan-Gavitt et al. [24] leveraged the hypervisor to log all virtual address accessing for the signature generation that can be applied to analyze/detect malware. BEEP [5] performed static and dynamic analysis on applications to identify unit-level execution instrumentation points. Protracer [6] combined both logging and unit level tainting to achieve cost-effective provenance tracing. While such approaches allow for fine-grained causal analysis of attacks,their substantial run-time overhead might limit their applicability in real-world production environments. In comparison, CAPT correlates system events and network events into log entries and stores them in a specific machine,which introduces no space overhead to the target machine.
Some researchers analyzed the relationship in their data to implement their functions.With system stack traces as input, IntroPerf[25] enables transparent context-sensitive performance inference, and diagnoses application performance in a multi-layered scope ranging from user functions to the kernel. LogGC [26]is an audit logging system which identifies and overcomes the unique challenges of garbage collection in the context of computer forensic analysis. Xu et al. [27] exploited the dependency among system events to reduce the number of log entries while still supporting high-quality forensic analysis. Unlike them,CAPT models the relationship between multiple log entries and automatically generates a directed graph to provide a panoramic view of the log entries to achieve effective provenance tracing.
VII. CONCLUSION
We propose a context-aware provenance tracing system called CAPT that leverages the advantages of virtualization technologies to transparently collect system events and network events out of the target machine, and processes them in the specific machine which introduces no space overhead to the target machine. CAPT utilizes the contexts of collected events to bridge the gap between them,and provides a panoramic view to the attack investigation. Our evaluation results show that CAPT achieves effective provenance tracing to the attack cases, and it only produces 0.21 MB in 8 hours. With our newly-developed technology, we keep the run-time overhead averages less than 4%.
In our future works, we will do further researches to increase the granularity of events,as attackers may make noises to hide their real behaviors. Thus, we need enough granularity to filter real attack events from massive noises.
ACKNOWLEDGEMENTS
This work was partially supported by the NSFC-General Technology Basic Research Joint Fund (U1536204), the National Key Technologies R&D Program (2014BAH41B00), the National Nature Science Foundation of China(61672394; 61373168; 61373169), and the National High-tech R&D Program of China(863 Program) (2015AA016004).
[1] “Black vine: Formidable cyberespionage group targeted aerospace, healthcare since 2012”,2015. https:/www.symantec.com/connect/blogs/black-vine-formidable-cyberespionage-group-targeted-aerospace-healthcare-2012.
[2] B. Bencsáth, G. Pék, L. Buttyán, et al. “sKyWIper(aka Flame aka Flamer): A complex malware for targeted attacks”, CrySyS Lab Technical Report,No. CTR-2012-05-31, 2012.
[3] “SkyEye. APT OceanLotus(APT-C-00)”, 2015.http://bobao.360.cn/news/detail/1601.html (in Chinese).
[4] “WannaCry: The Old Worms and the New”,2017. https://securingtomorrow.mcafee.com/executive-perspectives/wannacry-old-wormsnew.
[5] K. H. Lee, X. Zhang, and D. Xu. “High accuracy attack provenance via binary-based execution partition”,Proceedings of the 20th Network and Distributed System Security Symposium, pp.1-16, 2013.
[6] S. Ma, X. Zhang, and D. Xu. “Protracer: Towards practical provenance tracing by alternating between logging and tainting”,Proceedings of the 23th Network and Distributed System Security Symposium, pp. 1-15, 2016.
[7] “Apt kill chain - part 5: Access strenghtening and lateral movements”, 2014. http://blog.airbuscybersecurity.com/post/2014/11/APT-Killchain-Part-5-%3A-Access-Strenghtening-andlateral-movements.
[8] A. Oprea, Z. Li, T.-F. Yen, et al. “Detection of early-stage enterprise infection by mining largescale log data”,Proceedings of the 45th IEEE/IFIP International Conference on Dependable Systems and Networks, pp. 45-56, 2015
[9] “Operation russiandoll: Adobe & windows zero-day exploits likely leveraged by russia’s apt28 in highly-targeted attack”, 2015. www.fireeye.com/blog/threat-research/2015/04/probable_apt28_useo.html.
[10] “Operation tropic trooper: Old vulnerabilities still pack a punch”, 2015. blog.trendmicro.com/trendlabs-security-intelligence/operation-tropic-trooper-old-vulnerabilities-still-pack-a-punch/.
[11] “Watering hole attack on aerospace firm exploits cve-2015-5122 to install isspace backdoor”, 2015. researchcenter.paloaltonetworks.com/2015/07/watering-hole-attack-on-aerospace-firm-exploits-cve-2015-5122-to-installisspace-backdoor/.
[12] V. Paxson. “Bro: a system for detecting network intruders in real-time”,Computer networks, vol.31, no. 23, pp. 2435-2463, December, 1999
[13] S. MA, K. H. LEE, C. H. KIM, et al. “Accurate, low cost and instrumentation-free security audit logging for windows”,Proceedings of the 31st Annual Computer Security Applications Conference, pp. 401-410, 2015
[14] K. Pei, Z. Gu, B. Saltaformaggio, et al. “HERCULE:attack story reconstruction via community discovery on correlated log graph”,Proceedings of the 32nd Annual Conference on Computer Security Applications, pp. 583-595, 2016
[15] T. K. Lengyel, S. Maresca, B. D. Payne, et al.“Scalability, fidelity and stealth in the DRAKVUF dynamic malware analysis system”,Proceedings of the 30th Annual Computer Security Applications Conference, pp. 386-395, 2014
[16] M. Antonakakis, R. Perdisci, W. Lee, et al. “Detecting malware domains at the upper dns hierarchy”,Proceedings of the 20th USENIX Security Symposium, pp. 1-16, 2011
[17] M. Antonakakis, R. Perdisci, Y. Nadji, et al. “From throw-away traffic to bots: Detecting the rise of dga-based malware”,Proceedings of the 21st USENIX Security Symposium, pp. 1-16, 2012
[18] M. Bailey, J. Oberheide, J. Andersen, et al. “Automated classification and analysis of internet malware”,Proceedings of the 10th International Symposium on Research in Attacks, Intrusions and Defenses, pp. 178-197, 2007
[19] G. Gu, P. A. Porras, V. Yegneswaran, et al. “Bothunter: Detecting malware infection through ids-driven dialog correlation”,Proceedings of the 16th USENIX Security Symposium, pp. 1-16, 2007
[20] T. Kim, X. Wang, N. Zeldovich, et al. “Intrusion recovery using selective re-execution”,Proceedings of the 9th USENIX Symposium on Operating Systems Design and Implementation, pp. 1-16, 2010
[21] J. Newsome and D. Song. “Dynamic taint analysis for automatic detection, analysis, and signature generation of exploits on commodity software”,Proceedings of the 12th Network and Distributed System Security Symposium, pp.1-18, 2005
[22] Z. Gu, K. Pei, Q. Wang, et al. “Leaps: Detecting camouflaged attacks with statistical learning guided by program analysis”,Proceedings of the 45th IEEE/IFIP International Conference on Dependable Systems and Networks, pp. 57-68,2015
[23] D. Canali, A. Lanzi, D. Balzarotti, et al. “A quantitative study of accuracy in system call-based malware detection”,Proceedings of the 2012 International Symposium on Software Testing and Analysis, pp. 122-132, 2012
[24] B. Dolan-Gavitt, A. Srivastava, P. Traynor, et al.“Robust signatures for kernel data structures”,Proceedings of the 16th ACM Conference on Computer and Communications Security, pp.566-577, 2009
[25] C. H. Kim, J. Rhee, H. Zhang, et al. “Introperf:transparent context-sensitive multi-layer performance inference using system stack traces”,Proceedings of the 2014 ACM International Conference on Measurement and Modeling of Computer Systems, pp. 235-247, 2014
[26] K. H. Lee, X. Zhang, and D. Xu. “Loggc: garbage collecting audit log”,Proceedings of ACM CCS’13, pp. 1005-1016, 2013.
[27] Z Xu, Z Wu, Z Li, et al. “High fidelity data reduction for big data security dependency analyses”,Proceedings of the 2016 ACM SIGSAC Conference on Computer and Communications Security, pp. 504-516, 2016

- China Communications的其它文章
- CYBERSPACE SECURITY: FOR A BETTER LIFE AND WORK
- A Cloud-Assisted Malware Detection and Suppression Framework for Wireless Multimedia System in IoT Based on Dynamic Differential Game
- An Integration Testing Framework and Evaluation Metric for Vulnerability Mining Methods
- Powermitter: Data Exfiltration from Air-Gapped Computer through Switching Power Supply
- Decentralized Attribute-Based Encryption and Data Sharing Scheme in Cloud Storage
- TPTVer: A Trusted Third Party Based Trusted Verifier for Multi-Layered Outsourced Big Data System in Cloud Environment