多晶粒银纳米线形变机理对温度依赖性的分子动力学研究
赵健伟 程 娜 汪秀秀 余 刚*, Colm Durkan 王 楠
(1嘉兴学院材料与纺织工程学院,嘉兴 314001)
(2湖南大学化学与化工学院,长沙 410082)
(3剑桥大学纳米科学中心,剑桥 CB3 0FF,英国)
多晶粒银纳米线形变机理对温度依赖性的分子动力学研究
赵健伟*,1程 娜1汪秀秀2余 刚*,2Colm Durkan3王 楠3
(1嘉兴学院材料与纺织工程学院,嘉兴 314001)
(2湖南大学化学与化工学院,长沙 410082)
(3剑桥大学纳米科学中心,剑桥 CB3 0FF,英国)
基于大规模分子动力学仿真,研究了包含多个晶粒的柱状银纳米线在不同温度下沿轴向拉伸形变的行为。结果表明,当温度低于200 K时,含较大晶粒的体系中位错滑移是其形变的主要机理,最大应力随温度变化不显著。当环境温度高于200 K时,晶粒的滑动逐渐成为形变的主导因素,这一特征在含更小晶粒的体系内表现更明显。同时最大应力随温度显著降低。基于上述结果,进一步讨论了温度对Hall-Petch关系的影响。
多晶;纳米线;温度;拉伸;Hall-Petch效应;分子动力学
The nature of the grain boundaries in polycrystalline metals plays a prominent role in determining many material properties such as interface mobility,corrosion and protection,crack nucleation and propagation,ductility,as well as the electrical and thermal transport properties[1-3]. During the pastdecade,tremendous efforts have been made towards improving our understanding of the atomic arrangement and mechanical behavior of polycrystalline metals by computer simulations[4-9]and careful experiments[10-17].So far,the deformation mechanisms[18]experienced under stress conditions have been explained in terms of grain boundary(GB) sliding[19-20],migration[21],rotation[22],and diffusion creep[23].
The GB strengthening,i.e.,the Hall-Petch strengthening is a method of strengthening materials by modulating their average crystalline size[24].It is based on the experimental observation that grain boundaries may impede the dislocation migration and that the number of dislocations within a grain have an effect on how easily dislocations can traverse grain boundaries.Therefore,by changing the grain size one can control the dislocation movement and modulate the yield strength[25].Experimental observations on many nanocrystalline materials have demonstrated when the grains are of a small enough size,typically of the order of 10 nm called as Hall-Petch limit,the yield strength either remains constant or decreases with furtherreduction ofthe grainssize.This phenomenon has been termed the reverse Hall-Petch relation.The Hall-Petch relation ata constant temperature has been studied intensively.Keller et al.[26]performed simulation of Ni polycrystals,and their resultsshowed a deviation from the Hall-Petch formulation for samples with less than a critical number of grains in thickness.Godon et al.[27]reported that the size-dependence of the flow stress can be described by the Hall-Petch relationship over a large range of grain sizes and the value of Hall-Petch slope is dependent on the texture of grain boundaries.Chokshi et al.[28]observed the enhancement of the diffusional creep along the grain boundaries that is similarto the GB sliding,and correlated this observation with the reverse Hall-Petch relation.
In the Hall-Petch and reverse Hall-Petch relations,both dislocation slip and GB sliding are sensitive to temperature,albeit at different rates.Therefore,by changing the temperature of the system,one can modulate the deformation mechanism of the nano-sized system and further explore the material strengthening under the elevated temperature.Such an approach can ultimately be used to design materials with desired properties not only at the atomic,but also at the nanometer scale-taking into account the microstructure.In thiswork,we have designed polycrystalline silver nanowires with different lengthdiameter ratios and performed molecular dynamics(MD)simulations under different temperatures.The temperature dependence of the Hall-Petch relation has been discussed qualitatively.
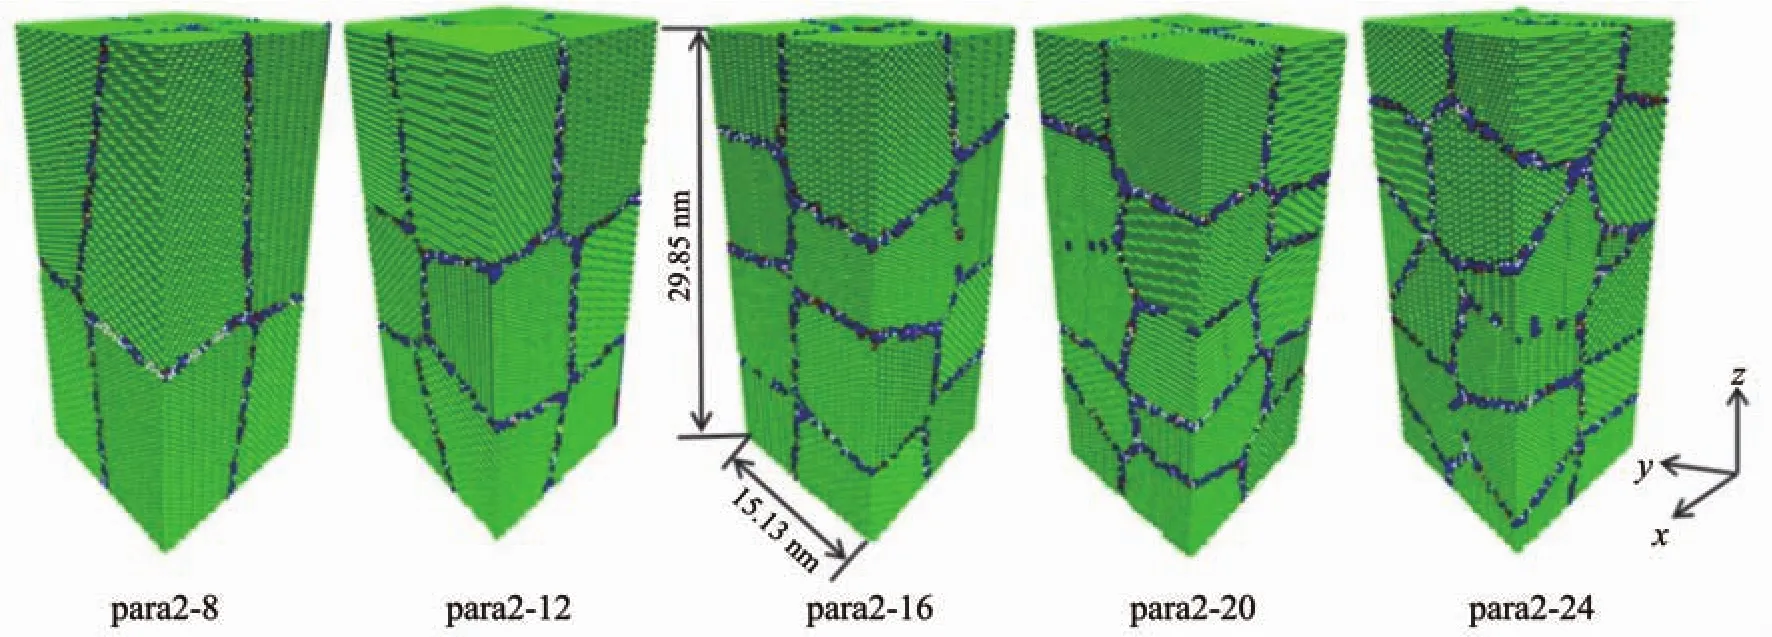
Fig.1 Initial configuration of Ag nanocrystalline with columnar grains;Colors in the figures indicate the type of atoms;Green and blue correspond to the bulk FCC atoms and grain boundary atoms,respectively
1 Simulation method
Cuboid samples with dimensions of 15.13 nm×15.13 nm×29.85 nm and ~0.38 million atoms were cons-tructed using a Voronoi diagram as a matrix,as shown in Fig.1. The models of columnar polycrystalline silver samples containing two grains across their width and a number of grains along their length with a random crystallographic orientation are denoted as Para2-N (N=12,16,20 and 24).The average crystallite(grain)sizes are 11.77,10.29,9.34,8.68 and 8.16 nm,respectively.MD simulations were conducted on the polycrystalline structureswith different length-diameter ratios using a self-developed software NanoMD[29-32].A constant strain rate of 8.1×10⁸s-1that falls into an equilibrium stretching state was used in all simula-tions.The embedded atom method(EAM)potential[33]parameterized by Johnson[34-35]was adopted to calculate the atomic interaction of FaceCentered Cubic (FCC)silveratoms.The particular parameters of the EAM potentialof the silver cell are a=b=c=408.53 pm and α=β=γ=90°.To properly simulate the working cond-itions of the mechanical devices,a free boundary condition was applied in all three spatial dimensions to model the isolated columnar nanowire.Comparing to the periodic boundary condition,the free boundary condition may exert force load much easily and flexibly.Prior to any imposed stress,each sample was equilibrated at a constant temperature.The fast decrease of the energy isa good indicatorforthe time required for establishing the equilibrium atomic configuration.It is found that the system energy becomes stable after~60 ps.In order to give an essential equilibrium state of the system,it is incubated for 256 ps to relax out the unfavorable configurations in the grain boundaries.After structural relaxation,the atoms in the crystal grains keep the original configuration,but the atoms at grain boundaries migrate to a more stable position,lowering the system energy.Seven temperatures of 10,50,100,150,200,250 and 300 K were held for those systems to extract temperature-dependent behaviors of the simulations.Table 1 shows the crystallographic characteristicsofallmodels.Itshowsthatthe proportion of grain boundary atoms increases as the number of grains increases,as expected.

Table1 Crystallographic characteristics of Ag nanowires with different length-diameter ratios at 10 K
The average stress within the nanowire is computed by a virial scheme[36].It is expressed in terms of EAM potential functions as given in equation(1):

In order to study the structures of plastically deformed polycrystralline nanowires in detail,different types of defects are identified by means of the centrosymmetry parameter[37].The centro-symmetry parameter can be defined as,

where piis the centro-symmetry parameter value of atom i,D0is the nearest-neighbor distance,and Rjand Rj+6are the vectors corresponding to the six pairs of opposite nearest neighbours in the crystalline lattice.The value of pireveals the property of the atoms in the metal,for reference,piless than 0.4 corresponds to the FCC atom.While piis between 0.7 and 1.2, it stands for the stacking faults,corresponding to the HCP atoms in particular.The atoms with pivalue greater than 1.2 are treated as other atoms for discussion in the text.
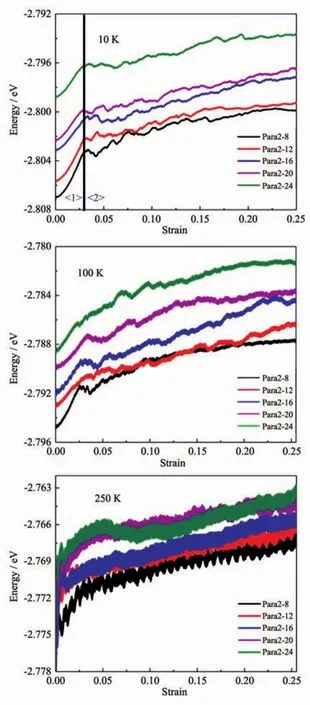
Fig.2 Potential energy curves for Ag nanowires at(a)10,(b)100,and(c)250 K
2 Results and discussion
2.1 Temperature dependence of the potential curve and stress-strain relation
The atoms at the grain boundaries have higher potential energy than those in the crystalline lattice,therefore the evolution of the average potential may give insight into the structural change of the system during stretching.The average potential energy-strain relationship for the polycrystalline silver samples with a set of grain sizes at different temperature are shown in Fig.2.In general,the potential energy curves of the samples with more grains are higher than those with less grains.However,the potential evolution still has significant difference at different temperature.At low temperature,10 K for example as shown in Fig.2(a),the potential curve has very weak fluctuation due to the low kinetic energy of the atoms.The curves can be clearly divided into two parts along the strain.In the initial stage (the area <1>),we observe that the potentialenergy increases in a parabolic form(E=kx2)[36],consistent with the elastic deformation.The elastic constant k has the values 5.56,5.16,4.48,4.43 and 4.43 meV·nm-2,respectively,with increasing the number of grains or decreasing the grain size.The decrease of the elastic constant k is attributed to the high ratio of the disordered atoms at the grain boundary.In the stage denoted as area <2>,the potential energy experiences a quick decline,then,a slow increase with slight fluctuation.This stage is,usually,considered to generate a number of dislocation slips in the crystalline grains.At raised temperature,i.e.,100 K as shown in Fig.2(b),most features of the potential curves remain.However,the elastic behavior becomes less obvious,and the potential fluctuations are clearer.When the temperature is raised over 200 K,the elastic behavior no longer exists.Fig.2(c)shows the potential curves at 250 K,a typical temperature in this region.In spite of the grain size,the parabolic increase of the potential energy no longer exists even in the initial stage,inferring a plastic deformation in whole stretching.In addition,the potential fluctuations become more profound and the potential curves are close to each other,indicating a different grain sizedependence of the deformation mechanism in this temperature region.
The stress-strain relationship may also give key information about the temperature-dependent mechanical properties of the system at the macroscopic level.Fig.3(a),(b)and(c)show the tensile stressstrain relationships of five typical samples at 10,100 and 250 K,respectively.The tensile stress increases linearly with strain up to a peak stress and,then,decreases continuously for all grain sizes considered in this study.The linear dependence of the stress on the strain indicates the elastic behavior.The yield stress and yield strain are useful parameters to help identify the deformation mechanisms.Although the yield behavior shows some dispersivity among the samples,we can still observe some general trends in the data.The yield stress decreases as the grain number increases.For example,it is decreased by about 18.2%and 16.7%,at 10 and 100 K,respectively,when comparing Para2-8 with Para2-24.However,the yield strain does not show significant changes over a large temperature range.This result indicates that the systems investigated in this work fall into the reverse Hall-Petch regime.In order to give definite results,we have performed 5 simulations under each condition and made a statistical analysis of the yield stress,the yield strain and the Young′s modulus as shown in Fig.3(d),3(e)and 3(f),respectively.
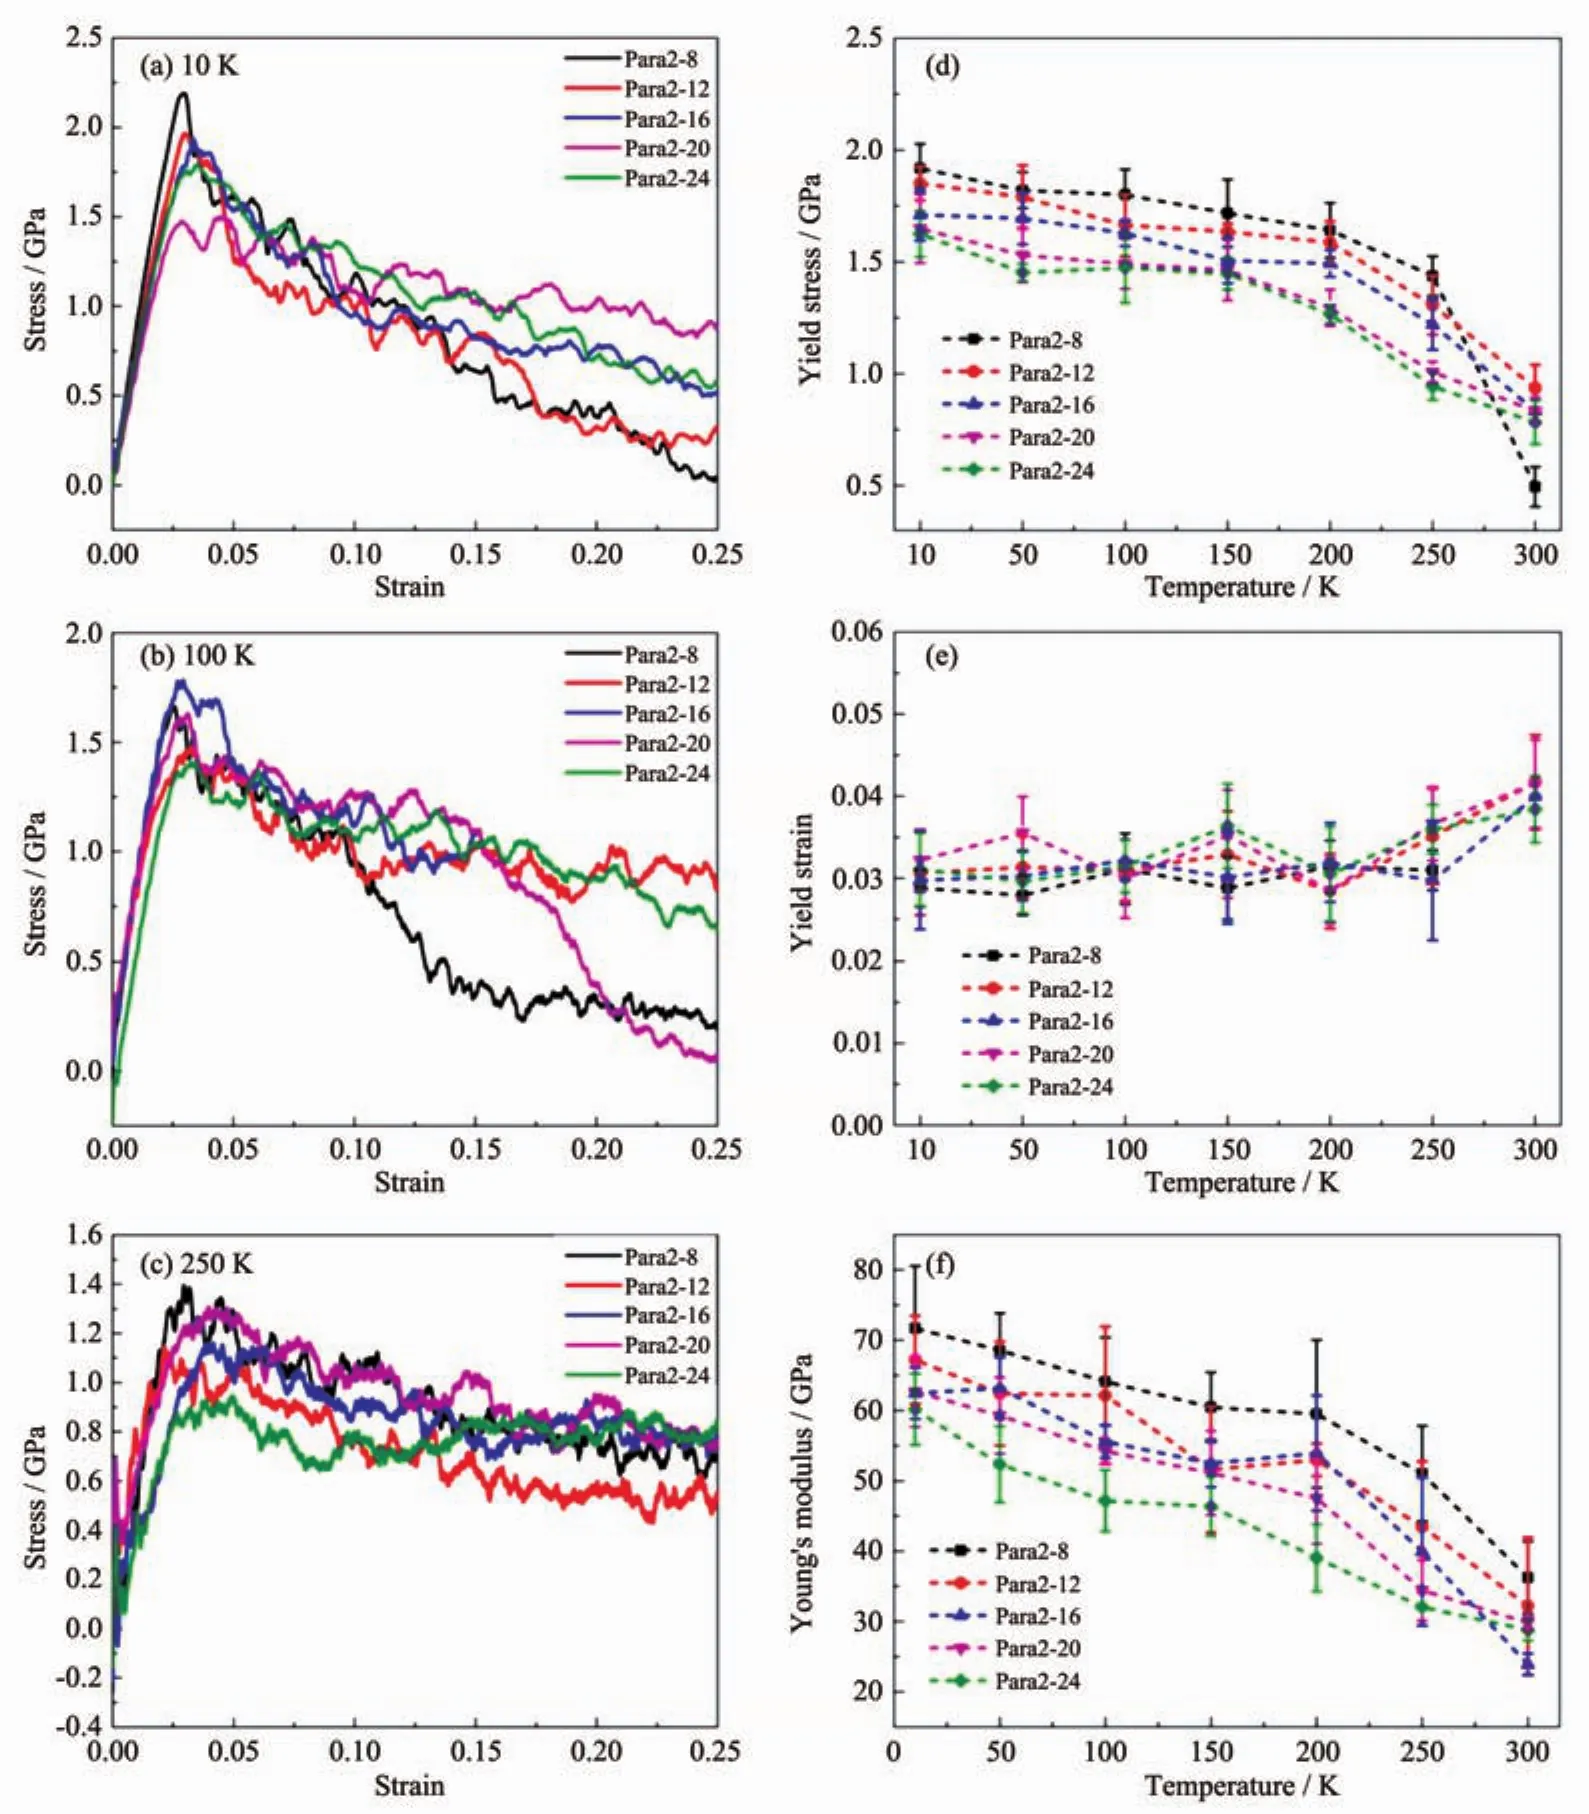
Fig.3 Stress-strain curves of Ag nanowires at(a)10 K;(b)100 K;(c)250 K;(d)yield stress-temperature curves;(e)yield strain-temperature curves;(f)Young′modulus-temperature curves
In Fig.3(d),we can clearly see that the evolution of the yield stress can be divided into two stages.Below 200 K,the yield stress declines slightly with increasing temperature.When the temperatureis higherthan 200 K,the yield stress decreases dramatically for all 5 samples.The existence of a critical temperature indicates a different deformation mechanism that dominates the grain size-dependence of the mechanical properties.However,the yield strain has only a weak temperature dependence as shown in Fig.3(e),although it does show a small increase above 200 K.The Young′s modulus,a measure of the stiffness of a solid material,is obtained from the ratio of stress to strain,therefore,it appears to have the similar behavior to the yield stress as yield strain keeps constant.From Fig.3(f)we can observe that when the temperature is reduced below 200 K,the Young′s modulus decreases with a rate of 75 MPa·K-1.When temperature is raised above the critical value,the Young′s modulus decreases much faster with a rate of 250 MPa·K-1.In the present study,the grain size is smaller than the Hall-Petch limit,i.e.,in the reverse Hall-Petch regime.Therefore,the grain boundary sliding is considered to be the dominant mechanism at low temperature.However,the raised temperature provides the atoms with more kinetic energy,allowing more dislocations to be generated together with the grain boundary sliding.
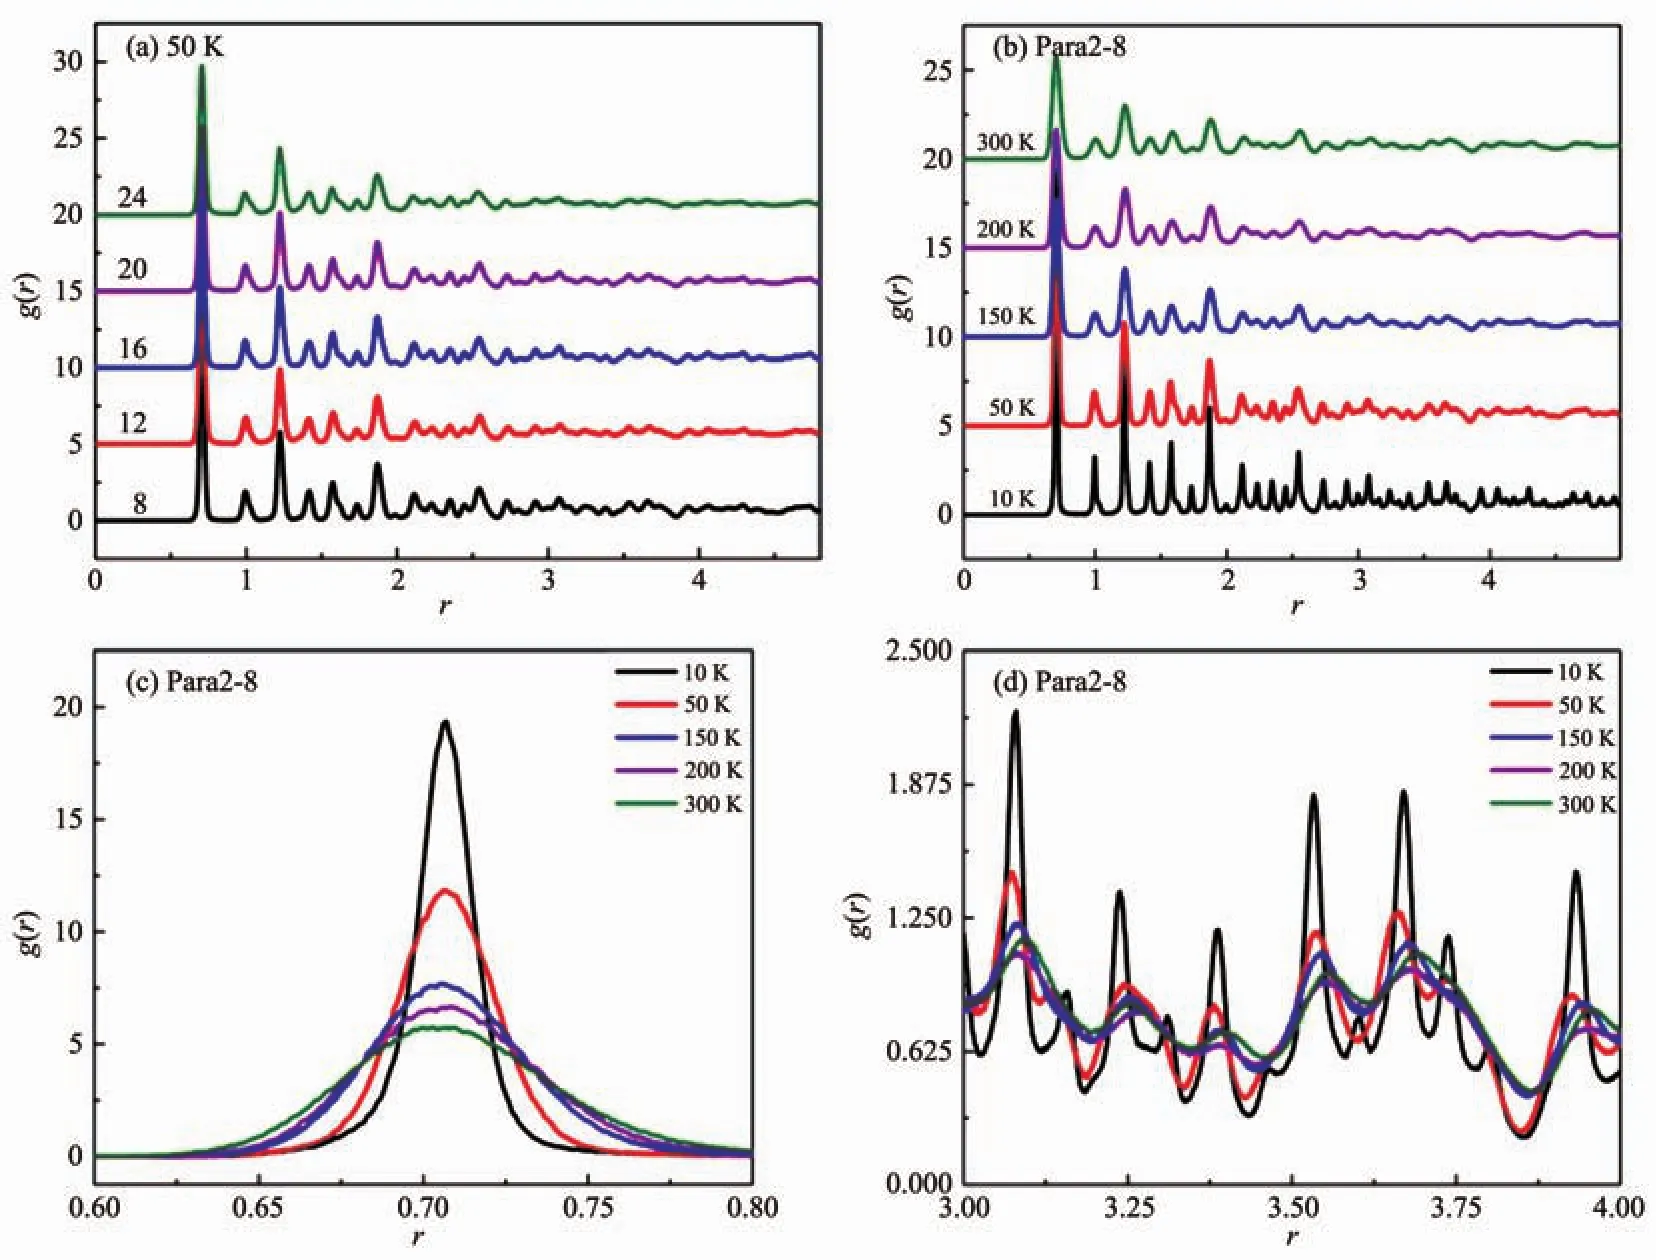
Fig.4 Radial distribution functions of Ag nanowires at the yield point:(a)With different length-diameter ratios at 50 K;(b)Para2-8 at different temperature;(c)Enlarge the first neighbor peak in Fig.(b);(d)Enlarge the areas between 3 and 4 in Fig.(b)
2.2 Radial distribution function and the quantitative change of specific atoms
The radial distribution function (RDF)and the quantitative change of the specific atoms are important parameters bridging the macroscopic properties and the microscopic structure.Fig.4 shows theRDF features of the polycrystalline silver nanowires at the yield point at which a number of initial dislocations are generated.Fig.4(a)compares the RDF as a function of grain size at a typical temperature of 50 K.With decreasing the grain number,the short-range order corresponding to interatomic distance r less than 1.5 lattice remains unchanged,but the long-range order corresponding to r larger than 2.5 lattice decreases perceptibly.In order to elucidate the temperature-dependence of the crystalline structure,Fig.4(b)compiles the RDF curves of sample Para2-8 at different temperatures.In general,the RDF curve becomes smoother at a raised temperature,indicating that the crystalline structure is disordered by the thermal motion of atoms.To study the effects of temperature on both the short-and long-range order,we concentrate on the regions with the interatomic distance between 0.6 and 0.8 and between 3.0 to 4.0,as shown in Fig.4(c)and 4(d),respectively.In Fig.4(c),the well-defined Gaussian peaks show the temperature-dependence,but the peak decreases unevenly with temperature.In particular,it drops by 35%as the temperature increases from 50 to 150 K,but only 14%from 200 to 300 K.Another interesting feature is displayed by the long-range order as shown in Fig.4(d).Below 200 K,the RDF peak simply shows a decrease with increasing temperature.However,above this temperature,the peak shifts toward large atomic distance together with a slight decrease of peak height,indicating an expansion of the material.From the variation of the crystalline structure,we can identify the critical temperature,below which the crystalline order is simply decreased,and above which more complex structure distortion takes place.
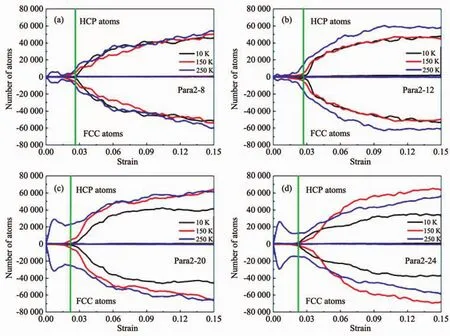
Fig.5 Reduced number of different atoms versus strain:(a)Para2-8;(b)Para2-12;(c)Para2-20;(d)Para2-24
Fig.5 illustrates the quantitative change of the specific atoms identified with centro-symmetry parameter during tensile loading.The centro-symmetry parameter analysis is a useful measure of the local lattice order around an atom.In Fig.5,the number is calculated by subtracting the initial number of the specific atoms before deformation.The change of the number of specific atoms starts after relaxation.In particular,the numberofFCC atomsdecreases accompanied with increase in HCP atoms.The other atoms do not show clear changes.Fig.5(a)and 5(b)show the similar variations for the samples Para2-8 and Para2-12 in which the grain aspect ratios are greater than 1 and can be viewed as the same group.In these two figures,only three typical temperatures are presented.At 10 and 150 K,the HCP atoms do not have obvious changes below a strain of 0.02.Above this,the number tends to increase.At the yield point as indicated by the vertical line,the increase trend becomes obvious.On the contrary,a different behavior can be found for the sample at 250 K.Soon aftertherelaxation,thenumberofHCP atoms increases.After a small peak,it decreases and keeps constant for a short strain region.Above a strain of 0.02,the HCP atoms restart to raise as those at low temperature.This observation implies that a number of dislocations are generated by the raised temperature even without stretching,and a recrystallization takes place in the same period.Fig.5(c)and 5(d)show the evolution of the samples Para2-20 and Para2-24 in which the grain aspect ratios are less than 1.Although more grains are included in the samples,the variation of the number of the specific atoms does not show obviousdifference atlow temperaturesas compared with the other two samples.However,at 250 K,the curves are very characteristic.HCP atoms increased dramatically after relaxation.After a considerable peak,the number of HCP atoms declines and then increase again.Comparing the four samples,the quantitative change of the specific atoms is more dramatic for the nanowires with small grains.The variation of the number of HCP atoms reflects the generation and evolution of the dislocation or the disordered atoms.Therefore,we can infer that as the temperature increases, the grain size-dependent deformation mechanism is changed.Especially,at a temperature above 200 K,the dislocation slip is activated,and the maximum attainable yield strength should decrease.
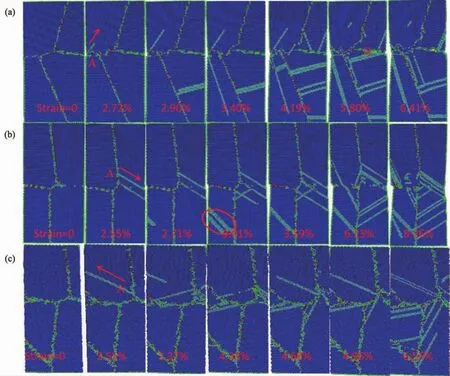
Fig.6 Tensile yielding of Para2-8 at(a)10 K;(b)150 K;(c)250 K
2.3 Atomic configuration during application of tensile stress
To further understand the temperature effect on the deformation mechanism of polycrystalline silver nanowires,the evolution of the microstructures of the samples Para2-8,Para2-16 and Para2-24 under 10,150 and 250 K,respectively,have been captured and compiled together for comparison.
Sample Para2-8 has 11.77 nm mean grain size which is close to the Hall-Petch limit.Therefore,the analysis of this sample is of great importance for understanding the temperature dependence of the shift of the Hall-Petch relation.At low temperature as shown in Fig.6(a),the first dislocations emanate from the cross point between the grain boundary and surface orthe junction ofgrain boundariesas symbolized by the letter A.The disordered atoms at grain boundaries possess high energy,making it easier to overcome the slip barrier.Therefore,some dislocations are generated at grain boundaries upon the tensile loading.With further stretching,voids at grain boundaries marked by letter B appear in the polycrystalline silver nanowire,leading to the final break.The material shows fragile (brittle)rather than plastic behavior,due to the limited number of slips in large grain and at low temperature.At a raised temperature,the atoms at grain boundaries become more active and dislocations can be generated directly from the grain boundary as also indicated by the letter A in Fig.6(b).In addition,when the leading partial dislocations reach a grain boundary,pile-ups were formed,shown by the solid circles in Fig.6(b).As the deformation progresses,such pile-ups served as new dislocation nucleation sources,generating further dislocations.At 250 K,most dislocations are originated from grain boundaries.We also noted that many dislocation slipsare propagated alongthe grain boundary,very similar to the mechanism of grain sliding that often appear in the reverse Hall-Petch relation.These results confirm that higher temperature provide atoms with greater thermal energy.This may generate more dislocations in the crystalline grains and facilitate grain sliding,inferring that the Hall-Petch relationship shifts toward large grain size while temperature increases.
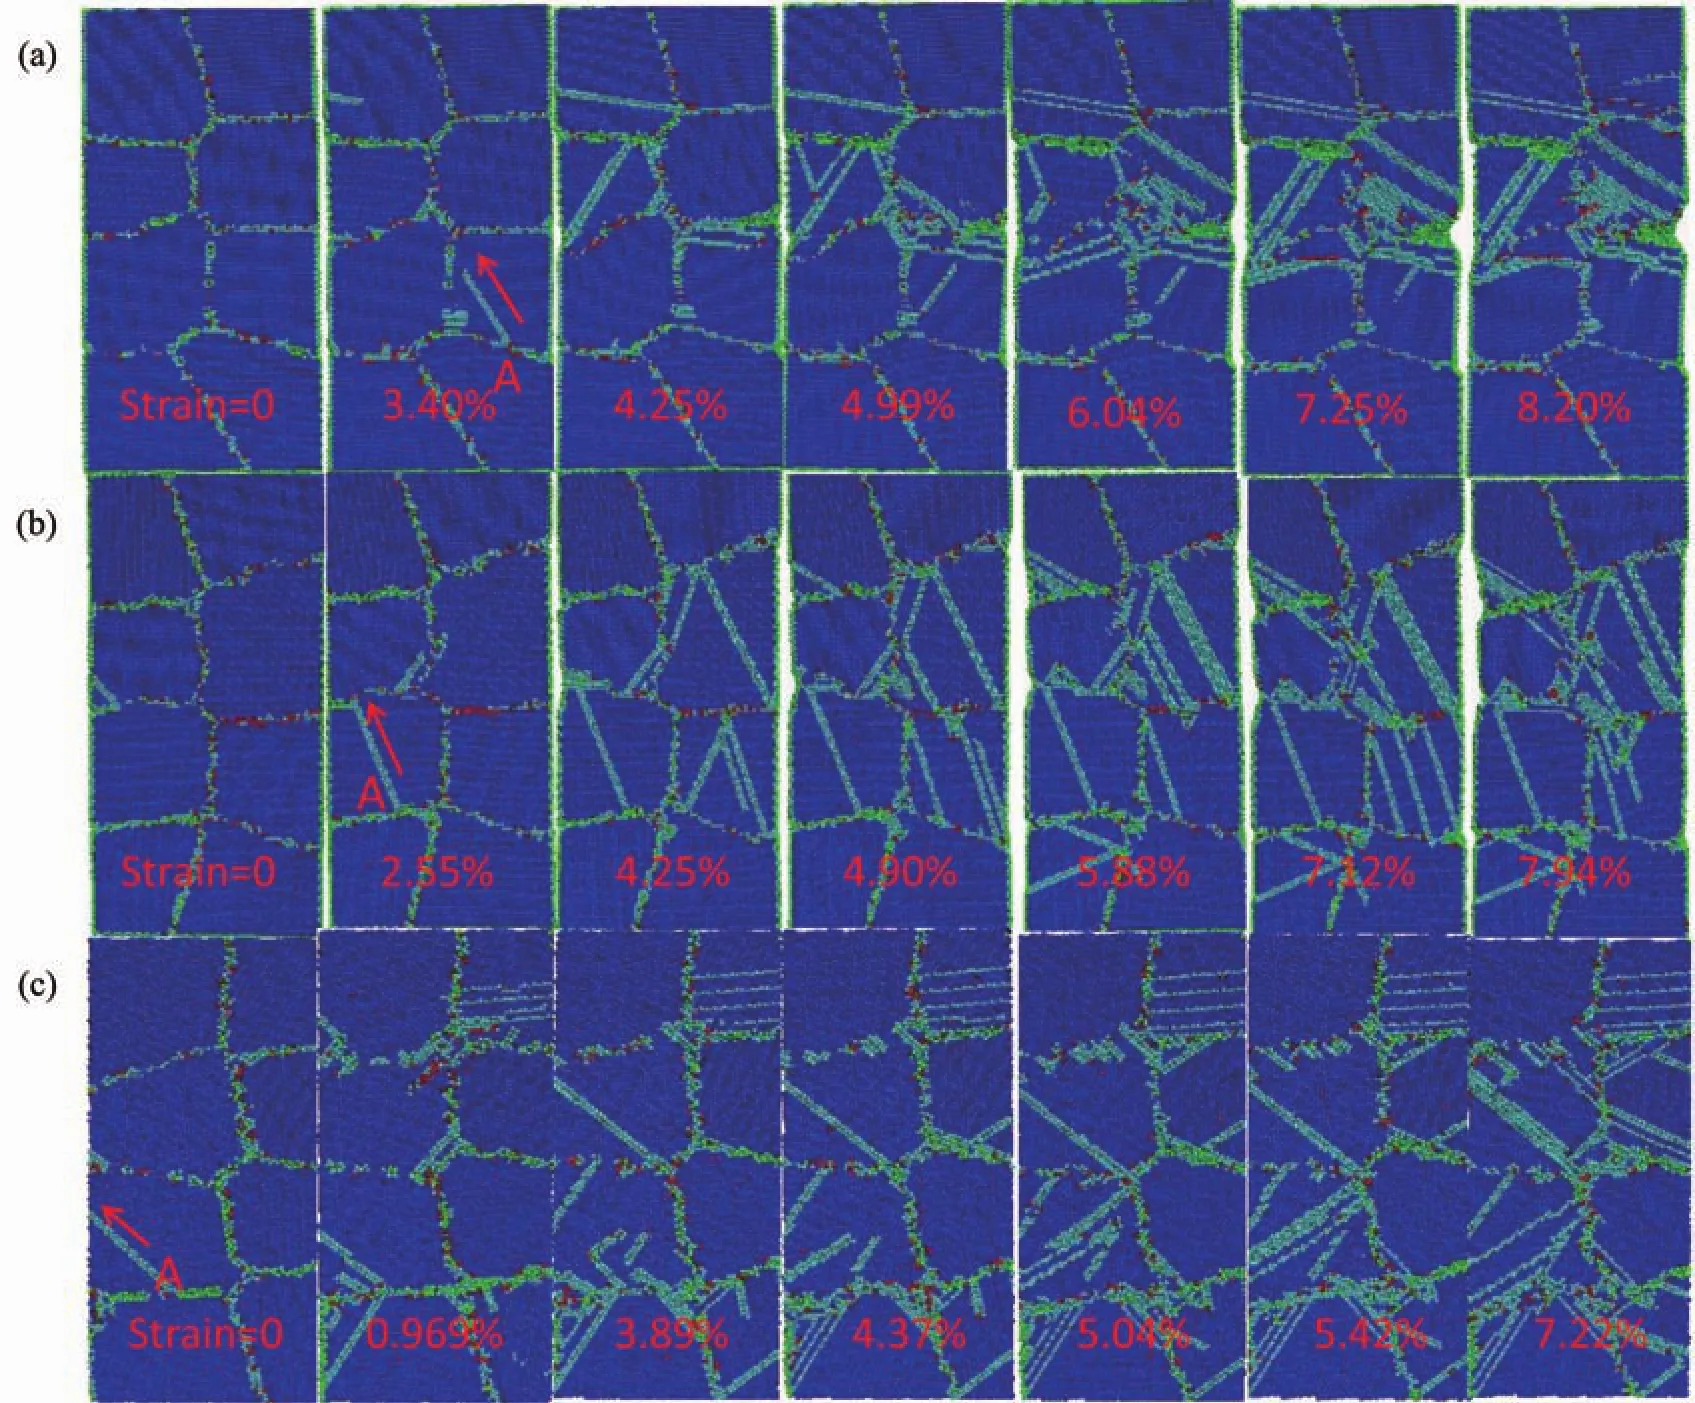
Fig.7 Tensile yielding of Para2-16 at(a)10 K;(b)150 K;(c)250 K
The model Para2-16 with smaller grains is a little far from the Hall-Petch limit size,the temperature dependenceofthe deformation mechanism become different to that with large grains.Due to the presence of larger numbers of grains,the dislocations have a higher probability to be generated at the grain boundary even at low temperature.As shown by the second picture in Fig.7(a),two dislocations appear with one at the surface and the other at the grain boundary.At 4.25%strain,the grain boundary appears to absorb the dislocation,and then becomes wider.With further stretching,a large number of dislocations are generated at both the surface and the grain boundaries.When the system is experienced heattreatment at 250 K for 256 ps,the crystalline atoms close to the grain boundary tend to be melted and the grain boundaries becomes wider as compared to those at lower temperature.In addition,a few dislocations appeareven though no stretching takes place,demonstrating the dislocation slip becomes dominant at high temperature.Fig.7(c)shows these features,further demonstrating the essential change of the crystalline structure athigh temperature.There featuresare alsoreflected from the quantitative change of specific atoms as given in Fig.5.The number of HCP atoms increases even after relaxation at 250 K.It is worth noticing that the initial structure are changed,in other words,the nanowire is softened and the yield stress decreases significantlywith further increasing temperature when the temperature is over 200 K(shown in Fig.3(d)).This can be understood qualitatively in that a great number of metal atoms can gain sufficient energy to overcome the activation barrierand rearrange the initial configuration easily at higher temperature[38].We also observed that the first dislocations are all emitted from grain boundaries.Then,these dislocations propagate into grains and annihilate at opposite grain boundaries.

Fig.8 Tensile yielding of Para2-24 at(a)10 K;(b)150 K;(c)250 K
The tensile deformation process of the nanowire with 24 grains is shown in Fig.8.The sample has much more grains than others,the ratio of the atoms at grain boundaries is increased to 10.19%.Since more active atoms contribute to the generation of dislocations,the first dislocation are rather likely generated from grain boundary in all temperature regimes.However,due to the small grain size,the dislocations can traverse only short distances and are blocked by either the free surface or the grain boundary.At 10 K,the material presents fragile feature thatalargenumberofdislocationsare generated in those grains located at the middle part of the nanowire.This concentration of the dislocations results in the rapid necking and final breaking.At 100 K,the dislocations generated look to be randomly populated over the nanowire.They propagate in the grains and are hard to traverse to the neighboring grain.However,the grain boundary is an important source for the new dislocations.This might be the reason why the system with smaller grains may have lower yield stress and Young′s modulus in the reverse Hall-Petch region.Further increasing temperature may result in more melted atoms at the grain boundary as shown in Fig.8(c).This increase of the disordered atoms is very profound for the system with small grains as also indicated by the variation of HCP atoms in Fig.5(c)and(d).High temperature improve the nanowire ductility,accompanying a numberofdislocations generated even at the beginning of the stretching.This feature much decreases the system strength.
Summarizing the above analyses and discussions,we propose the temperature effect on the tensile behavior of the nanowires as shown in Fig.9.The parabolic curve presents the Hall-Petch relation together with the reverse Hall-Petch relation.The top on the curve corresponds to the Hall-Petch limit,symbolizing the maximum attainable yield strength via grain boundary strengthening.At a temperature below than 200 K,the relation may shift toward the large grain size when temperature increases.The maximum yield strength has also slight decline.When the temperature is above 200 K,with the increase of temperature,dislocation slip becomes the dominant deformation mechanism gradually for the polycrystalline nanowires,the maximum attainableyield strength via grain boundary strengthening fall sharply.
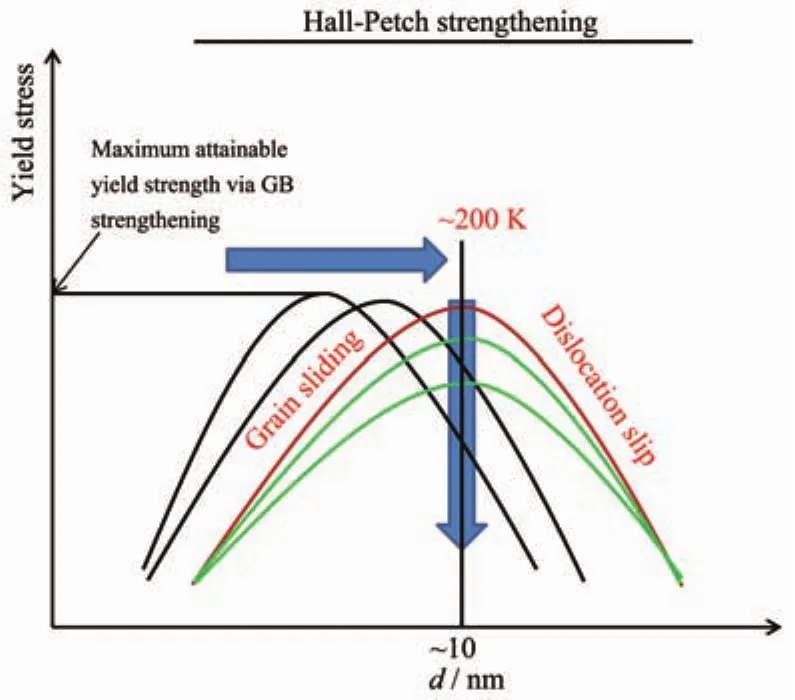
Fig.9 Hall-Petch strengthening is limited by the different temperature
3 Conclusions
In thiswork,the effectoftemperature on polycrystalline silver nanowires was studied using molecular dynamics simulations.For the polycrystalline materials that have grain size smaller than the Hall-Petch limit,the large amount of the disorder atoms atthe grain boundary makes itactive energetically.The smaller the grain size,the more active the materials.Therefore,the analysis on the dislocations generated from the grain boundary is instructive forunderstanding ofthe deformation mechanism of the system.When the equivalent grain size varies from 8.16 to 11.77 nm,the dislocations were observed to occur in the grains,and propagate to the grain boundary.Then,the grain boundary may impede dislocation or allow it to traverse to next depending on the temperature and grain size.Therefore,a temperature dependentHall-Petch relation was concluded.At a temperature below 200 K,the relation may shift toward the large grain size when temperature increases.The maximum yield strength has also slight decline.When the temperature is higher than 200 K,with the temperature increasing,dislocation slip is the dominant deformation mechanism for polycrystalline nanowires, the maximum attainable yield strength via grain boundary strengthening fall sharply.
Acknowledgements:The project was supported by the National Natural Science Foundation of China (Grant No.51271074).
[1]Field D P,Adams B L.Acta Metall.Mater.,1992,40(6):1145-1157
[2]Lim L C.Acta Metall.,1987,35(7):1653-1662
[3]Randle V.Role of the Coincidence Site Lattice in Grain Boundary Engineering.London:Woodhead,1996.
[4]Van Swygenhoven H.Science,2002,296(5565):66-67
[5]Van Swygenhoven H.Mater.Sci.Forum,2006,503-504:193-200
[6]Van Swygenhoven H,Farkas D,Caro A.Phys.Rev.B,2000,62:831-838
[7]Yamakov V,Wolf D,Phillpot S R,et al.Nat.Mater.,2002,1:45-49
[8]Wen Y H,Zhu Z Z,Zhu R Z.Comput.Mater.Sci.,2008,41:553-560
[9]Zhu T,Li J,Samanta A,et al.Proc.Natl.Acad.Sci.U.S.A.,2007,104:3031-3036
[10]Ma E,Wang Y M,Lu Q H,et al.Appl.Phys.Lett.,2004,5:4932-4934
[11]Sanders P G,Eastman J A,Weertman J R.Acta Mater.,1997,45:4019-4025
[12]Sato F,Moreira A S,Bettini J,et al.Phys.Rev.B,2006,74(19):193401
[13]Wu X L,Ma E.Appl.Phys.Lett.,2006,88:231911
[14]Wang D,Zhao J,Hu S,et al.Nano Lett.,2007,7:1208-1212
[15]Lu L,Sui M L,Lu K.Science,2000,287:1463-1466
[16]Lu L,Shen Y F,Chen X H,et al.Science,2004,304:422-426
[17]Chen M W,Ma E,Hemker K J,et al.Science,2003,300:1275-1277
[18]Kumar K S,Van Swygenhoven H,Suresh S.Acta Mater.,2003,51:5743-5774
[19]Schiotz J,Jacobsen K W.Science,2003,301:1357-1359
[20]Zhang F,Liu Z,Zhou J Q.Mater.Lett.,2016,183:261-164
[21]Zhang H,Srolovitz D J,Douglas J F,et al.Phys.Rev.B,2006,74:115404
[22]Shan Z W,Stach E A,Wiezorek J M K,et al.Science,2004,305:654-657
[23]Yamakov V,Wolf D,Phillpot S R.Nat.Mater.,2004,3(1):43-47
[24]Conrad H,Narayan J.Scr.Mater.,2000,42:1025-1030
[25]Conrad H,Jung K.Mater.Sci.Eng.A,2005,406:78-85
[26]Clement K,Eric H.Mater.Lett.,2008,62:1718-1720
[27]Godon A,Creus J,Cohendoz S,et al.Scr.Mater.,2010,62(6):403-406
[28]Chokshi A H,Rosen A,Karch J,et al.Scr.Metall.,1989,23(10):1679-1683
[29]Zhao J,Yin X,Liang S,et al.Chem.Res.Chin.Univ.,2008,24(3):367-370
[30]SUN Yin-Lu(孙 寅 璐),GAO Ya-Jun(高 亚 军),SUN Qian(孙倩),et al.Acta Phys.-Chim.Sin.(物理化学学报),2015,31:1880-1887
[31]Gao Y,Sun Y,Yang X,et al.Mol.Simul.,2015,41:1546-1552
[32]Sun Y,Gao Y,Sun W,et al.Mol.Simul.,2015,41:1245-1253
[33]Mishin Y,Farkas D,Mehl M,et al.Phys.Rev.B,1999,59:3393-3407
[34]Johnson R A.Phys.Rev.B,1988,37:3924-3931
[35]Johnson R A.Phys.Rev.B,1988,37:6121-6125
[36]Wu H A.Eur.J.Mech.A Solids,2006,25:370-377
[37]Kelchner C L,Plimpton S J,Hamilton J C.Phys.Rev.B,1998,58:11085-11088
[38]Zhao Y,Chen Z,Long J,et al.Acta Metall.Sinica,2014,27:81-86
Molecular Dynamics Investigation on the Temperature Dependence of the Deformation Mechanism of the Polycrystalline Silver Nanowires
ZHAO Jian-Wei*,1CHENG Na1WANG Xiu-Xiu2YU Gang*,2Colm Durkan3WANG Nan3
(1College of Material and Textile Engineering,Jiaxing University,Jiaxing,Zhejiang 314001)
(2Key Laboratory of Chemo/Biosensing and Chemometrics,College of Chemistry and Chemical Engineering,Hunan University,Changsha 410082)(3Nanoscience Centre,University of Cambridge,Cambridge,CB3 0FF,UK)
Based on molecular dynamics simulations,the plastic deformation of columnar polycrystalline silver nanowires under uniaxial tension at different temperatures has been studied systematically.At a temperature below 200 K,the system with large grains deforms predominantly via the mechanism of dislocation slip,and the maximum yield strength remains relatively constant with temperature.When the simulation temperature is over 200 K,grain sliding gradually becomes the dominant deformation mechanism,especially for those samples with reduced grain size and the maximum yield strength shows a decrease with the increase of temperature.The temperature-dependence of the Hall-Petch relation has been discussed.
polycrystalline;nanowires;temperature;tensile;Hall-Petch relation;molecular dynamics
O614;O488
A
1001-4861(2018)01-0043-12
10.11862/CJIC.2018.011
2017-06-27。收修改稿日期:2017-09-20。
国家自然科学基金(No.51271074)资助项目。
*通信联系人。 E-mail:jwzhao@mail.zjxu.edu.cn,yuganghnu@163.com,Tel:+86-573-83642272;会员登记号:070310036。

