Life CycleAssessment of PHEV*
Chen Yisong,Hu Xu,2,Liu Jiahui
(1.Chang’an University,Xi’an 710064;2.Beijing Institute of Technology,Beijing 100081)
Life CycleAssessment of PHEV*
Chen Yisong1,Hu Xu1,2,Liu Jiahui1
(1.Chang’an University,Xi’an 710064;2.Beijing Institute of Technology,Beijing 100081)
The main target of the study was to perform a life cycle assessment of a Prius PHEV by GaBi modeling.The ANL model was used to simplify the functional unit and the process of GaBi modeling in material production,while the GaBi modeling was used to analyse some specific processes during the component manufacture unavailable in GREET 2.The assembly,use and repair phase were also investigated.The results revealed that the use phase accounts for a majority of energy use and emissions which result from fuel combustion and electricity generation for charging the batteries.Mineral resources consumption are dominated by material production.Besides,the GaBi modeling helps to improve the accuracy of CO2emission calculation during the component manufacture about 17.39%.
PHEV,Lifecycleassessment,GaBi,ToyotaPrius
1 Introduction
Life Cycle Assessment(LCA)is generally used for identifying environmental impacts of electric vehicles and seen as the main solution to the problems of diminishing energy supplies and environmental pollution.A research on hybrid electric vehicles showed that the Prius has lower pollutant and carbon dioxide emissions and better fuel economy than Corolla[1].Battery electric vehicles having null tailpipe emissions imply greenhouse gas emissions stem from its production and the electricity generation needed to charge its batteries,thus it is necessary to use LCA methods to calculate the Global Warming Potential(GWP)associated to the electricity generation on the electric vehicle[2].When it comes to life cycle Greenhouse Gas(GHG)emissions from several light-duty passenger gasoline and Plug-in Electric Vehicles(PEVs),it was found that PEVs can have larger or smaller carbon foot prints than gasoline vehicles,depending on these regional factors and the speci fi c vehicle models being compared[3].Many modeling methods are applied to LCA of electric vehicles. Argonne National Laboratory calculated the energy use and emissions of a hybrid electric vehicle and a fuel cell vehicle based on GREET(Greenhouse gases,Regulated Emissions,and Energy use in Transportation)model.GaBi software was also used to model two dynamic systems of gas car and battery electric vehicles to estimate their energy use and emissions[4].
The purpose of the study was to perform a LCA of a Prius Plug-in Hybrid Electric Vehicle(PHEV)by GaBi modeling,which helps to analyse some specific processes during the component manufacture unavailable in GREET 2 so that the LCA can become more specific and reliable.
2 Methodology
2.1 Functional Unit
The functional unit was defined as a Prius PHEV driving 250 000 km on Chinese road.This functional unit has been used in other LCA of PHEV[5].The main vehicle parameters are shown in Table 1.
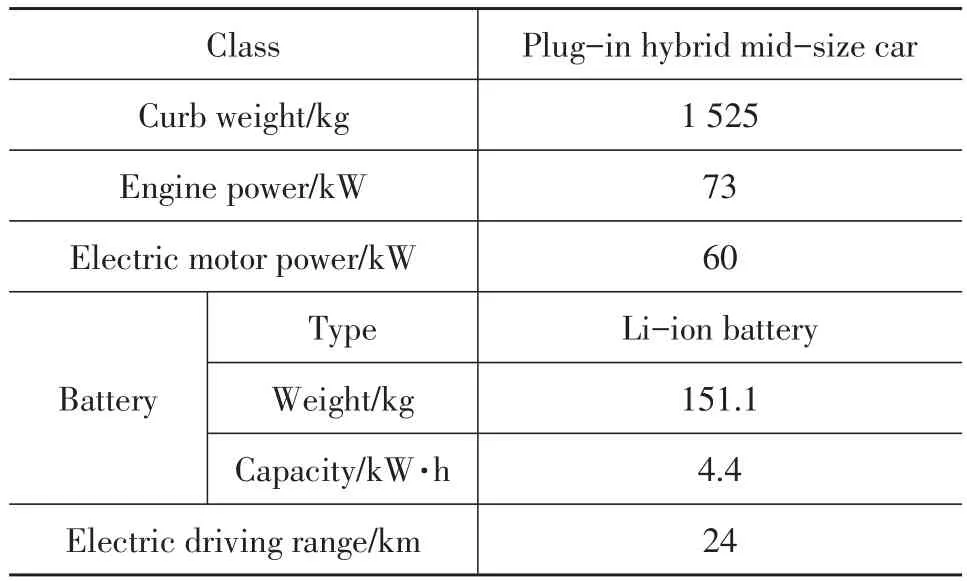
Table1.Main vehicleparameters
2.2 System Boundary
The system boundary was restricted to five phases including material production,component manufacture,assembly,use phase and repair.The energy use this paper focuses on are crude oil,hard coal and natural gas.As for emissions,only CO2,CO,NOx,SOx,NMVOC,CH4,PM10 and PM2.5 are inside the system boundary.The system boundary is shown in Figure 1.

Figure 1.System boundary
3 Modeling
In this study,the modeling was based on GaBi,which is one of the most professional LCA and LCC(Life Cycle Cost)softwares in the world.The data essential for GaBi modeling was based on literature and GaBi database.It should be emphasized that the functional unit,a Prius PHEV,was broken down into four major categories based on the method used at ANL[6].The four major categories are main components,Pb-Ac battery,Li-ion battery,and fluids.The main components category includes seven major systems:body,powertrain,transmission,chassis,electric traction motor,generator,electronic controller.Pb-Ac battery is used to handle the startup and accessory load,and Li-ion battery acts in the electric-drive system.The fluid category includes engine oil,power steering fluid,brake fluid,transmission fluid,powertrain coolant,windshield fluid,and adhesives.
3.1 Material Production
Material production is a process where mineral resources are transformed into vehicle materials used in component manufacture.The materials used was first identified in the four vehicle major categories and then established GaBi modeling for each major category.The data on the material composition of each major category was based on literature[5].The GaBi modeling of material production is given in Figure 2 and mterial composition is shown in Table 2.
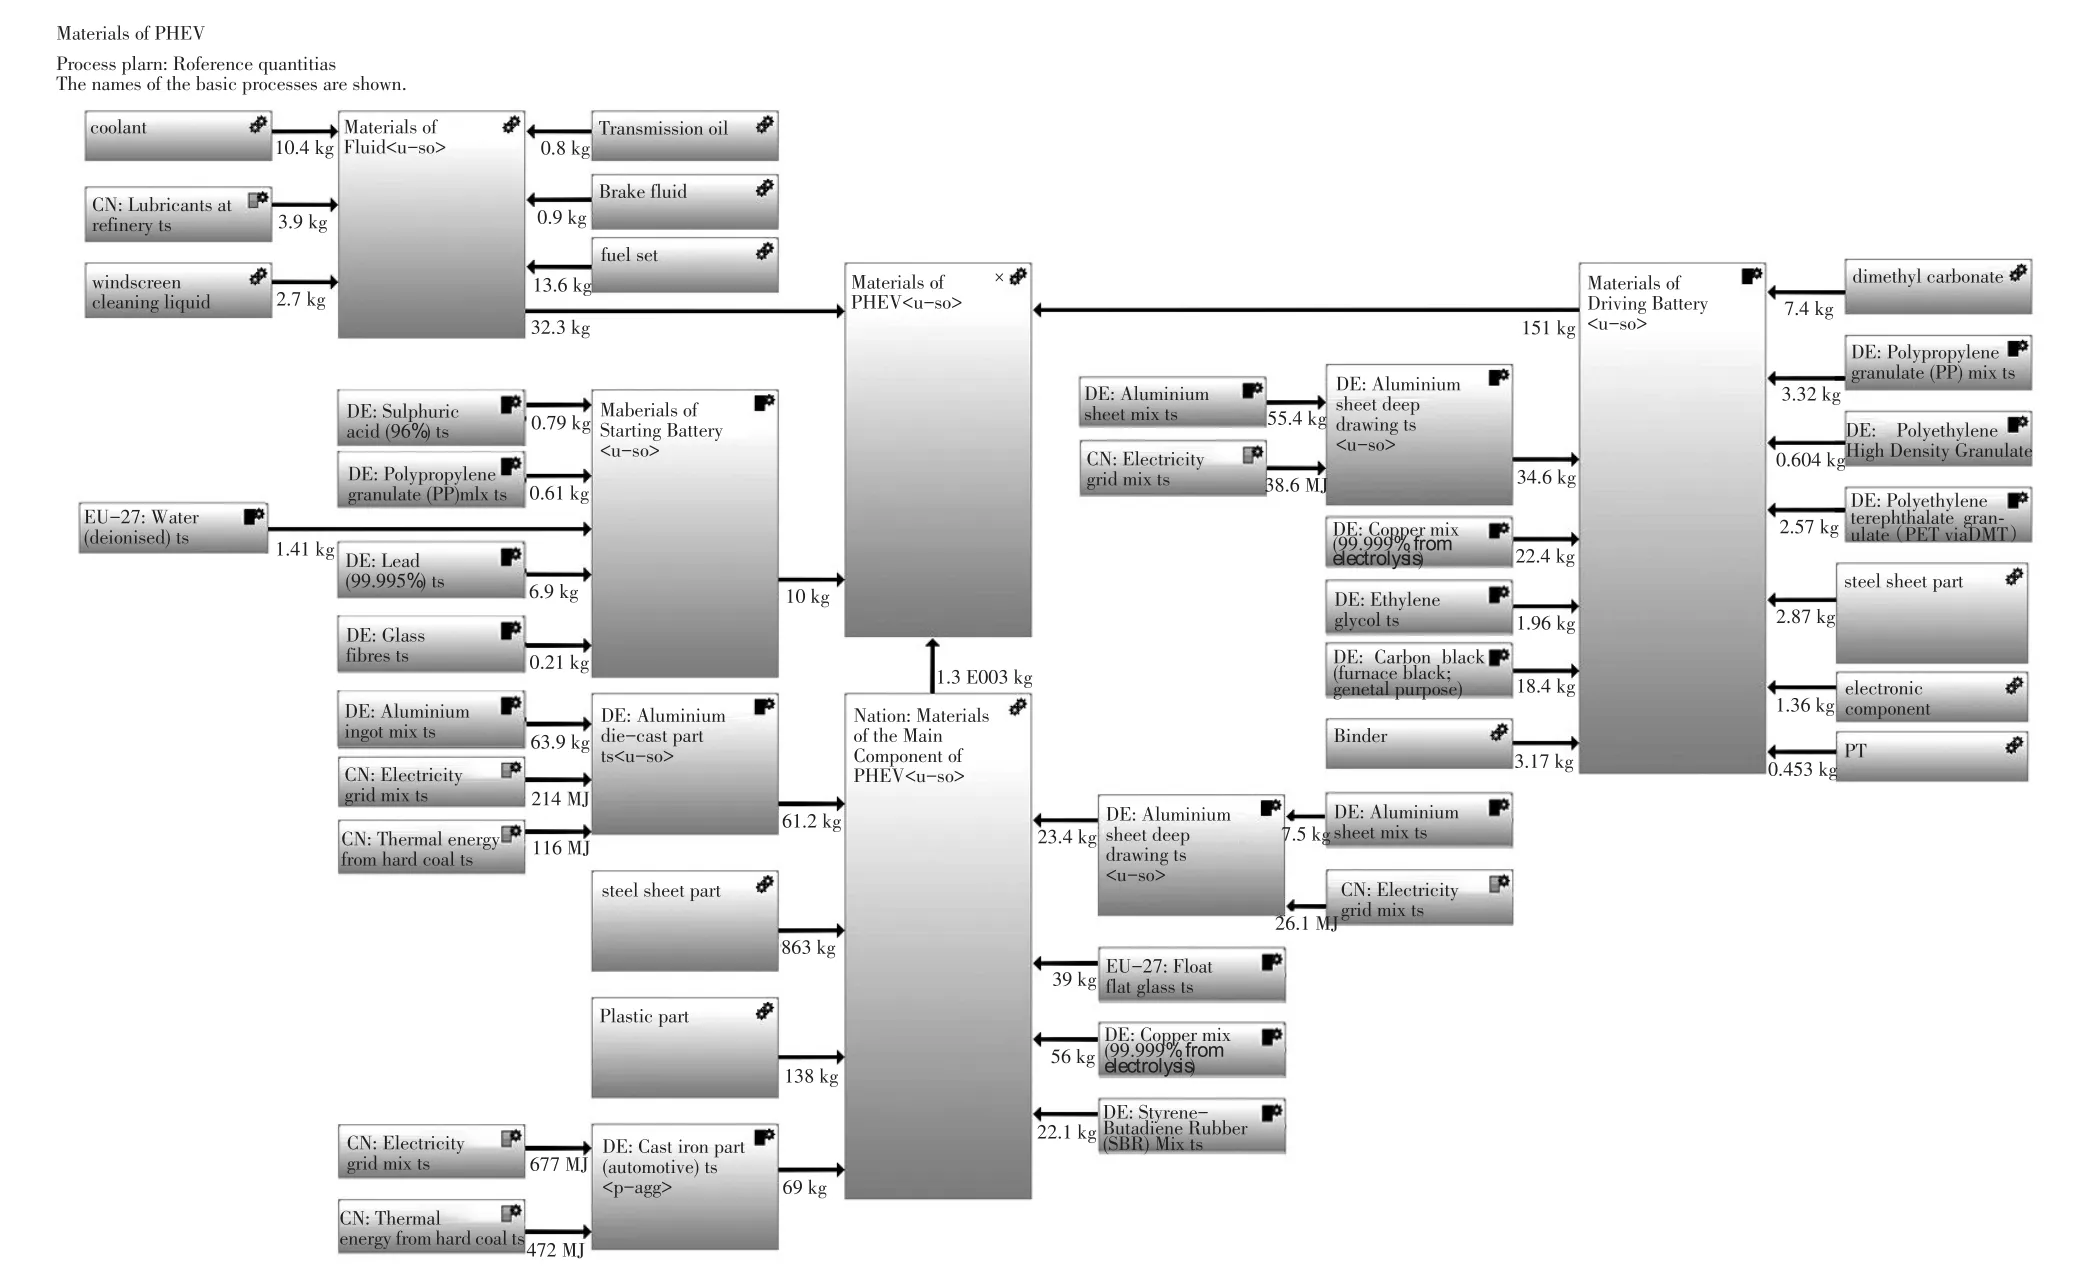
Figure 2.Material production
3.2 Component Manufacture
Component manufacture is a process where vehicle materials are transformed into vehicle components prepared for assembly.The energy use and emissions during component manufacture were calculated by characterizing the manufacture process of every vehicle component and collecting data associated with power consumption in these processes.It was assumed that the manufacture process of every vehicle component from Prius was identical to that in Chinese plants.The manufacture processes and data were based on literature[7],literature[8]and field research.It was assumed that the Prius PHEV is similar to an existing Prius HEV(Hybrid Electric Vehicle),except for the requirements of a larger battery and a smaller combustion engine[9].Weights of main components were based on GREET 2.Weights of Li-ion battery and Pb-Ac battery were both based on literature[5].Manufacture processes offluids were considered during material production phase and were not included in component manufacture.Because of lack of available data,it was hard to model the manufacture processes of all vehicle components.The GaBi modeling of main component manufacture is shown in Figure 3.

Table2.Material composition %by weight
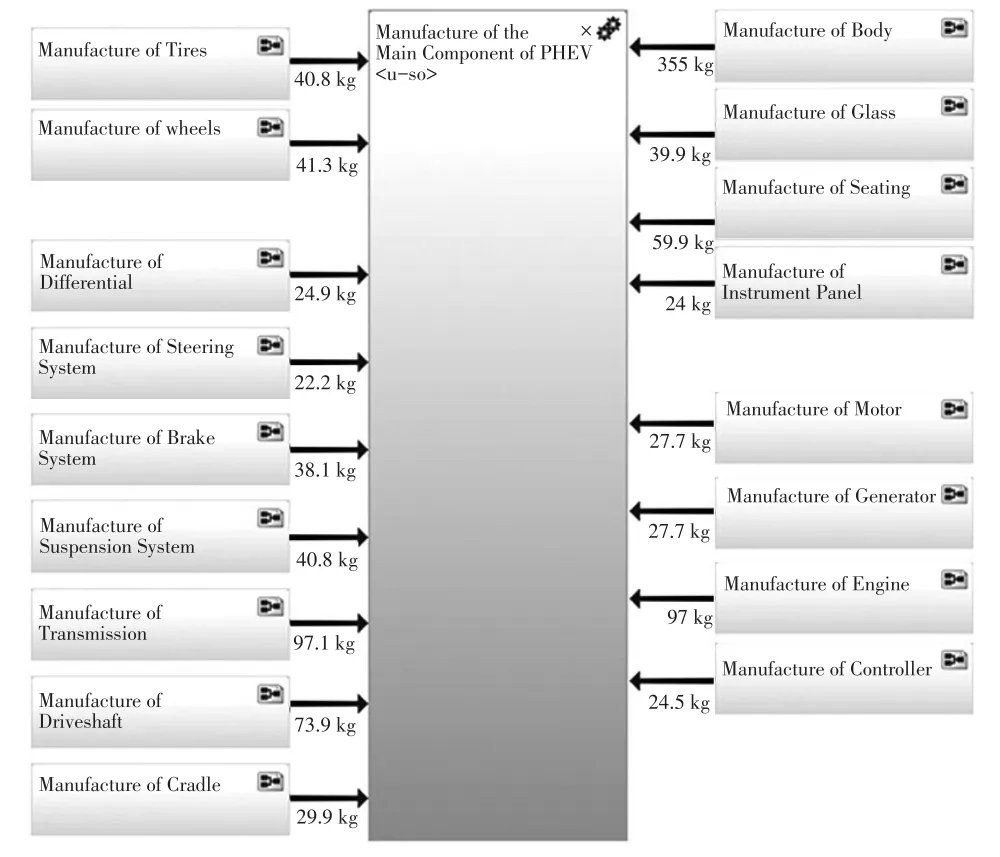
Figure 3.Main component manufacture
3.3 Repair
Components require replacement during a vehicle’s lifetime. Because of lack of data showing the environmental impact of the replacement process,only the environmentalimpactofthe manufacture ofvehicle components replaced was considered[5].
We considered tire and fluid replacement,and replacement of parts such as air filters,brake pads,spark plugs,and windshield wiper blades was not included because of the small weight of these parts.It was assumed that the tires are replaced every 62 500 km,requiring three replacements over the vehicle’s lifetime[6].Replacement of fluids in a vehicle is needed during routine maintenance.It was assumed that the engine oil is replaced every 6 250 km,so about 39 lifetime refills are needed[6].Besides,it was assumed that the windshield wiper fluid is completely consumed every12 500 km,requiring19 lifetime replacements[6].We supposed that both the brake fluid and powertrain coolant are replaced every 62 500 km,requiring three lifetime replacements each.It was assumed that transmission fluid requires one refill[6].Additional components also requiring replacement are Li-ion and Pb-Ac batteries.On the basis of experiments performed by Saft,Li-ion battery life is 15 years,so it was assumed that replacement of Li-ion battery is not needed.Based on data collected byUSCAR (United StatesConsortium for Automotive Research),we assumed that the Pb-Ac battery would require one replacement in the lifetime of the PHEV[5].The GaBi modeling of repair phase is given in Figure 4.
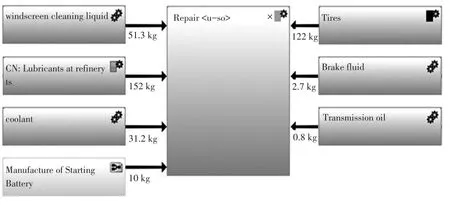
Figure 4.Repair phase
4 Results
4.1 Material Production
Table 3 shows the energy use and emissions per vehicle major category in material production.The results show that,in total,hard coal is the dominating energy consumption,and CO2is the dominating emission.Main components category and Pb-Ac battery use a larger percentage of hard coal during material production,while Li-ion battery and fluids have a higher energy use of crude oil.All major categories have a higher CO2emission.
4.2 Component Manufacture
Table 4 and Table 5 reveal that the dominating energy consumption in component manufacture stem from hard coal,and CO2is the dominating emission.Transmission represents the most energy-intensive component in all vehicle components considered in component manufacture.Except for SOx,transmission has a larger percentage of emissions than other components.Seating has a higher emission of SOxthan other components.

Table3.Energy useand emissionsfor material production
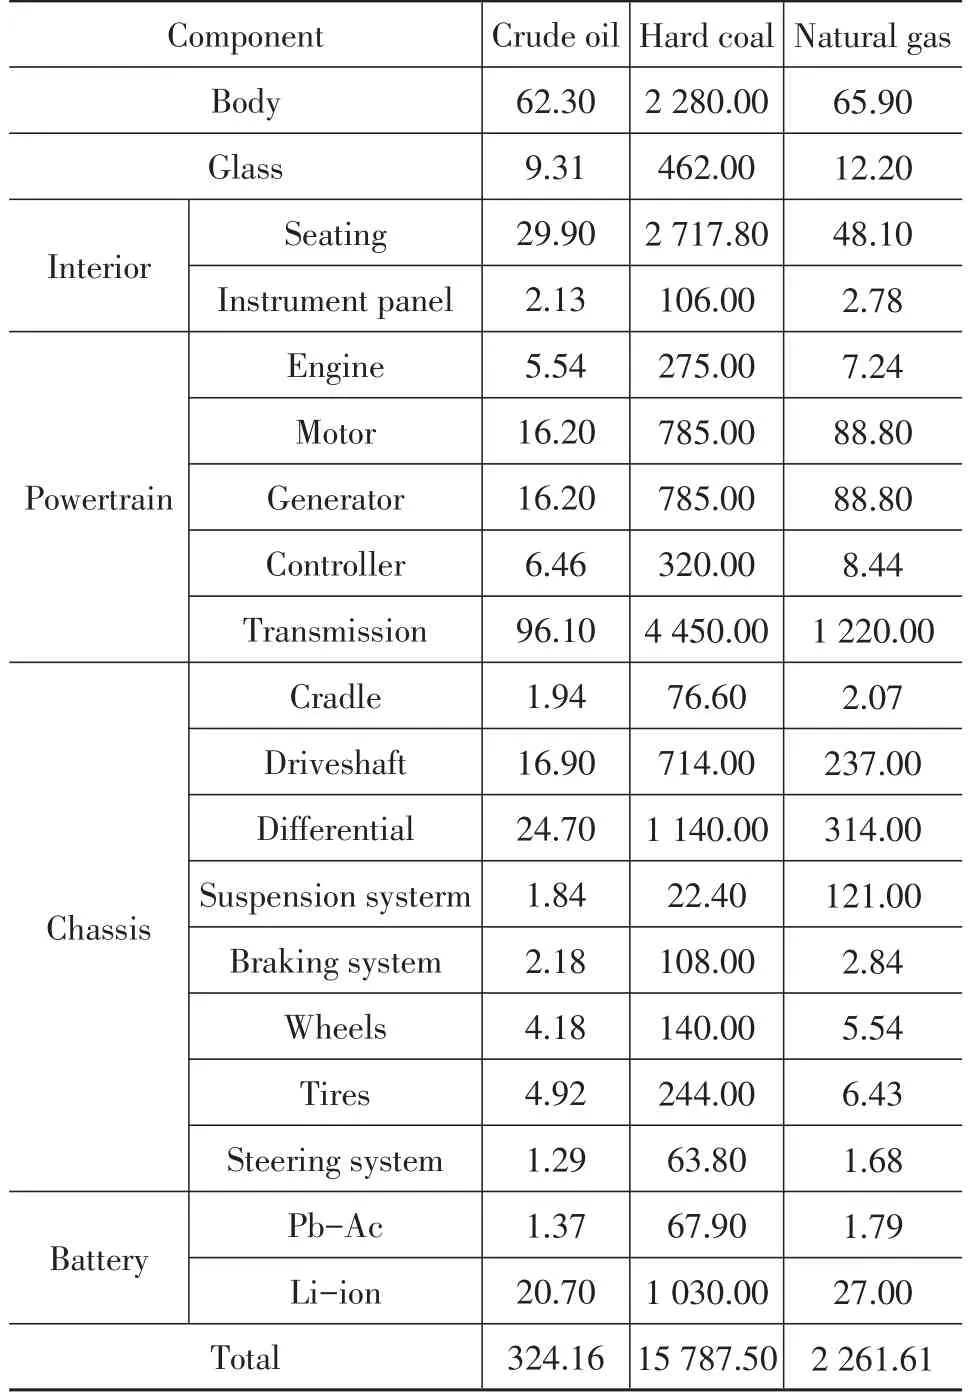
Table4.Energy usefor component manufacture MJ
4.3 Assembly
The energy use and emissions associated with vehicle assembly were calculated by data from research on the energy efficiency of assembly plants and life-cycle analyses of paint manufacturing and the painting process[6].These data were collected from literature[10],literature[6].Table 6 shows that the dominating energy consumption in assembly stems from hard coal.Table 7 reveals that the emissions are dominated by CO2,which is followed by SOx,CH4,PM2.5,NOx,CO,PM10 and NMVOC.
4.4 UsePhase
The Prius PHEV has three drive modes,all-electric(EV),and two hybrid modes:Eco and Power.The energy use in use phase depends on all electric range,which is affected by charge mode and driving mode[5].Daily Vehicle Kilometers Travelled(DVKT)in Beijing was chosen to calculate the energy use in use phase[5].The vehicle’s lifetime was 250 000 km.The results are shown in Table 6 and Table 7,which indicate that the dominating energy consumption is crude oil,and the emissions are dominated by CO2,which is followed by CO,NMVOC,NOx,PM10,PM2.5,CH4and SOx.
4.5 Repair
Table 6 shows that the dominating energy consumption in repair phase stems from crude oil.Table 7 proves the emissions are dominated by CO2,which is followed by CH4,SOx,NOx,CO,NMVOC,PM2.5 and PM10.
4.6 ComprehensiveAnalysis
Based on the LCA method of CML 2001,the environmental impacts were classified into seven categories:Abiotic Depletion elements(ADP elements),Abiotic Depletion fossil(ADP fossil),Global Warming Potential (GWP), Acidification Potential (AP),Eutrophication Potential(EP),Photochemical Ozone Creation Potential(POCP)and Ozone Layer Depletion Potential(ODP).Table 7 showsthecharacterization results.The mineral resources consumption and fossil energy consumption is given in Figure 5 and Figure 6.Figure 5 shows that mineral resources consumption are dominated by material production.Figure 6 reveals that use phase represents the most energy-intensive activity in the five phases,which isattributable to the mass consumptions of gasoline and electricity during the use lifetime(250 000 km).
In order to identify the relative importance of different environmentalimpactcategories,the characterization results were processed with the methods of normalization and quantification using the CML model.The normalized values and weight coefficients are based on the GaBi database and literature[11],which is shown in Table 8.
Figure 7 reveals that the life cycle environmental impacts of five phases are dominated by the use phase.The GWP and POCP have a larger percentage in use phase.The GWP in use phase results from the mass CO2emission due to the fuel combustion and the electricity generation for charging the batteries.The mass NOxemissionresults in the POCP.So it is essential to reduce the emissions of fuel combustion and electricity generation.In addition,the dominating environmental impacts in material production stem from the GWP,POCP and AP.During assembly phase,the environmental impacts are dominated by the GWP,POCP and AP.The POCP makes a dominating environmental impact on repair phase.
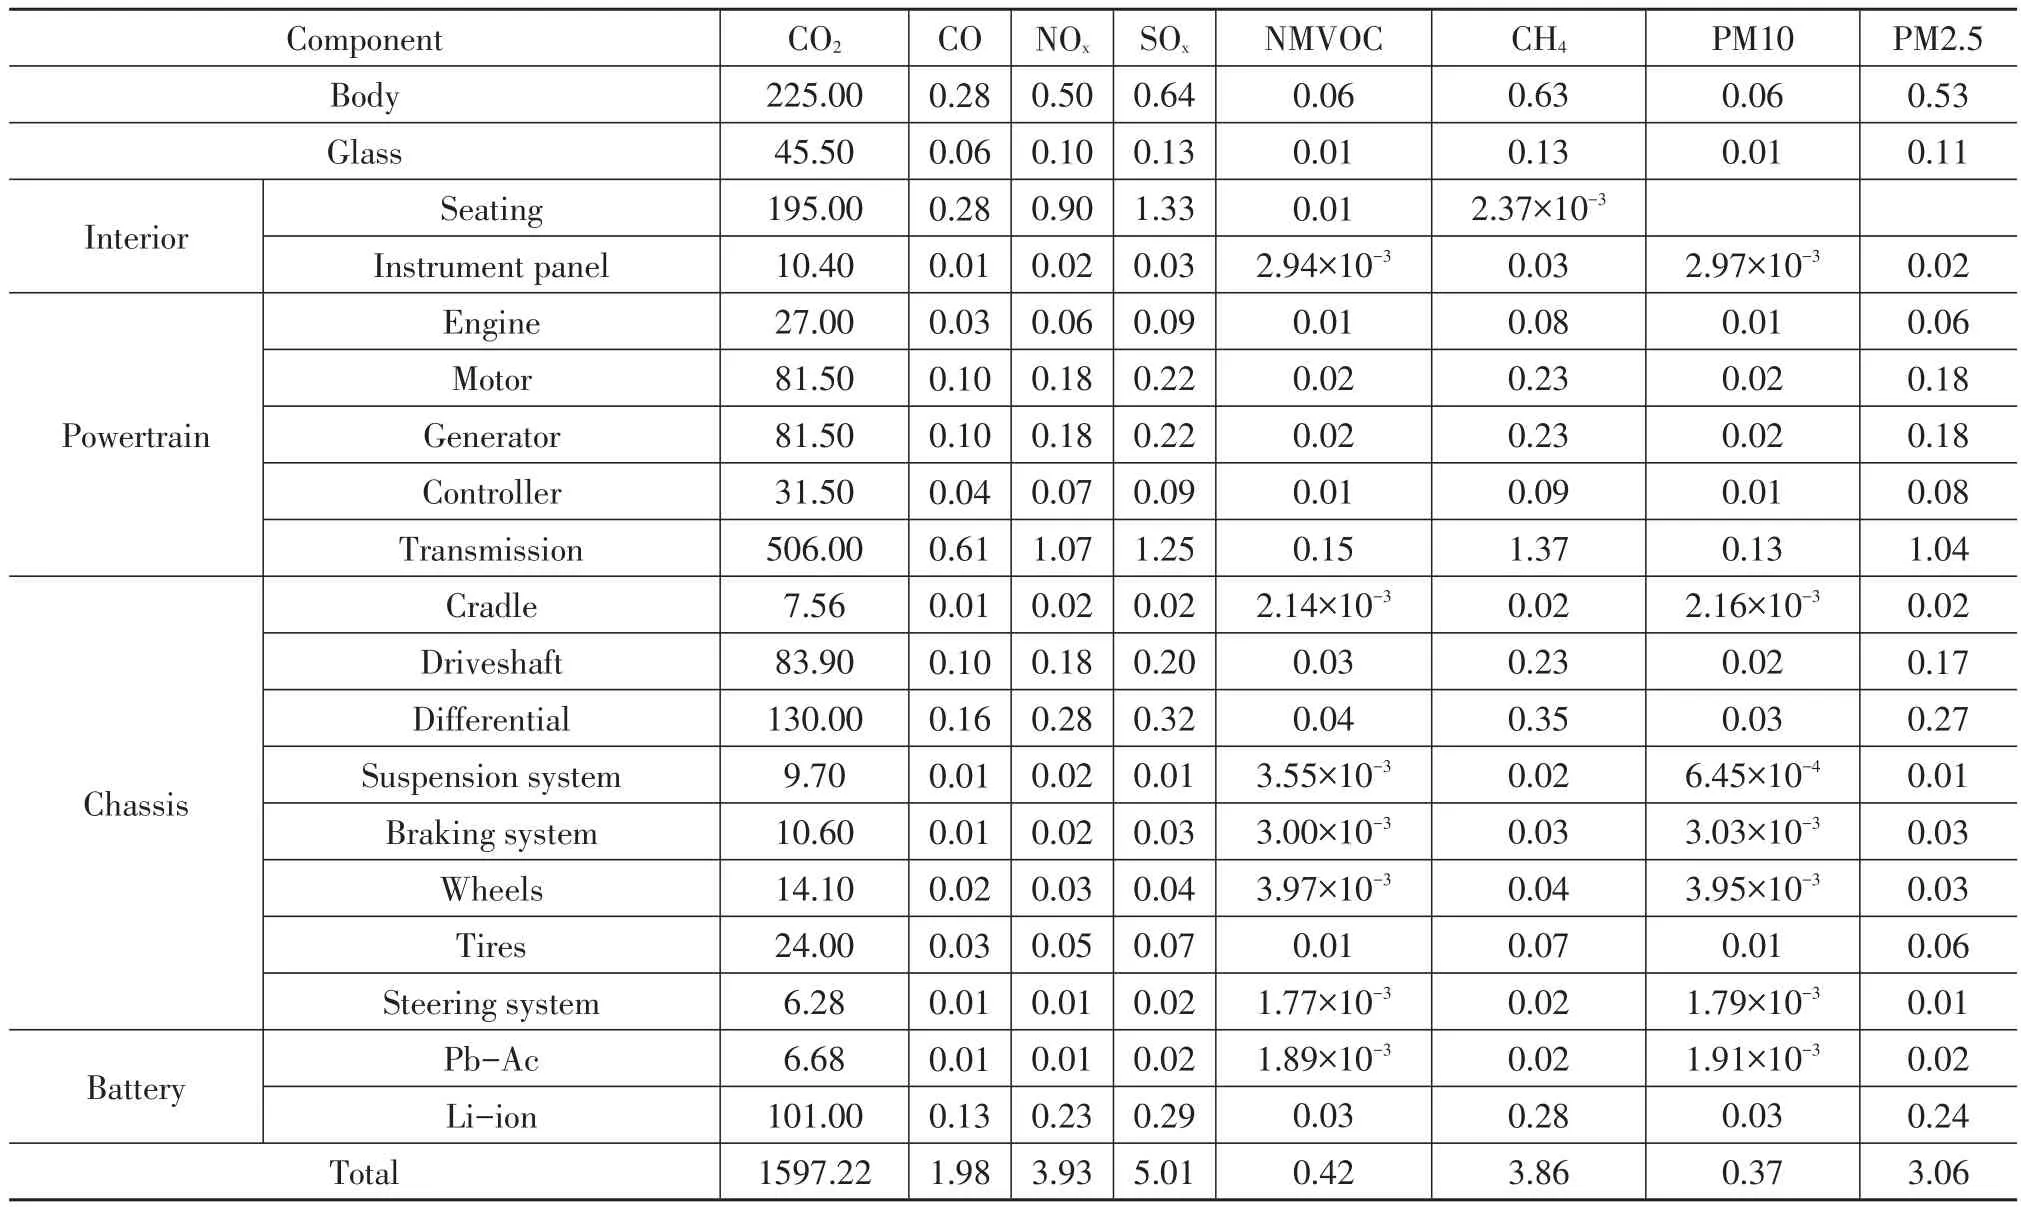
Table5.Emissionsfor component manufacture kg
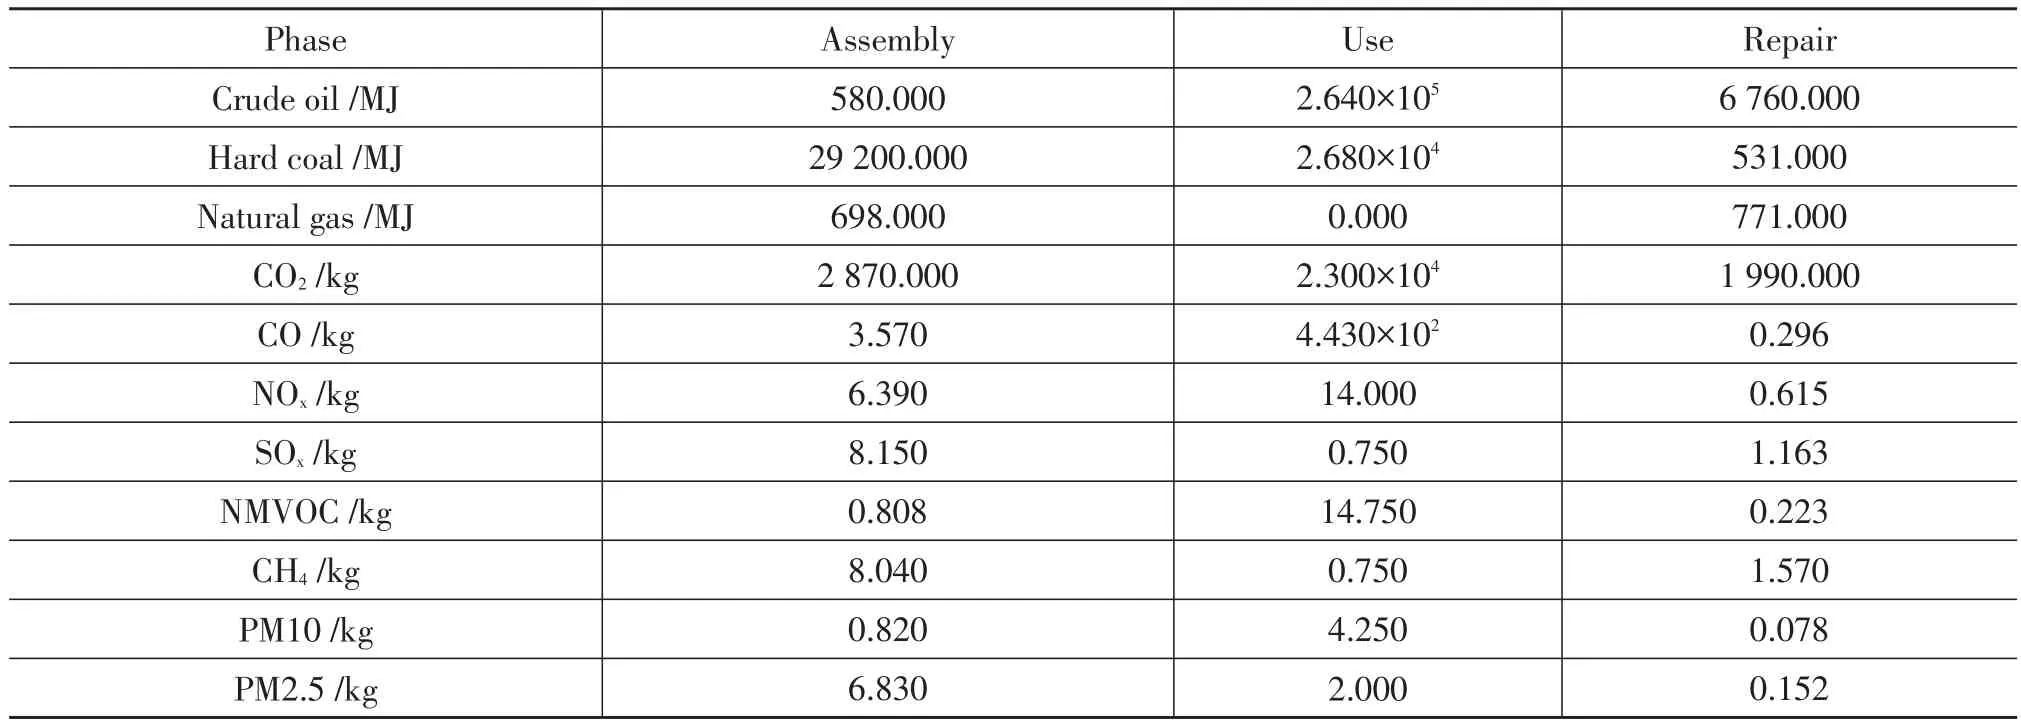
Table6.Energy useand emissionsfor thelast threephases

Table7.Characterization resultsof thelifecycleimpact of PHEV
5 Conclusions
The ANL model was used to simplify the functional unit and the process of GaBi modeling in material production,while the GaBi modeling was used to analyse some specific processes during the component manufacture unavailable in GREET 2.The results of LCA will be more specific and reliable by GaBi modeling.For instance,the CO2emission in material production is 9 186.80 kg,and the CO2emission during the component manufacture calculated by GaBi modeling is 1 597.22 kg covering a 17.39%proportion of CO2emission in material production.In other words,the GaBi modeling helps to improve the accuracy of CO2emission calculation during the component manufacture about 17.39%.

Figure 5.Mineral resources consumption
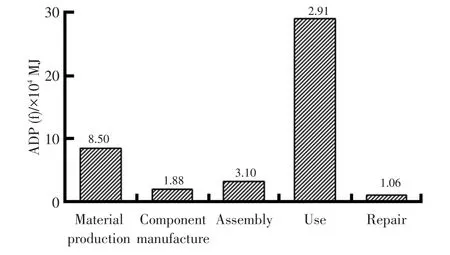
Figure 6.Fossil energy consumption
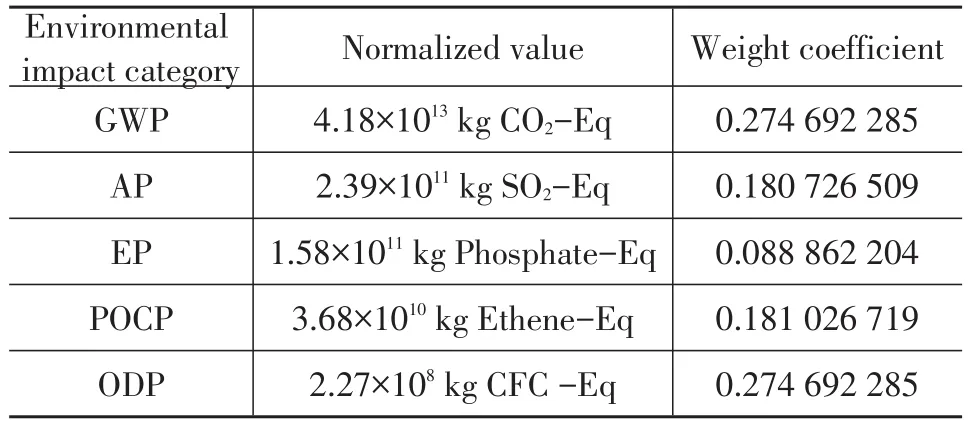
Table8.Normalized valuesand weight coefficients
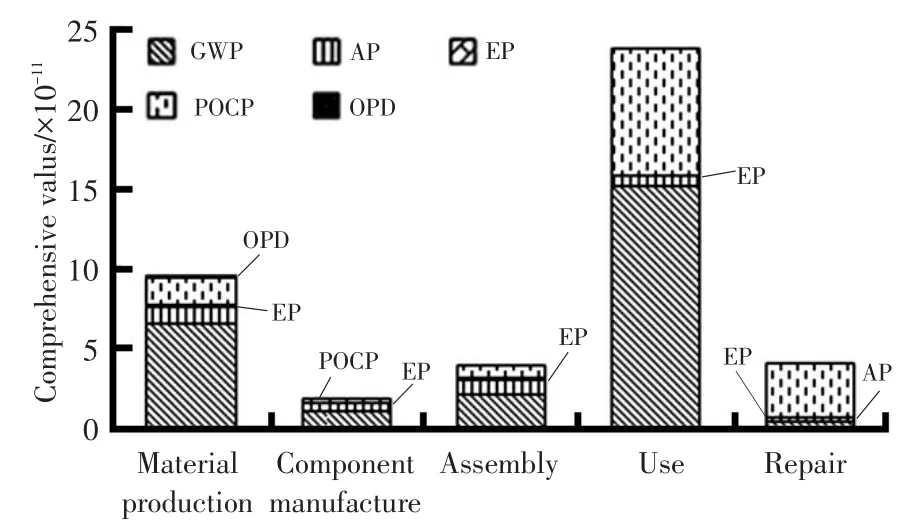
Figure 7.Life cycle comprehensive environmental impact values of different stages
We calculated the energy use and emissions of the Prius PHEV during five life cycle phases including material production,component manufacture,assembly,use phase and repair phase.The results revealed that the use phase accounts for a majority of energy use and emissions,which result from the mass amounts of fuel combustion and electricity generation for charging the batteries.In addition,mineral resources consumption are dominated by material production.So it is necessary to reduce the emissions of fuel combustion and electricity generation and have a higher use of recycled materials.
Because of data limitations,the life cycle analysis of component manufacture is not completed. Many components which was not considered can be investigated with GaBi modeling in future.In addition,the results are rough becauseofasubstituteforunavailable data.Moreover,Transports,disposal and recycling were not considered owing to the complexity,and those phases can be explored further based on GaBi modeling.
1 Lave L B,MacLean H L.An Environmental-Economic Evaluation of Hybrid Electric Vehicles:Toyota’s Prius vs.itsConventionalInternalCombustion Engine Corolla.Transportation Research Part D,2002(7):155~162.
2 Casals L C,Martinez-Laserna E,Garcla B A,et al.Sustainability Analysis of the Electric Vehicle Use in Europe for CO2Emissions Reduction:A Review.Journal of Cleaner Production,2016,127:425~437.
3 Yuksel T,Tamayao M A M,Hendrickson C,et al.Effect of regional grid mix,driving patterns and climate on the comparative carbon footprint of gasoline and plug-in electric vehicles in the United States.Environmental Research Letters,2016,11(4):1~13.
4 Li Juan.Life Cycle Assessment and Analysis between Power System ofGasCarand Battery Electric Vehicles:[dissertation].Changsha:Hunan University,2014.
5 Li Shuhua.Life Cycle Assessment and Environmental Benefits AnalysisofElectric Vehicles:[dissertation].Changchun:Jilin University,2014.
6 Burnham A,Wang M,Wu Y.Development and Application of GREET 2.7-The Transportation Vehicle-Cycle Model.Chicago:Argonne National Laboratory,2006.
7 Zhang Lei.Life Cycle Assessment of Electric Vehicle Based on GaBi4:[dissertation].Hefei: HeFei University of Technology,2011.
8 Chen Y,Yang Y,Li X,etal.Life Cycle Resource Consumption of Automotive Power Seats.International Journal of Environmental Studies,2014,71(4):449~462.
9 Samaras C,Meisterling K.Life Cycle Assessment of Greenhouse Gas Emissions from Plug-in Hybrid Vehicles:Implications for Policy. Environmental Science amp;Technology,2008,42(9):3170~3176.
10 Papasavva S,Kia S,Claya J,etal.Life Cycle Environmental Assessment of Paint Processes.Journal of Coatings Technology,2002,74(925):65~76.
11 Deng N,Wang X.Life Cycle Assessment.Beijing:Chinese Chemical Industry Press,2003.
(Editor Hu Pan)
Writingmark:A ArticleID:1000-3703(2017)09-0020-06
*Foundation item:The Fund for Young Scholars by Ministry of Education(16YJCZH008);Shaanxi Natural Science Basic Research Fund for Young Scholars(2017JQ7003);Shaanxi Social Science Fund(2016R027);The Fundamental Research Funds for the Central Universities(310822171001).
Hu Xu(1993—),male,research on life cycle assessment of automobile,vibration and noise control,huxu_1993@163.com.
date:2017-07-28.

