
Application of SWAT99.2 to sensitivity analysis of water balance components in unique plots in a hilly region
2017-11-20 05:25:12JunfengDaiJiazhouChenGuoanLuLarryBrownLeiGanQinxueXu
Water Science and Engineering 2017年3期
Jun-feng Dai*,Jia-zhou Chen,Guo-an Lu¨,Larry C.Brown,Lei Gan,Qin-xue Xu
aCollege of Environmental Science and Engineering,Guilin University of Technology,Guilin 541004,China bCollege of Resources and Environment,Huazhong Agricultural University,Wuhan 430070,China
cKey Laboratory of Karst Dynamics by MLR&Guangxi of PRC,IRCK by UNESCO,Guilin 541004,China dDepartment of Food,Agricultural and Biological Engineering,Ohio State University,Columbus 43210,USA
Received 10 July 2016;accepted 11 April 2017 Available online 29 September 2017
Application of SWAT99.2 to sensitivity analysis of water balance components in unique plots in a hilly region
Jun-feng Daia,b,c,*,Jia-zhou Chenb,Guo-an Lu¨b,Larry C.Brownd,Lei Gana,c,Qin-xue Xua,c
aCollege of Environmental Science and Engineering,Guilin University of Technology,Guilin 541004,ChinabCollege of Resources and Environment,Huazhong Agricultural University,Wuhan 430070,China
cKey Laboratory of Karst Dynamics by MLR&Guangxi of PRC,IRCK by UNESCO,Guilin 541004,ChinadDepartment of Food,Agricultural and Biological Engineering,Ohio State University,Columbus 43210,USA
Received 10 July 2016;accepted 11 April 2017 Available online 29 September 2017
Although many sensitivity analyses using the soil and water assessment tool(SWAT)in a complex watershed have been conducted,little attention has been paid to the application potential of the model in unique plots.In addition,sensitivity analysis of percolation and evapotranspiration with SWAT has seldom been undertaken.In this study,SWAT99.2 was calibrated to simulate water balance components for unique plots in Southern China from 2000 to 2001,which included surface runoff,percolation,and evapotranspiration.Twenty-one parameters classi fied into four categories,including meteorological conditions,topographical characteristics,soil properties,and vegetation attributes,were used for sensitivity analysis through one-at-a-time(OAT)sampling to identify the factor that contributed most to the variance in water balance components.The results were shown to be different for different plots,with parameter sensitivity indices and ranks varying for different water balance components.Water balance components in the broad-leaved forest and natural grass plots were most sensitive to meteorological conditions,less sensitive to vegetation attributes and soil properties,and least sensitive to topographical characteristics.Compared to those in the natural grass plot,water balance components in the broad-leaved forest plot demonstrated higher sensitivity to the maximum stomatal conductance(GSI)and maximum leaf area index(BLAI).
©2017 Hohai University.Production and hosting by Elsevier B.V.This is an open access article under the CC BY-NC-ND license(http://creativecommons.org/licenses/by-nc-nd/4.0/).
Forest and grass plots;Water balance;Sensitivity analysis;Soil and water assessment tool(SWAT);One-at-a-time(OAT)method
1.Introduction
The movement of water in forest and grass systems strongly depends on weather conditions,topographical characteristics,soil properties,and vegetation attributes.Natural watersheds generally have a high degree of variability and complexity in soil,land cover,topographical characteristics,and other factors(Lenhart et al.,2002).In a large and complex watershed,overlay effects caused by diverse characteristics of different sub-basins may occur.However,this complexity does not occur in individual plots because the spatial variability of parameters is reduced to a relative minimum.Compared with a large watershed,water modeling in an individual plot has relatively fewer uncertainties in model inputs.Therefore,parameter determination,estimation,and calibration are much easier for individual plots.
Hydrological modeling is an important tool for understanding hydrological processes and evaluating the in fluence of various parameter inputs on water balance components.The soil and water assessment tool(SWAT)is a model that can be used to simulate hydrological processes on both small and large scales.Severalversionshavebeenreleased.Ahmadetal.(2002)carried out a study to calibrate and evaluate the subsurface drainage component of SWAT99.2 for three management systems in research plots with an area of 0.004 km2near Nashua,Iowa.In the study of Beulke et al.(2001),the predictive ability of four preferential flow models without calibration,i.e.,CRACK-NP,MACRO/MACRO_DB,PLM,and SWAT,was evaluated against the discharge rate at the monitoring points and associated concentrations of isoproturon within a highly structured and heterogeneous clay soil in the south of England.The research site was comprised of 20 hydrologically isolated plots with an area of 0.002 km2.Chanasyk et al.(2003)used SWAT99.2 to simulate the runoff from small grassland watersheds with three grazing intensities at the Stavely Research Station in Alberta,Canada.The area of the watersheds ranged from 0.0152 km2to 0.0226 km2.Additionally,a daily pro file of soilwater wassimulatedwithSWAT99.2intheaforementioned watersheds by Mapfumo et al.(2004).
Sensitivity analysis allows for better understanding and estimation of model parameters,leading to a reduction of uncertainty in a model.Sensitivity analysis is also necessary for studying the in fluence of various parameters on the variability of water balance prediction.A model needs to be calibrated with speci fic input parameters for formal application(Hamby,1994;Saltelli et al.,2005).The one-at-a-time(OAT)technique is a very useful tool for hydrological models such as the SWAT model(van Griensven et al.,2006),which allows for sensitivity analysis of a large number of parametersatlow computationalcosts.Someprevious research has addressed the input parameter sensitivity of SWAT in a complex sub-watershed and catchment.However,the input parameter sensitivity of SWAT in a unique plot has seldom been addressed.When SWAT is applied in a unique plot,the plot can be considered only one sub-basin with one hydrological response unit(HRU).Therefore,if any of the input parameters is modi fied,the whole plot will be affected.
In addition,many sensitivity analyses of runoff in the SWAT model have been carried out,while analyses of percolation and evapotranspiration in the model have been extensively neglected.Different approaches and regions indicate different results for the most sensitive parameters,suggesting that site-speci fic sensitivity analysis is required before using the model(Feyereisen et al.,2007).
In this study,SWAT99.2,which is suitable for water balance simulation on a small scale,was used for sensitivity analysis of water balance components in a unique broadleaved forest and a natural grass plot in a hilly region in Southern China.The objectives of this study were to determine the most sensitive parameters for surface runoff,percolation,and evapotranspiration in the hilly plots,and investigate different performances of those parameters in the plots.
2.Methods
2.1.Study area
Thestudysites,abroad-leavedforestandanaturalgrassplots,are located at the Experimental Station of Red Earth Ecology of theChineseAcademyofScienceinJiangxiProvince,China.The independent arti ficial plots were built in 1988.These plotsare at 116°33′18′′E and 28°7′23′′N,with an area of 0.003 km2and an elevation of 48-54 m.The soil type is mainly quaternary red clay.Thegroundwatertableintheplotsis11-15m.Theareahas a subtropical monsoon climate.The mean annual temperature is 17.8°C,theannualprecipitationis approximately1785 mm,and the average annual evaporation is 1318 mm.
Closed-off management was implemented in the forest and grass plots.Only a small amount of leaf litter was removed from the plots in this experiment.A cultivation pattern was adopted in the plots without using fertilizer.The experimental station consisted of four plots.The first plot was natural grass land,naturally restored after Pinus massoniana was cut.The second plot was dominated by broad-leaved forest land,where vegetation consisted of Schima superba and Castanopsis fissa.The third plot was mixed forest land,where Q.chenil and Lespedeza bicolor were planted.The fourth plot was coniferous forest,consisting of untouched Pinus massoniana forest land.The broad-leaved forest plot and the natural grass plot were selected for sensitivity analysis using the SWAT model.Watershed attributes of the two plots are shown in Table 1.
The plots were separated by concrete barriers buried in soil,with a width of 5 cm and a height of 1 m.The four plots were relatively isolated.The water budget in each plot was gauged individually.An observation house with a pool for runoff collection was established at the exit of each plot,and an HCJ1-type water level gauge was installed in each pool.The surface runoff of each plot was calculated through continuous recording of water level change.
2.2.Model description and setup
The SWAT model is a physically based,continuous-time simulation model,operating at a daily time step(Arnold et al.,1998).The hydrological components of SWAT are comprised of surface runoff,percolation,lateral subsurfaceflow,groundwater flow,snow melt,evapotranspiration,transmission losses,and ponds.Surface runoff is calculated using a modi fied curve number technique.In this model,the soil pro file is divided into multiple layers,and soil water processes include in filtration,evaporation,plant uptake,lateral flow,and percolation through deeper layers.The percolation component of SWAT is obtained using a storage routing technique to predict flow through each soil layer in the root zone.Percolation from the bottom of the root zone recharges the shallow aquifer.Percolation and lateral subsurface flow in the soil pro file are calculated simultaneously in the model.The model computes the evaporation from soil and plants separately,as described by Ritchie(1972).Plant growth is simulated using a simpli fied erosion productivity impact calculator(EPIC)model(Williams et al.,1984).

Table 1 Watershed attributes of broad-leaved forest and natural grass plots.
Since SWAT was introduced in the early 1990s,its capabilities have greatly expanded with each updated release.SWAT2000 and the updated releases(SWAT2003,SWAT2005,SWAT2009,and SWAT2012)run through the ArcView or ArcGIS software,and can be adapted to large-scale computations.SWAT99.2 and previous releases(SWAT98.l and SWAT96.2)can be operated independently and used for both small-scale and large-scale calculations.
In this study,each plot was considered only one sub-basin,with only one HRU,homogeneous land use,and soil type,and SWAT99.2 was used to perform sensitivity analysis.The input parameters were classi fied into four categories:meteorological conditions,topographical characteristics,soil properties,and vegetation attributes.Daily rainfall was obtained from the meteorological station near the plots.Daily temperature,wind speed,solar radiation,and dew point temperature were calculated using the weather generator module in SWAT based on the monthly statistical data from the meteorological station.Topographical parameters such as plot area,steepness,and main channel length were determined from the contour map using the Arcview software.Soil properties including bulk density,organic carbon content,saturated hydraulic conductivity,available water capacity,and clay-siltsand content of soil layers were obtained through laboratory experiments.Vegetation attributes of the plots were obtained by investigation and estimated using default values in SWAT99.2.The SCS runoff curve number(CN2)and other parameters were chosen based on the suggested values in the Soil and Water Assessment Tool User's Manual(Neitsch et al.,1999).Details about the input parameters are shown in Table 2.
2.3.Model performance
Daily and monthly surface runoff in the year 2000 was used to calibrate the model,and the data in 2001 were used to evaluate the model.SWAT99.2 suggests a very speci fic method for calibration of surface runoff.The SCS runoff curve number,with the original values of 71 and 65 for the natural grass and broad-leaved forest plots,respectively,was adjusted until the surface runoff was deemed acceptable.If the surface runoff values were still not reasonable after the adjustment of the curve number,the available water capacity of the soil layer(SOL_AWC)and soilevaporation compensation factor(ESCO)were adjusted.
The SOL_AWC value of each soil layer was determined precisely in the laboratory using the pressure membrane meter method,without need of calibration.The default value for ESCO was set at 0.95 in SWAT99.2.The values of CN2indifferent plots were calibrated,with values of 68 and 63 for the natural grass and broad-leaved forest plots,respectively.

Table 2 Input parameters used for sensitivity analysis of water balance prediction.
Fig.1 compares the observed and simulated monthly runoff.Both the broad-leaved forest plot and the natural grass plot show good agreement between the observed and simulated values for 2000 and 2001.
The performance of the model was evaluated using the Nash-Sutcliffe ef ficiency coef ficient (Ens) (Legatesand McCabe,1999)and the coef ficient of determination (R2)(Krause et al.,2005),which are calculated as follows:

where Yiand Xiare the simulated and observed values,respectively,andY and X are the means of the simulated and observed values,respectively.
The model performance showed that Enswas between 0.63 and 0.76 and R2was between 0.73 and 0.93 at daily and monthly time scales(Table 3).These results indicate that high ef ficiency of the model was achieved,and that the SWAT model was capable of analyzing water balance components in the broad-leaved forest and natural grass plots.
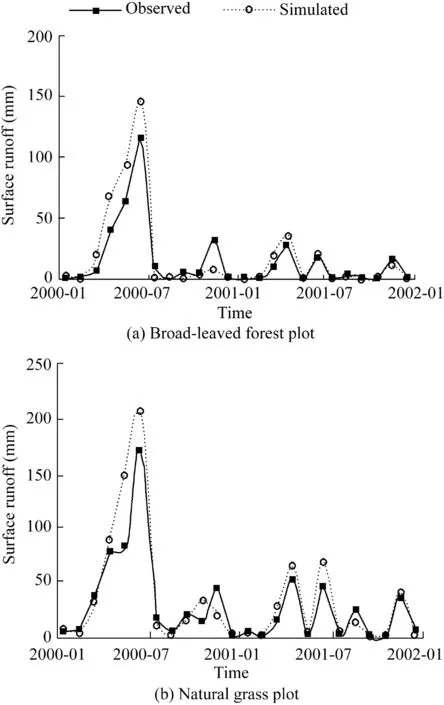
Fig.1.Observed and simulated monthly surface runoff in broadleaved forest and natural grass plots for 2000-2001.
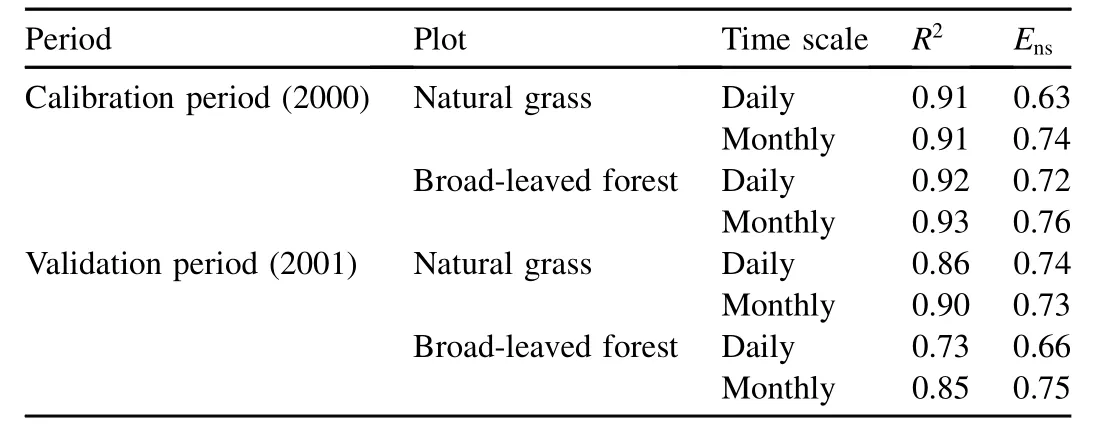
Table 3 Evaluation of simulation ef ficiency.
2.4.Parameters selected for sensitivity analysis
There are a large number of parameters in the SWAT model.Some of these parameters vary for different sub-basins.Land use and soil types add more complexities to the parameters.Even so,only some of the parameters actually affect the model output in some basins.SWAT99.2 has not yet been implemented for an automatic routine for sensitivity analysis.Thus,for the forest and grass plots,the sensitive parameters of the model were assessed through manual sensitivity analysis.The sensitivity analysis was performed with the calibrated model in this study,meaning that the results presented are actual sensitivities(Woznicki and Nejadhashemi,2012)of water balance components to model parameters in the forest and grass plots,rather than sensitivities from a theoretical perspective.
A set of 21 model parameters was employed in this sensitivity analysis to obtain surface runoff,percolation,and evapotranspiration processes that are typically represented by SWAT.Table 2 gives a complete de finition and categorization of these parameters.They were selected considering the conditions of the study area and with reference to previous published studies.The default values of some of the parameters were based on a list provided by the Soil and Water Assessment Tool User's Manual(Neitsch et al.,1999).
2.5.One-at-a-time method
Parameter sensitivity analysis for model evaluation can be performed by a variety of techniques(Helton,1993).There are generally two kinds of sensitivity analysis methods:the local and global ones.The local sensitivity is concerned with the impact of changes in a particular parameter value on the model output,while the global sensitivity is used to analyze the complete parameter space simultaneously(van Griensven et al.,2006).Local sensitivity analysis is concentrated on the local impact of a parameter on the model,and it is therefore suitable for investigation around speci fic points of interest or optimization techniques.
The most widely used local sensitivity analysis technique is the OAT method.Sensitivity analysis with the OAT method has a long history in engineering practice.This approach,proposed by Morris(1991),integrates the global and local analyses.In the OAT method,the impact of each parameter on the model performance is analyzed by changing its value independently.The method can clearly attribute output changes of the model to the changes of speci fic parameters.Consequently,the results are quantitative and exclusive.In this study,OAT local variations around some base points were considered for sensitivity analysis with the SWAT model.This was performed by varying speci fic parameters within their allowable ranges.
2.6.Calculation of sensitivity index
Sensitivity is measured as the response of an output variable to the change in an input parameter,where greater changes in output variables correspond to greater sensitivities.Sensitivity analysis provides a comprehensive understanding of the relationships between the model output variables and input parameters,whichcanalsobeconsideredtheratioofthechangein anoutputvariabletothatinaninputparameter(McCuen,1973).
Mathematically,the dependence of a variable y on a parameter x is expressed by a partial derivative∂y/∂x,and this expression can be numerically approximated by a finite difference.It is assumed that y0is the model output,calculated with an initial value x0of parameter x.This initial parameter value is varied by Δx, yielding x1=x0-Δx and x2=x0+Δx,and leading to the corresponding outputs y1and y2,respectively(Lenhart et al.,2002).The finite approximation of the partial derivative ∂y/∂x can be expressed as

To achieve a dimensionless sensitivity index I,the partial derivative is normalized.The expression for I can be de fined as

The index shows whether the model output reacts directionally to the change in an input parameter,and the absolute value of I indicates the relative importance of parameter x to the model output y.
In this study,21 separate input parameters considered varied twice by increments of±Δx.Δx was de fined as 50%of the initial value x0,and the value of x was restricted to the physical range of the parameter.
3.Results and discussion
3.1.Sensitivity analysis of water balance components in broad-leaved forest plot
Table 4 lists the sensitivity indices and ranks of input parameters based on the model performance with regard to surface runoff,percolation,and evapotranspiration in the broad-leaved forest plot.For surface runoff,the most sensitive parameters were CN2and PCP,followed by TMP,GSI,and BLAI according to the absolute values of I.Percolation was most sensitive to PCP,CN2,TMP,GSI,and SOL_Z.TMP,GSI,BLAI,PCP,and CN2were the top five sensitive parameters for evapotranspiration.
Of the water balance components in the broad-leaved forest plot in this study,surface runoff was shown to be relatively insensitive to CH_N,BIO_E,OV_N,ZMX,and SOL_ALB.Percolation from the root zone was least sensitive to CH_N,SLOPE,ZMX,BIO_E,and OV_N.For evapotranspiration,the least sensitive parameters were CH_N,SLOPE,OV_N,CH_K,and ZMX.
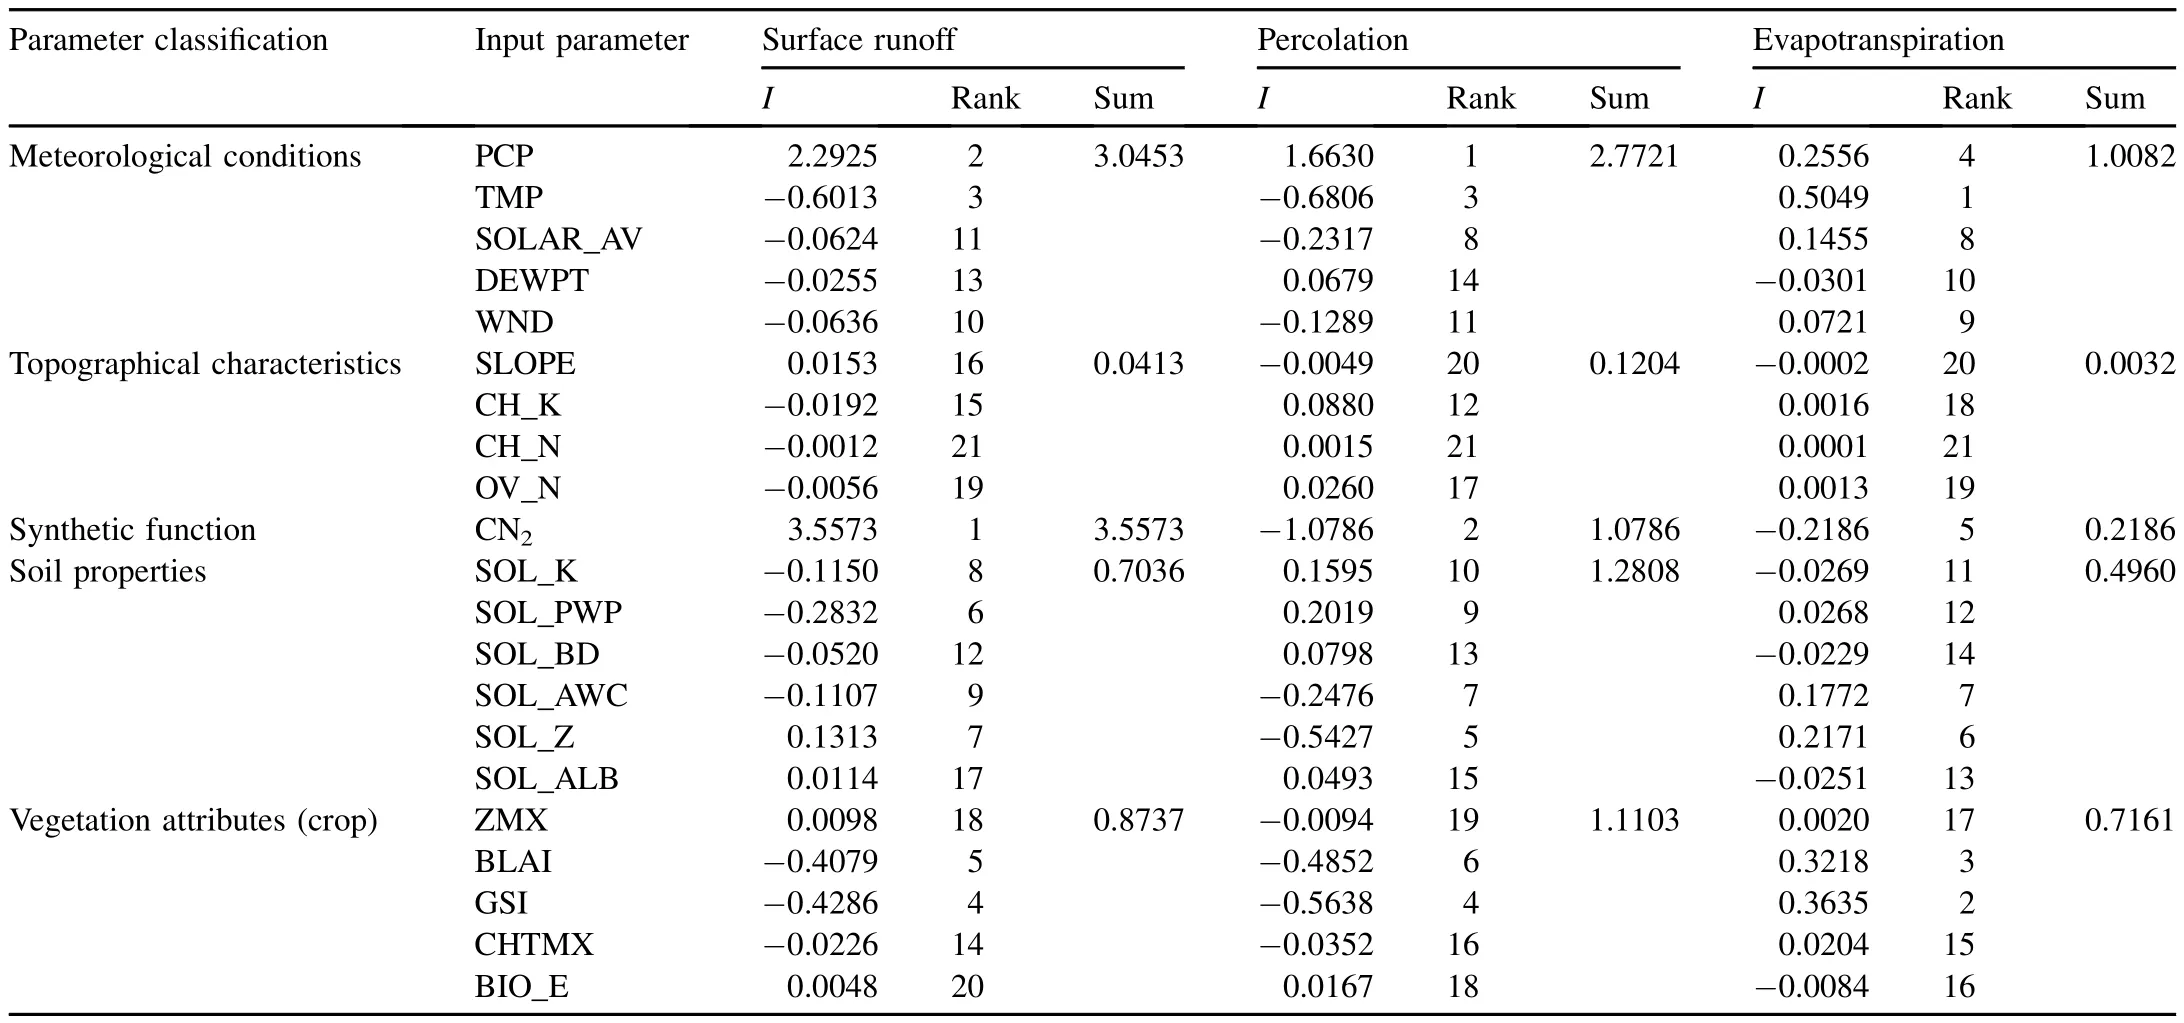
Table 4 Parameter sensitivity indices with regard to water balance components in broad-leaved forest plot.
CN2is a synthetic function of the soil's permeability,land use,and slope.Soil properties,vegetation attributes,and topographical characteristics all contribute to the sensitivity of CN2with regard to water balance components.However,it is very dif ficult to precisely identify the in fluence of individual parameters on CN2.In this study,it was assumed that the soil,vegetation,and topographical parameters equally contributed to the sensitivity of CN2.For surface runoff and evapotranspiration in the broad-leaved forest plot,the most sensitive factor was meteorological conditions,followed by vegetation attributes and soil properties,and topographical characteristics were the least sensitive factor.For percolation from the root zone,the most sensitive factor was also the meteorological conditions,followed by soil properties and vegetation attributes,with the topographical characteristics being the most insensitive factor.
3.2.Sensitivity analysis of water balance components in natural grass plot
The sensitivity indices and ranks of input parameters with regard to water balance components in the natural grass plot are shown in Table 5.For surface runoff and percolation,the top five sensitive parameters were CN2,PCP,SOLAR_AV,SOL_PWP,and TMP.For evapotranspiration,SOLAR_AV,TMP,CN2,GSI,and SOL_ALB were the top five sensitive parameters.
Of the 21 selected parameters, five parameters showed the smallest effects on monthly surface runoff simulation in the natural grass plot.These parameters included ZMX,CHTMX,CH_N,OV_N,and DEWPT.Percolation was least sensitive to SLOPE,CHTMX,CH_N,ZMX,and WND.For evapotranspiration,the five least sensitive parameters were OV_N,CH_K,SOL_K,SLOPE,and SOL_PWP.
Table 5 shows that surface runoff and percolation were most sensitive to meteorological conditions,less sensitive to soil properties and vegetation attributes,and least sensitive to topographical characteristics.With regard to evapotranspiration,the most sensitive factor was meteorological conditions,followed by vegetation attributes and soil properties.Again,topographical characteristics were the least insensitive factor.
3.3.Discussion
Prior sensitivity analysis indicates that water balance components in some regions are more sensitive to some parameters than others(Spruill et al.,2000;Lenhart et al.,2002;Feyereisen et al.,2007;Ndomba et al.,2010).Furthermore,in a natural watershed,changes in soil properties,topographical characteristics,or land cover only affect a small part of the watershed area.In a larger and more heterogeneous natural watershed,compounded effects of different factors may occur(Lenhart et al.,2002).However,for a small unique plot,the phenomenon may not occur because each plot is parameterized with only one type of topographical characteristics,soil properties,or land cover.Therefore,the experimental design and analytical method used in this study can clearly reveal the sensitive parameters for water balance components,and can easily identify the differences between the parameters for the plots.Based on the results of this study,the most sensitive parameters for water balance components were addressed.Water balance components were relatively sensitive to CN2,PCP,SOLAR_AV,TMP,GSI,BLAI,and SOL_PWP in the broad-leaved forest and natural grass plots in the hilly region.
Further analysis showed that the sensitivity index or sensitivity rank of individual parameters varied for different water balance components and different plots.For example,PCP was ranked second with regard to surface runoff in the broad-leavedforest and natural grass plots.However,for percolation,it was ranked second in the natural grass plot and first in the broadleaved forest plot.In contrast,PCP was ranked tenth with regard to evapotranspiration in the natural grass plot and fourth in the broad-leaved forest plot.This result illustrates that the importance of parameters depends on vegetation attributes,soil properties,and topographical characteristics.
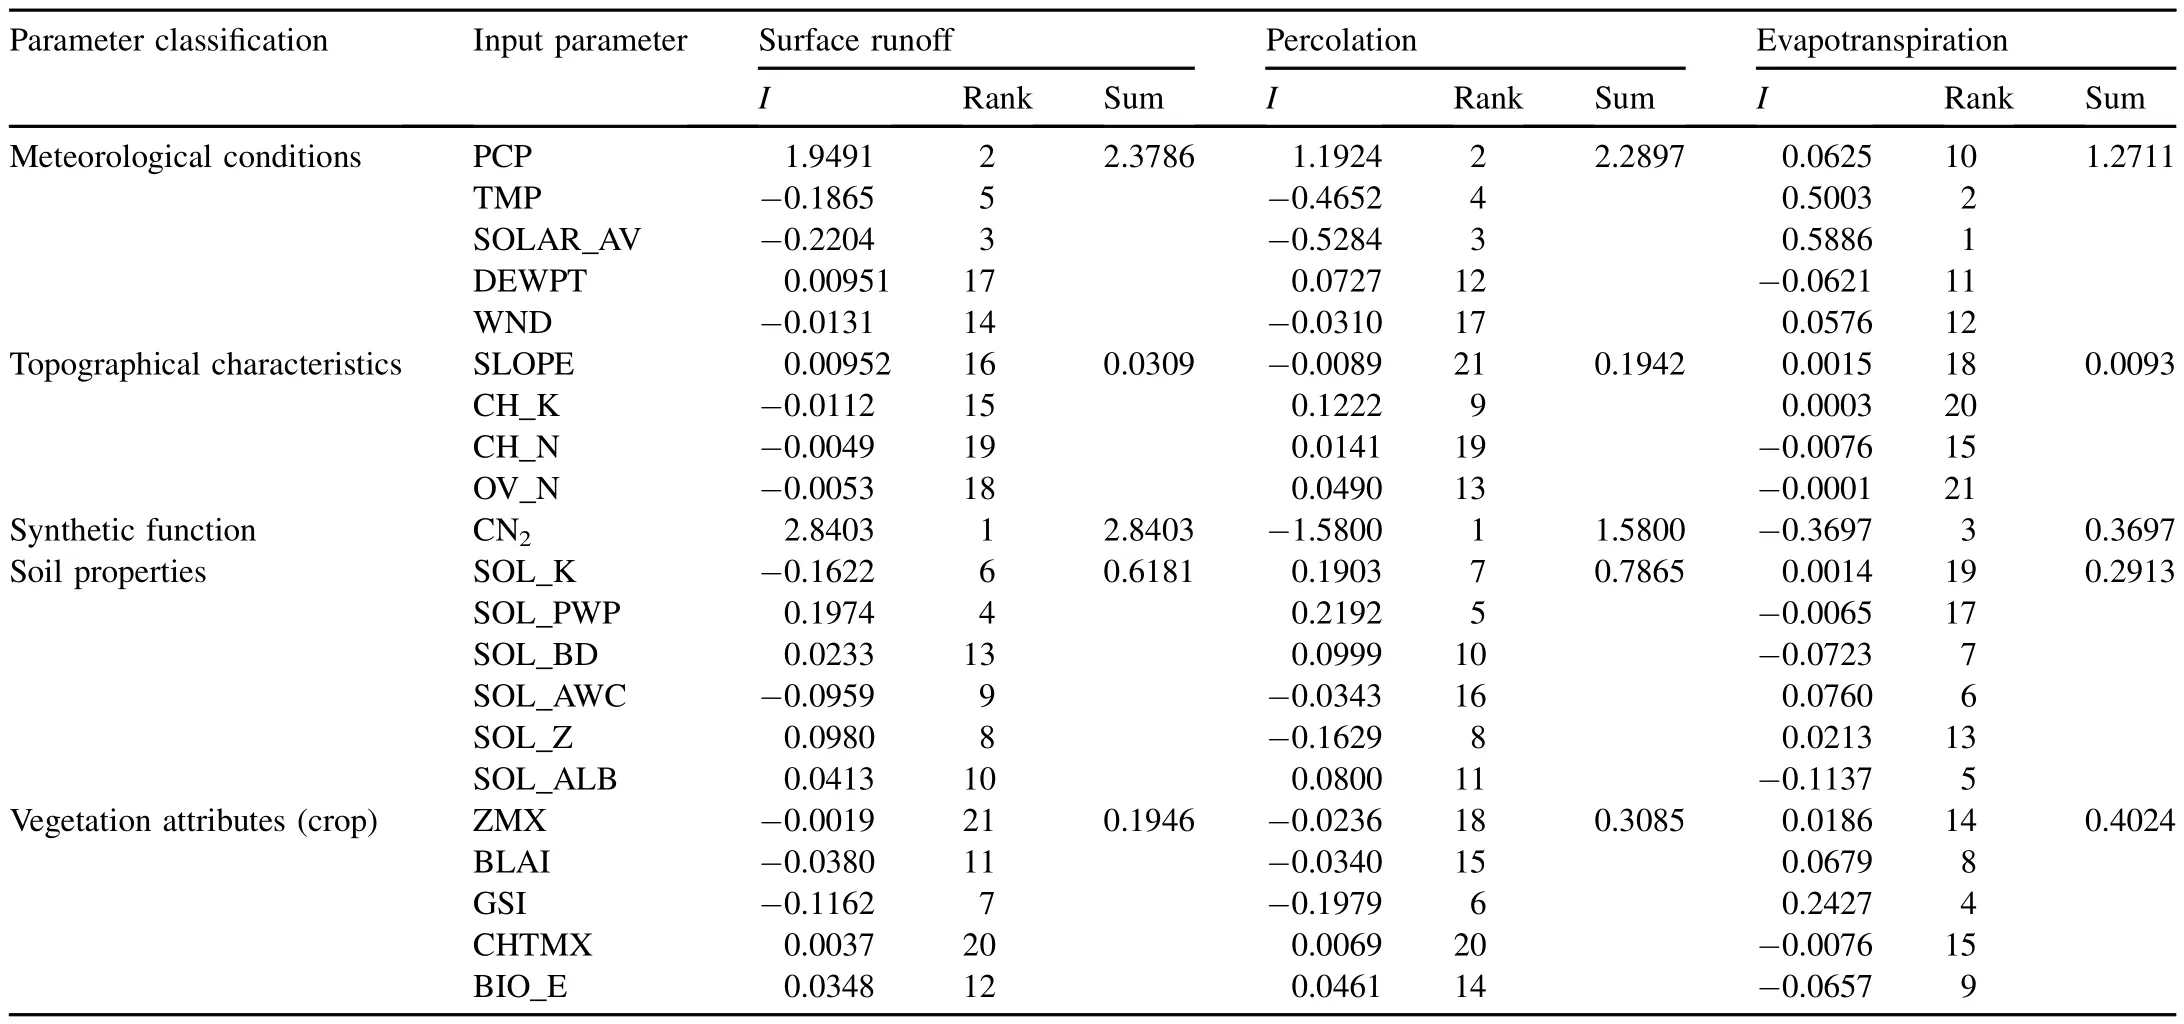
Table 5 Parameter sensitivity indices with regard to water balance components in natural grass plot.
It is worth noting that when a parameter has an in fluence on a water balance component,it may also affect others.For example,the increase of temperature or solar radiation resulted in an increase of evapotranspiration,which correspondingly decreased the surface runoff and percolation.
We can also find clear differences between the sensitive parameters for different water balance components in a plot.In the broad-leaved forest and natural grass plots,for surface runoff,the two most sensitive parameters were CN2and PCP.Also,percolation was most sensitive to PCP and CN2.However,SOLAR_AV and TMP were the most sensitive parameters for evapotranspiration in the broad-leaved forest and natural grass plots,respectively.
Water balance components in the natural grass plot were mostsensitivetoCN2,PCP,SOLAR_AV,TMP,and SOL_PWP,while in the broad-leaved forest plot,CN2,PCP,TMP,GSI,and BLAI achieved the highest ranks,showing the differences of parameter sensitivities between the broadleaved forest and natural grass plots,which stands in agreement with van Griensven et al.(2006).In van Griensven et al.(2006),the monitoring results of the amount and quality of water from interior monitoring points show different ranks of sensitive parameters,dependent on the physical characteristics of sub-basins within a watershed.
Results of sensitivity analysis for a plot cannot be directly applied to another plot with different vegetation attributes,even though theyarelocatedinthe same area.Inthis study,compared with the natural grass plot,water balance components in the broad-leaved forest plot were more sensitive to vegetation parameters such as GSI and BLAI.This can be explained by the variation in vegetation attributes between the two plots.In particular,the greater evapotranspiration in the broad-leaved forest plot played a critical role in the water balance.The parameter sensitivity of the SWAT model depends on climate,land use,soil type,and topographical characteristics,meaning that results of sensitivity analysis are not transferable between differentplots.Therefore,eachstudycatchmentrequiresitsown sensitivity analysis(Schmalz and Fohrer,2009).
4.Conclusions
The red soil hilly region in this study was characterized by speci fic properties,such as abundant precipitation,high temperature,intense solar radiation,low permeability,gentle slopes,subdued topography,and a low water table.For water balance components in the broad-leaved forest and natural grass plots in this region,the most sensitive factor was shown to be meteorological conditions,followed by vegetation attributes and soil properties,and the least sensitive factor was shown to be topographical characteristics.
The sensitivity index or sensitivity rank of a parameter varied for different water balance components and different plots.Compared with the natural grass plot,water balance components in the broad-leaved forest plot were more sensitive to vegetation parameters,such as GSI and BLAI,but they were relatively insensitive to BIO_E.
Results of parameter sensitivity analysis are not transferable between different plots.Each study area requires its own parameter sensitive analysis.
Acknowledgements
We would like to thank Huazhong Agricultural University and the Experimental Station of Red Earth Ecology of the ChineseAcademyofScience,wherewemeasuredandobtained datafordrivingandcalibratingtheSWATmodel.Wealsothank reviewers for their constructive comments and suggestions.
Ahmad,K.,Gassman,P.W.,Kanwar,R.,2002.Evaluation of the tile flow component of SWAT model under different management systems.In:Symposium of 2002 ASAE Annual Meeting.American Society of Agricultural and Biological Engineers,St.Joseph.https://doi.org/10.13031/2013.10416.
Arnold,J.G.,Srinivasan,R.,Muttiah,R.S.,Williams,J.R.,1998.Large area hydrologic modeling and assessment,Part I:Model development.J.Am.WaterResour.Assoc.34(1),73-89.https://doi.org/10.1111/j.1752-1688.1998.tb05961.x.
Beulke,S.,Brown,C.D.,Dubus,I.G.,Harris,G.,2001.Evaluation of uncalibrated preferential flow models against data for isoproturon movement to drains through a heavy clay soil.Pest Manag.Sci.57,537-547.https://doi.org/10.1002/ps.324.
Chanasyk,D.S.,Mapfumo,E.,Willms,W.,2003.Quanti fication and simulation of surface runoff from fescue grassland watershed.Agric.Water Manag.59(2),137-153.https://doi.org/10.1016/S0378-3774(02)00124-5.
Feyereisen,G.W.,Strickland,T.C.,Bosch,D.D.,Sullivan,D.G.,2007.Evaluation of SWAT manual calibration and input parameter sensitivity in the little river watershed.Trans.ASABE 50(3),843-855.https://doi.org/10.13031/2013.23149.
Hamby,D.M.,1994.A review of techniques for parameter sensitivity analysis of environmental models.Environ.Monit.Assess.32(2),135-154.https://doi.org/10.1007/BF00547132.
Helton,J.C.,1993.Uncertainty and sensitivity analysis techniques for use in performance assessment for radioactive waste disposal.Reliab.Eng.Syst.Saf.42(2-3),327-367.https://doi.org/10.1016/0951-8320(93)90097-I.
Krause,P.,Boyle,D.P.,B¨ASE,F.,2005.Comparison of different ef ficiency criteria for hydrological model assessment.Adv.Geosci.5,89-97.https://doi.org/10.5194/adgeo-5-89-2005.
Legates,D.R.,McCabe,G.J.,1999.Evaluating use of “goodness of fit”measures in hydrologic and hydroclimatic model validation.Water Resour.Res.35(1),233-241.https://doi.org/10.1029/1998WR900018.
Lenhart,T.,Eckhardt,K.,Fohrer,N.,Frede,H.G.,2002.Comparison of two different approaches of sensitivity analysis.Phys.Chem.Earth 27(9-10),645-654.https://doi.org/10.1016/S1474-7065(02)00049-9.
Mapfumo,E.,Chanasyk,D.S.,Willms,W.D.,2004.Simulating daily soil water under foothills fescue grazing with the soil and water assessment tool model(Alberta,Canada).Hydrol.Process.18(15),2787-2800.https://doi.org/10.1002/hyp.1493.
McCuen,R.H.,1973.The role of sensitivity analysis in hydrologic modeling.J.Hydrol.18(1),37-53.https://doi.org/10.1016/0022-1694(73)90024-3.
Morris,M.D.,1991.Factorial sampling plans for preliminary computational experiments.Tecnometrics 33(2),161-174.https://doi.org/10.1080/00401706.1991.10484804.
Ndomba,P.M.,Magoma,D.,Mtalo,F.W.,Nobert,J.,2010.Application of SWAT in natural wetland catchments:A case of Rugezi Catchment in Rwanda.Nile Water Sci.Eng.J.3(3),1-13.
Neitsch,S.L.,Arnold,J.G.,Williams,J.R.,1999.Soil and Water Assessment Tool User's Manual(Version 99.2).Grassland,Soil,and Water Research Laboratory,Agricultural Research Service,Temple.
Ritchie,J.T.,1972.Model for predicting evaporation from a row crop with incomplete cover.Water Resour.Res.8(5),1204-1213.https://doi.org/10.1029/WR008i005p01204.
Saltelli,A.,Ratto,M.,Tarantola,S.,Campolongo,F.,2005.Sensitivity analysis for chemical models.Chem.Rev.105(7),2811-2828.https://doi.org/10.1021/cr040659d.
Schmalz,B.,Fohrer,N.,2009.Comparing model sensitivities of different landscapes using the ecohydrological SWAT model.Adv.Geosci.21,91-98.https://doi.org/10.5194/adgeo-21-91-2009.
Spruill,C.A.,Workman,S.R.,Taraba,J.L.,2000.Simulation of daily and monthly stream discharge from small watershed using the SWAT model.Trans.ASAE 43(6),1431-1439.https://doi.org/10.13031/2013.3041.
van Griensven,A.,Meisner,T.,Grunwald,S.,Bishop,T.,Diluzio,M.,Srinvasan,R.,2006.A global sensitivity analysis tool for the parameters of multi-variable catchment models.J.Hydrol.324(1-4),10-23.https://doi.org/10.1016/j.jhydrol.2005.09.008.
Williams,J.R.,Jones,C.A.,Dyke,P.T.,1984.A modeling approach to determining the relationship between erosion and soil productivity.Trans.ASAE 27(1),129-144.https://doi.org/10.13031/2013.32748.
Woznicki,S.A.,Nejadhashemi,A.P.,2012.Sensitivity analysis of best management practices under climate change scenarios.J.Am.Water Resour.Assoc.48(1),90-112.https://doi.org/10.1111/j.1752-1688.2011.00598.x.
This work was supported by the National Natural Science Foundation of China(Grants No.51569007 and 41301289),the Natural Science Foundation of Guangxi Province,China(Grant No.2015GXNSFCA139004),the Fund of the IRCK by UNESCO(Grant No.KDL201601),and the Project of High Level Innovation Team and Outstanding Scholar in Guangxi Colleges and Universities(Grant No.002401013001).
*Corresponding author.
E-mail address:whudjf@163.com(Jun-feng Dai).
Peer review under responsibility of Hohai University.
 Water Science and Engineering2017年3期
- Water Science and Engineering的其它文章
- Simulation of flow pattern at rectangular lateral intake with different dike and submerged vane scenarios
- Experimental and theoretical study of coupled in fluence of flow velocity increment and particle size on particle retention and release in porous media
- Flow patterns and critical criteria of thermally strati fied shear flow in braided rivers
- Fate of nitrogen in subsurface in filtration system for treating secondary ef fluent
- Assessment of future climate change impacts on hydrological behavior of Richmond River Catchment
- Numerical modeling of solute transport in deformable unsaturated layered soil