Technology of Intelligent Driving Radar Perception Based on Driving Brain
Hongbo Gao, Xinyu Zhang, Jianhui Zhao, and Deyi Li
TechnologyofIntelligentDrivingRadarPerceptionBasedonDrivingBrain
Hongbo Gao, Xinyu Zhang*, Jianhui Zhao, and Deyi Li
Radar is an important sensor to realize intelligent driving environment perception, enabling the detection of static obstacles and dynamic obstacles, and the tracking of a dynamic obstacle. The models, quantities and installing location of the platform radar sensors as well as the information processing modules differ from each other on different intelligent driving testing platforms, resulting in different quantities and interfaces on the intelligent driving system. In this paper, we build the software architecture of intelligent driving vehicle based on driving brain which is used to adapt to different types of radar sensors and use the variable granularity road ownership radar for radar information fusion. Under the condition of complete driving information, increasing or reducing the number of radar sensors and changing the radar sensor model or installing location will not affect the intelligent driving decision directly. Therefore, we meet the demands of multi-radar sensor adapting to different intelligent driving hardware testing platforms.
driving brain; intelligent driving; radar perception
1 Introduction
Early in the 1950s, the United States developed the research on an unmanned vehicle. In 1950, the United States Barrett Electronics developed the world’s first autonomous navigation vehicle[1]. The research of US unmanned vehicle originated in the US Department of Defense Advanced Research Projects Agency (DARPA), which is one of the world’s leaders in this domain. Since the mid-80s in the last century, European countries began to develop unmanned driving technology, they regarded unmanned vehicles as independent individuals and mixed these vehicles in normal traffic flow[2]. In 1987, the Prometheus plan (PROMETHEUS, Program for a European Traffic of Highest Efficiency and Unprecedented Safety) jointly participated by the Munich Federal Defense Force University, Daimler-Benz, BMW, Peugeot, Jaguar and other well-known R & D institutions and automotive companies exerted significant influences all over the world[3]. Since the 90s of last century, the Advanced Cruise-Assist Highway System Research Association (AHSRA) attached to Japan Department of Transport has set up an advanced safety vehicle (ASV) project developing unmanned driving technology research every five years[4]. Chinese unmanned driving technology research began in the late 80s of last century, and it was supported by the Chinese national “863” plan and the related research program of Chinese National Defense Science and Technology Commission[5]. Since 2008, with the support of the National Natural Science Foundation of China, China has been tackling the future challenges of smart cars. There are more and more teams participating year by year and the difficulty of the competition increases. More and more teams accomplished the competition better and better. The car enterprises gradually laid a solid foundation for introducing unmanned driving technology into domestic cars, and helping unmanned driving technology progress rapidly[6].
Intelligent driving cannot be separated from the technology of perception, the technology of perception mainly proceeds the perception of intelligent vehicle internal and external environmental information with sensors. Sensors include visual sensors, pose sensors, radar sensors etc.. Among them, the radar sensor is mainly used for static and dynamic obstacle detection, dynamic obstacle tracking, environment mapping. There is massive research work about the method of obstacle detection based on radar. By measuring the height information of the front of the autonomous vehicle, the distribution of obstacles can be determined. For example, Yuan et al. proposed a pavement extraction algorithm that can be applied to a structured and semi-structured environment for 64-wire radar[7]. Wan et al. improved the pavement detection algorithm by using the plane model of the radar and the extended Kalman filter algorithm and realized the data classification of the single-frame radar[8]. Moosmann et al. used the graph-based method to carry out the ground and obstacle division towards the 3D radar data. The experiment demonstrated that even in the curved city environment it can get better results[9]. Douillard et al. used both the mean height map and the minimum maximum height map. They segmented the ground with the mean height map. Then, the maximum and minimum grid maps were used to subdivide the obstacles. Using this HEM(Hybrid Elevation Maps) can extract the ground and get the obstacle information[10].Himmelsbach et al. used the polar coordinate grid map to represent the radar data, segmented the road through the block straight line fitting method, and did obstacle clustering through 2-dimensional connectivity analysis. The experiment demonstrated that this method can obtain a better obstacle detection effect[11]. Douillard et al. used the two-dimensional Gaussian process regression algorithm to do ground fitting and extraction of the obstacle directly on the whole map[10].
Dynamic tracking based on the radar is an important part of environmental understanding. Dynamic obstacle tracking mainly includes pedestrian tracking and vehicle tracking. For example, Lee et al. detected the position of the pedestrian by extracting the geometric characteristics of the human leg and extracted the frequency and amplitude of the leg walking through the inverted pendulum model and finally used the Kalman filter for pedestrian tracking[12].Brscic et al. used the prospect data obtained from the radar to cluster to obtain the target need to be tracked and finally used Kalman filtering for tracking[13]. Scholer et al. introduced a particle-filtered observation model to identify partially or completely obscured pedestrians and then determined the number of obstructions behind the obstacles[14]. Spinello et al. chosen the suitable hypothesis from the multi-hypothesis which was developed by the top-down classifier and the bottom-top detector, then used the multi-objective and multi-hypothesis tracking method to perform pedestrian tracking[15]. Navarro-Serment et al. used the ground estimation algorithm from the three-dimensional radar to get the ground and then calculated SOD characteristics according to the height of between data point and the ground, and finally used Kalman filter to do pedestrian tracking[16]. Petrovskaya et al.used the vehicle observation model to sample the importance to obtain the evaluation of the candidate vehicle, and then the particle filter algorithm was used to track the multi-vehicle[17].
The three-dimensional reconstruction based on radar and SLAM research has made a series of progress and results. For example, Wang et al. used the SLAM technique of extended Kalman filtering, extracted the linear feature from the original radar data, and performed the threshold filtering towards the observation of linear characteristic according to the data fusion technique. He regarded weighted Euler distance as observation and the distance measurement between observations was used to construct the correlation matrix. Then he matched the characteristic line observation with the forecast using the rule of minimizing the total distance[18]. Vivet and Pathak et al. summarized the application examples of LIDAR in 3D reconstruction and SLAM[19,20]. Park et al. achieved the UGV positioning using the method which they firstly aligned two frames of 64-line radar data and then fused the digital surface model(DSM)[21].Wu et al. proposed an adaptive threshold method based on the integral graphics to compress the redundant data and retained many three-dimensional object edge information for the reconstruction of 3D scenes[22]. Lin et al. proposed to use the worst neglect method ICP and feature method ICP to reconstruct the teaching building and the surrounding environment, and obtained the precise environment model[23].Kurniawati et al. used the original ICP algorithm for 64-line radar data without using the positioning sensor, and did a three-dimensional reconstruction of objects on the surface of water[24].
Radar-based environmental awareness technology is mainly focused on road detection, static obstacle detection, and environmental modeling. Intelligent vehicle sensor configuration is the technical basis of perceiving the surrounding environment and obtaining their own states. It is also the most costly and the most significant part for the test platform. Due to different types of vehicle platform mechanical structure, the intelligent vehicle sensor selection and installing location are also different, there is no unified program. Some research teams tend to complete environmental awareness relying on the visual sensor, typically represented by the smart car team at VisLab Labs, University of Parma, Italy[25]. Other research teams tend to obtain environmental information relying on radar sensor, typically represented by Google’s unmanned vehicles. They mainly focus on the improvement of the algorithm and technology itself. However, how to reduce the impact of driving the decision on the number, type and installing location, the changes of sensors to make the technical architecture can adapt to different sensor configuration intelligent vehicle platform and achieve intelligent decision and sensor information decoupling[26]. As well as under the condition of complete driving information, increasing or reducing the number of radar sensors or changing the radar sensor model or installing location willnot affect the intelligent driving decision directly. This paper puts forward the technical structure of an intelligent vehicle with driving brain as the core and solves the convenient transplantation and robustness of the technology of radar perception and application.
This paper describes the technology of radar perception and application using the technical structure based on driving brain. The classification and application of radar sensor are introduced in the second part. The application of radar sensor in intelligent driving environment perception is introduced in the third part. The structure of the technology of radar sensor environment perception based on driving brain is introduced in the fourth part. The fifth part is the conclusion.
2 The Classification and Application of Intelligent Vehicle Radar Sensor
According to the detection principle, the radar is divided into millimeter-wave radar and laser radar, while the laser radar is divided into single-line and multi-line. Single-line laser radar has only one scanning line and obtains the depth information of one line by rotational scannings, such as the SICK series. Multi-line laser radar obtains the depth information of several lines by rotational scanning with several scan lines, such as 4-wire and 8-wire laser radar of IBEO series; three-dimensional omnidirectional radar obtains a spatial depth information by scanning a space, such as Velodyne’s 64 lines laser radar.
2.1 Millimeter-wave radar and application
Millimeter-wave radar is commonly used in unmanned vehicle obstacle detection, tracking and collision warning. It mainly includes ESR series and SRR series, of which the ESR and SSR are featured with the “multi-mode” integrating wide-viewing-angle mid-distance and narrow-viewing-angle long-distance as is shown in Fig.1. Limited by the working mode of millimeter-wave radar, the general radars can only detect a very narrow area in the front, so both sides of radar and both sides of the front of radar become blind areas. In order to expand the radar detecting angle, the detecting distance will be limited. A single ESR radar can provide both modes of mid-distance wide-coverage and high-resolution long-distance detection. The mid-distance wide-viewing-angle can not only find vehicles in adjacent lanes cutting from the side, but also identify vehicles and pedestrians crossing between the large vehicles. SRR series millimeter-wave radar, long-distance can provide accurate distance and speed data. Table 1 is the ESR radar parameters, as is shown in Fig. 1 ESR radar map and measurement range chart.
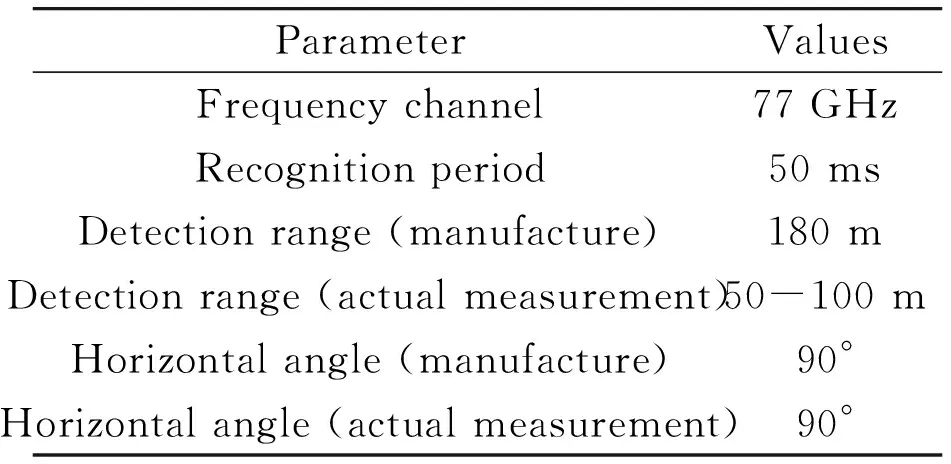
Table 1 The ESR radar parameters.
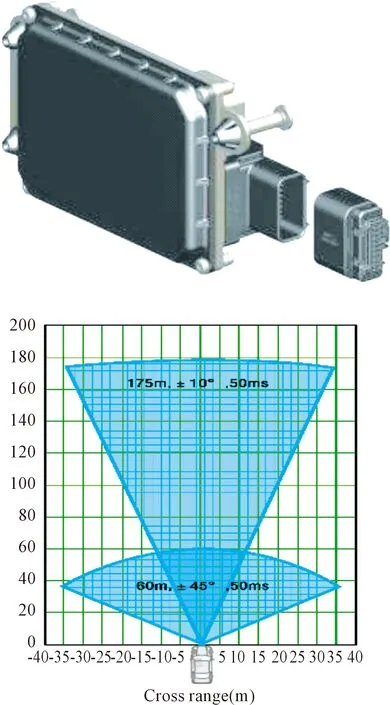
Fig.1TheESRradarmapandmeasurementrange.
2.2 Single-line laser radar and application
Single-line laser radar is a radar launching a laser beam, which has the advantages of simple structure, low power consumption, handy using, etc. It is widely used in the detection of obstacles, roadside, road, and track, etc. There are defects of deficient information content since there is only one scan line, resulting in the incapability to get the size, shape and other information of obstacles, and solve the obstruction of obstacles. Table 2 is the SICK single-line laser radar parameters, as shown in Fig.2 SICK single-line laser radar and measurement range chart.
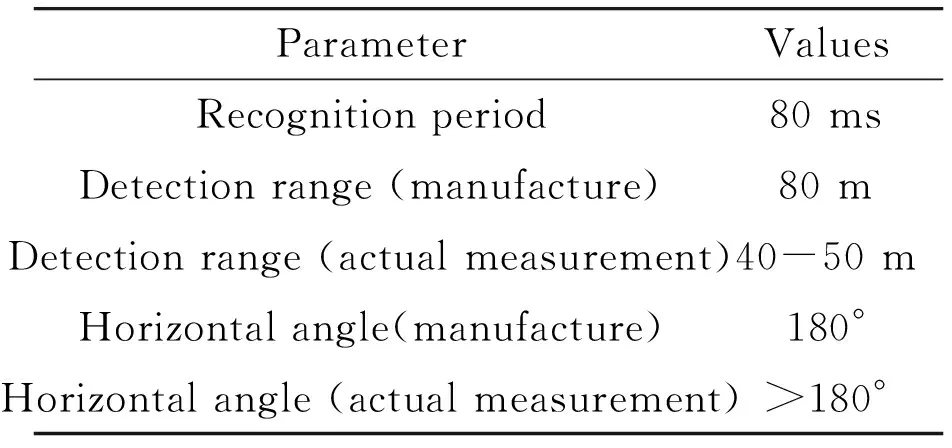
Table 2 The SICK single-line laser radar parameters.
2.3 Multi-line laser radar and application
Multi-line radar can achieve all the functions of single-wire radar, partially solving the problems of obstacles blocking each other, and providing the height of obstacles, but the accuracy is poor. Table 3 is the ibeo 4-lines laser radar parameters. Fig.3 shows the ibeo 4-lines laser radar and measurement range chart.
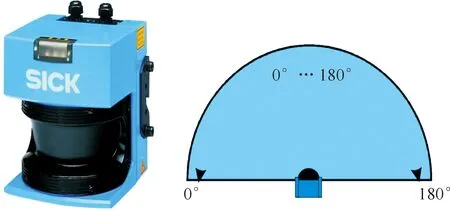
Fig.2TheSICKsingle-linelaserradarandmeasurementrange.
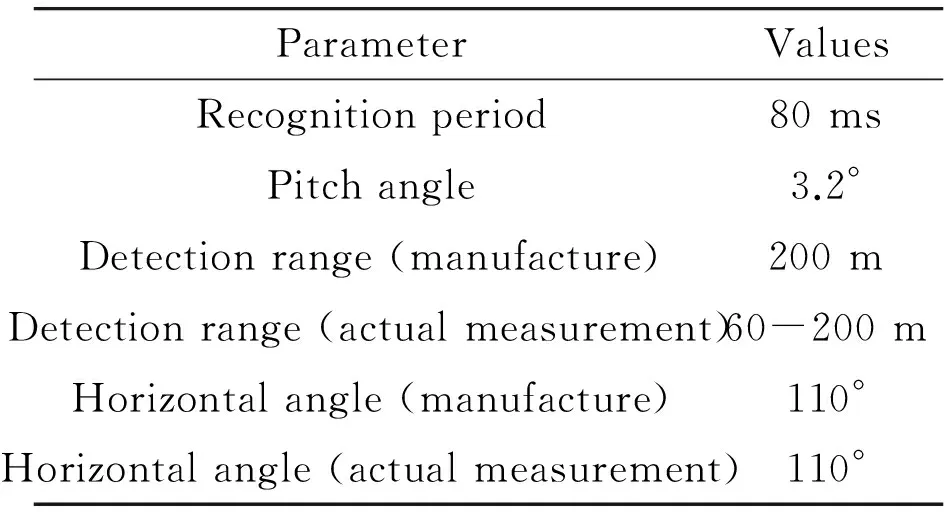
Table 3 The ibeo 4-lines laser radar parameters.
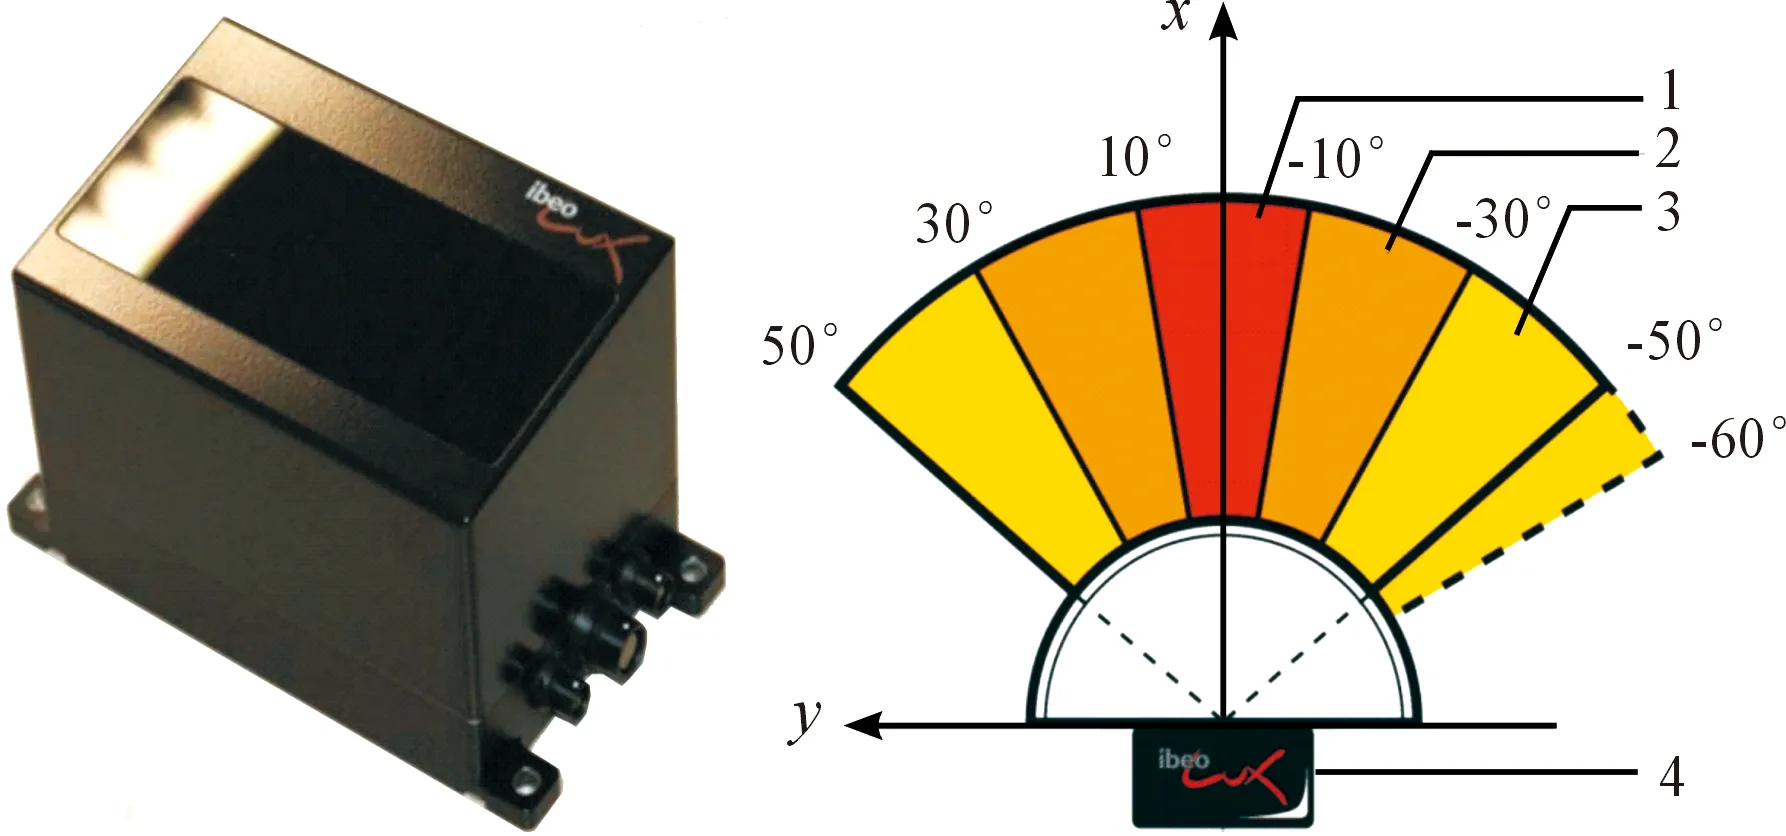
Fig.3Theibeo4linelaserradarandmeasurementrange.
2.4Three-dimensionalomnidirectionallaserradarandapplication
Traditional single-line or multi-line radar can only perform a simple function such as obstacle detection, but it can not meet the demands of real environmental perception, such as dynamic obstacle tracking, map construction etc. In order to provide more comprehensive, richer and more accurate environmental information of intelligent vehicles, the 3D laser radar is used in the field of intelligent vehicle studying. Among them, the representative three-dimensional omnidirectional laser radar is Velodyne 64-line laser radar. Table 4 is the Velodyne 64-lines laser radar parameters.Fig.4 shows the Velodyne 64-lines laser radar and measurement range chart.
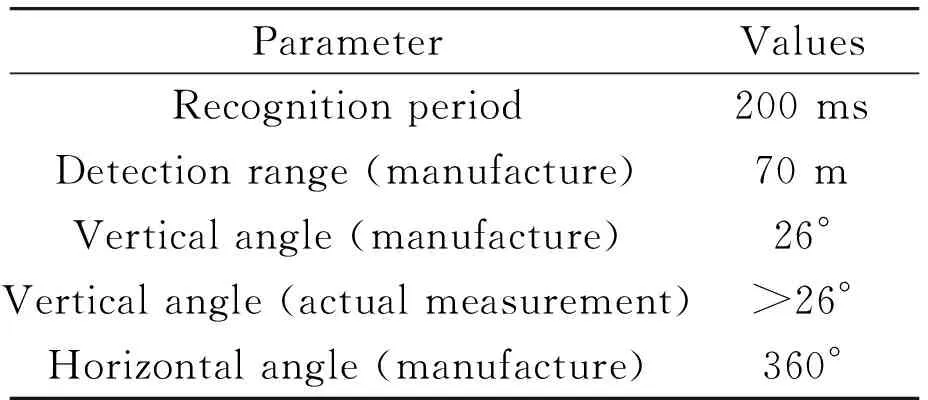
Table 4 The Velodyne 64-lines laser radar parameters.
3 The Application of Radar Sensor in Intelligent Driving Environment Perception
Intelligent vehicles aim to achieve autonomous driving in an unknown environment, they must be able to obtain the real-time reliable external and internal information in various environments. In the process of developing intelligent driving technology, the radar sensor is one of the mostly applied for environmental perception. From the US DAPAR Challenge to China’s Intelligent Vehicle Future Challenge, almost every participating intelligent vehicle is equipped with radar sensors, the areas marked with red rectangles are intelligent vehicles using various types of radar sensors, including single-line laser radar, multi-line laser radar, millimeter-wave radar, as shown in Fig.5.
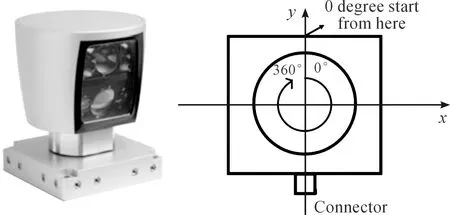
Fig.4TheVelodyne64-lineslaserradarandmeasurementrange.
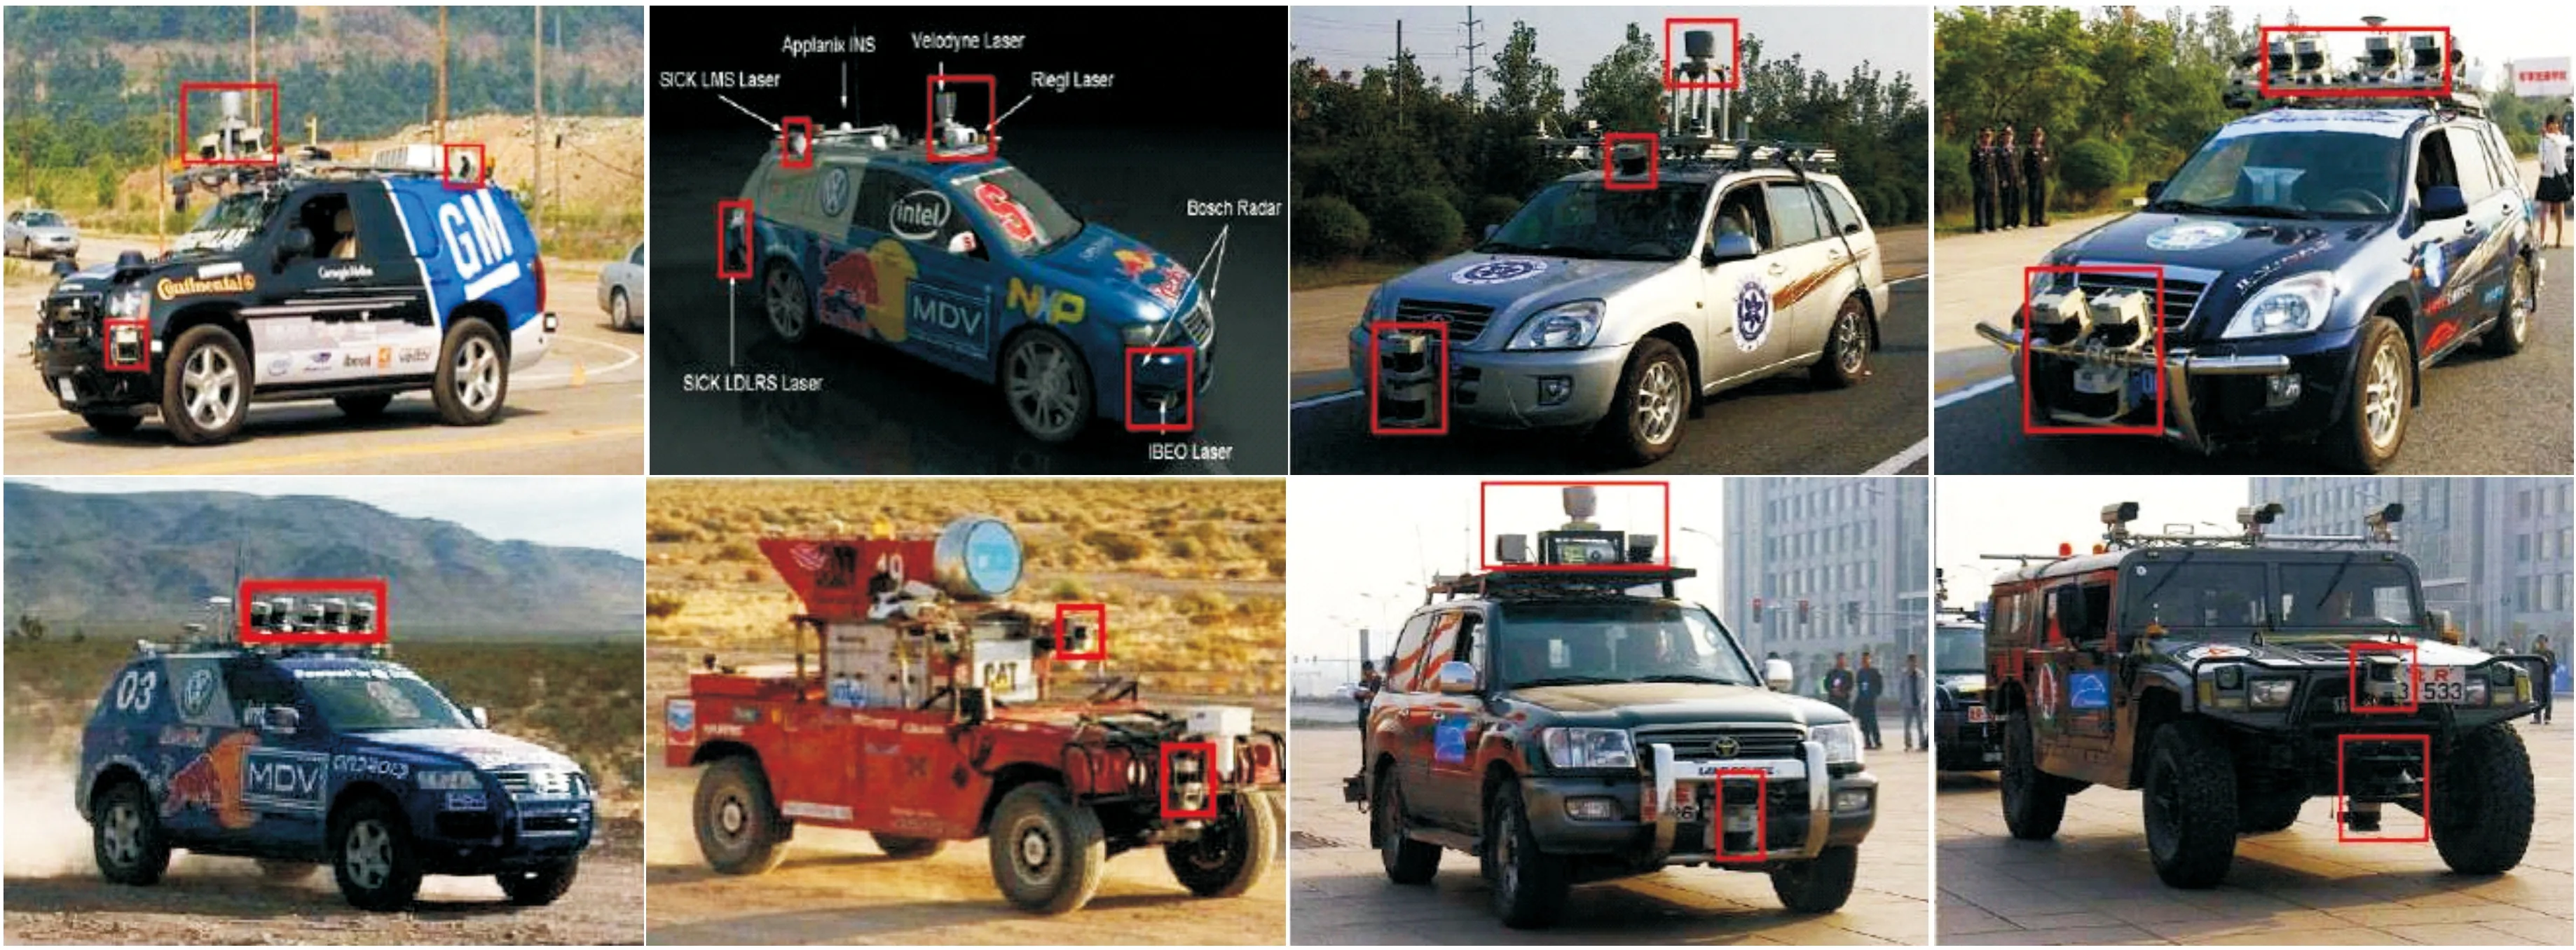
Fig.5 Intelligent vehicle equipped with radar equipment.
4 The Structure of Radar Sensor and Environment Perception
The technology of intelligent vehicle environment perception includes road information, traffic signs information, pedestrian behavior information and peripheral vehicle information etc. The information is acquired by a variety of vehicle heterogeneous sensor equipment, there are a variety of camera, radar (such as laser radar, millimeter-wave radar, ultrasonic radar, infrared radar etc.), GPS receiver, inertial navigation and so on. When a human driver performs a complex driving operation like lane changing, he or she will focus on different areas to ensure lane safety. Radar sensor includes various types, which can ensure heterogeneous sensor extract the real-time information accurately. Drawing lessons from the feature human’s recognition, we proposed a technology structure of intelligent vehicle based on driving brain. As is shown in Fig.6. The sensor which belongs to the different intelligent driving testing platform has different models, amounts and installing locations, the information processing modules are also different. As is shown in Fig.7. The granularity of information provided by different driving maps does not have a fixed standard. Therefore, the amount and interfaces of unmanned driving system software modules are different. Using driving brain to be core and making driving cognitive formalization, we can design the general unmanned driving system software structure using the formal language of the driving cognitive. In the architecture, the intelligent decision modules do not couple with the sensor information directly, it forms a comprehensive driving situation to complete intelligent decision through sensor information and prior map information, and it uses the method which acquires information by variable granularity right of way radar diagram to proceed perception[27].
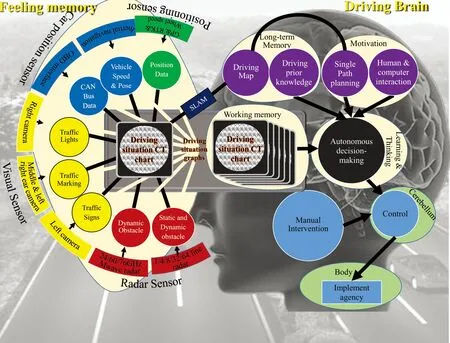
Fig.6 Driving brain technology architecture.
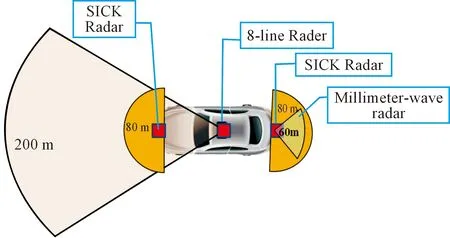
Fig.7 The hardware platform of intelligent vehicle.
Among them, the sensor information was acquired by equipment like camera, laser radar, millimeter-wave radar, combined positioning system. Radar sensor completes the static, dynamic obstacle identification, by launching electromagnetic waves initiative and getting cloud information through echo analysis point. The influence of light changes is small and the robustness is high. Radar sensor can be divided into laser radar, millimeter-wave radar, infrared radar, ultrasonic radar and other types according to their wavelengths of electromagnetic waves. Laser radar, which has the highest resolution among them, is the most commonly used sensors among intelligent driving testing platforms. The high-resolution radar can not only detect static and dynamic obstacles but also can use the reflection intensity to identify lane marking and ground traffic signs. The high precision point cloud data provided by laser radar can also be used for synchronous positioning and mapping[28]. It can build the environment point cloud model, acquiring the precise position of the vehicle meantime. However, laser radar costs high, and the weather conditions and other factors affect a lot. The millimeter-wave radar is also widely used on the intelligent driving testing platform. Millimeter-wave radar can accurately detect the distance and speed of the obstacle in the environment. Its cost is low, and the weather conditions and other factors affected a little. It is a useful supplement to laser radar.
4.1Theestablishmentofvariablegranularityrightofwayradardiagram
The rightof way means the road space and time which is needed by the conditions of vehicle safe driving, recorded asRow(t). Road ownership radar diagram means to detect and display the current status of the car’s road ownership using the form of radar diagram, as shown in Fig.8.
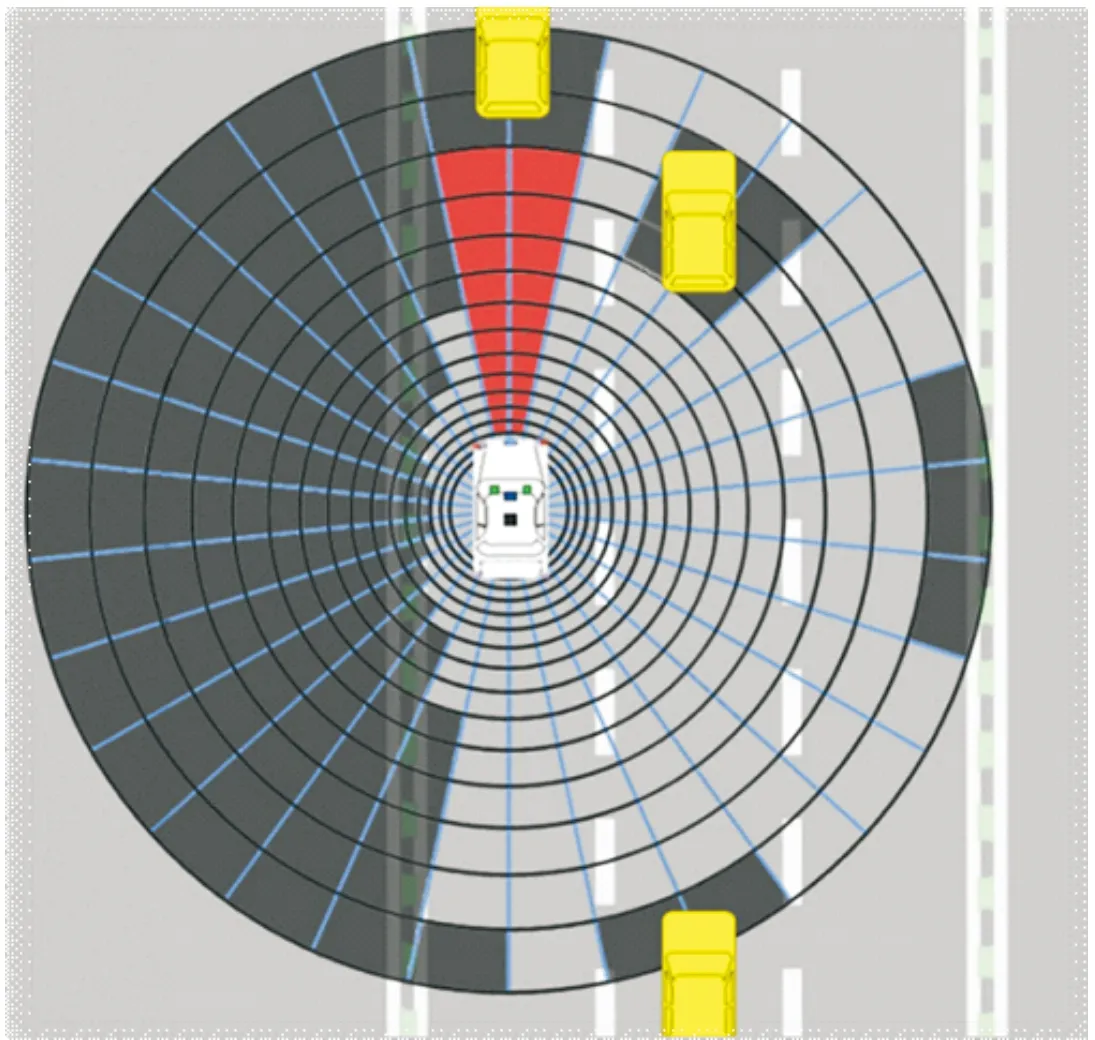
Fig.8 The right radar map.
The white car in Fig.8 indicates the intelligent vehicle and the yellow cars indicate other cars. The red part of road ownership radar diagram indicates the road ownership of the intelligent vehicle current driving stats. The shadow part indicates that the road ownership cannot be occupied by an intelligent vehicle.
Variable granularity radar diagram uses different sizes of grids to construct the form of variable granularity radar diagram, with the environment perception information of various sensors like fusion camera etc. and to display the road ownership space which the vehicle can occupy and the tendency of change. The establishment method is as follows:
(1) The road ownership radar diagram takes the geometric center of the vehicle as the center and covers a radius of about 200 m.
(2) Be closer to the intelligent vehicle, the size of road ownership radar diagram grid is smaller, the accuracy is higher. Be farther from the intelligent vehicle, the size of road ownership radar diagram grid is bigger, the accuracy is lower. For example, the minimum of grid radial is 5 cm, the maximum of it is 400 cm. The angel resolution of road ownership radar diagram can change according to the driving concern area, it also can be fixed, like Δ=1°. The variable granularity grid which is built by it can be matched with an array structure.
(3) Different types of sensors like camera and radar perceive the surrounding environment through the physical signals like sound, light, and electricity etc. Its working mechanism and the installing location on the vehicle are different from each other. Even if the same type of sensor, their accuracy, effective range and parameter settings (such as camera focal length, white balance, the identification distance of laser radar and angel resolution etc.) are also different. We can map the information which is perceived and processed by different sensors into the unified coordinate system of road ownership radar diagram with the parameter registration and position calibration and assign towards the corresponding grid. The content of the assignment may include the height of obstacle and confidence level etc.
(3) The road ownership is always parasitic on the running vehicle, relates to the vehicle speed and changes dynamically over time. Its period of updating is decided by the factors like the sampling frequency of sensor and the driving status etc.
(4) In the integration of multi-class sensor testing results, we will obtain the surrounding conditions of road ownership and the tendency of changing. We will form the foundational platform with the basic driving control strategy such as the lane of the car-following model and the adjacent lane of the road mode (including left turn, right turn, straight line, U word U-turn) and proceed the dynamic planning of local path and collaborative navigation.
(5) Based on the road ownership radar diagram, combined with the human driving experience, it will be beneficial to form the intelligent vehicle decision rule base and complete the conversion of qualitative knowledge to quantitative control.
Variable granularity radar diagram can realize the fusion of the sensed information of the sensor on the vehicle in different categories and different installing location in real time and judge the road ownership space which the vehicle can occupy and its tendency of changing. The Fine-grained, coarse-grained variable granularity grids which constructed according to the natural cognition law, meeting the demands of intelligent vehicle environment perception meantime, uses less storage space and computing resources to complete the simulation and calculation about human driving behavior recognition. It provides an important technical support for the realization of intelligent driving.
4.2Themethodofacquiringinformationusingvariablegranularityroadownershipradardiagram
The intelligent vehicle uses variable granularity road ownership radar diagram. It can fuse the environmental perception results of various sensors and display the status and change tendency of intelligent vehicle road ownership. In this section, the settings and calculation method of variable granularity road ownership radar diagram.
(1) Determine the coverage of the right of way of radar map
The road ownership radar diagram should cover the safe distance while intelligent vehicle driving. In the calculation of the safety distance of theintelligent vehicle, it is necessary to consider the speed of the vehicle, the possible wet slippery road and the reaction time of the driver. Article 70 of the Regulations on the Implementation of Road Traffic Safety Law stipulates that the expressway shall sign the speed of the lane and the maximum speed shall not exceed 120 km/h.
The coefficient of adhesion of slippery pavementμ=0.32, the general driver response timeTfranges from 0.35 to 0.65 s. For the sake of safety, let’s takeTf=0.65 s, and vehicle speedVm=120 km/h. In the response time, the vehicle do uniform motion forward distanceS1=Vm×Tf=22 m. After that, brakes, and the vehicle does uniformly retard the motion Forward distance

The safety distance isS=S1+S2=195 m. Therefore, the radius of road ownership radar diagram should not be less than 195 m.
(2) Determine the right of way radar of grid accuracy
Whether from the driver’s driving experience or from the actual requirements of vehicle control, the demands of perception accuracy in the different distance are not the same. Be closer to the intelligent vehicle, the size of road ownership radar diagram grid is smaller and accuracy is higher. Be farther from the intelligent vehicle, the size of road ownership radar diagram grid is bigger and accuracy is lower.
The distanceD, corresponds to a maximum speedVDthat ensures safe travel of the vehicle. The redial length of the fan-shaped grid at distanceDis the distance which the vehicle travels during the periodTof acquisition-sensing-control. According to the actual situation,T=100 ms. The road ownership radar diagram consists of a multi-turn grid. The grid which is located in the same circle has the same radial length.


The accuracy of grid isSn=Dn+Dn-1,n≥1.
Limited by the accuracy of the sensor, the minimum of the accuracy of the grid is 5 cm.Dnsequence is determined by the following recursion formula:
After calculating, we obtained that the radius of the road ownership radar diagram is 197.7 m, a total of 140 ring grid.
The minimum of the vertical length of the grid is 5 cm, the maximum is about 336 cm. The radial length of the intermediate grid can be calculated according to the recursion formula.
The following analysis is about the angle resolution:
The lane width of the ExpresswayL=3.5 m, the road ownership radar diagram can be divided intoNcopies. If it is required to distinguish different lanes at the furthest distance of the road ownership radar diagram, it should satisfy the following conditions:


According to the above content that the demonstration about the range and resolution of the road ownership radar diagram, road ownership radar diagram consists of 140×360=50 400 grids, we form the array with the size of 140×360 for information fusing.
(3) Determine the right of way radar of updating cycle
The upgrading period of road ownership radar diagram is determined by the factors like sampling frequency of sensors. Taking the PIKE100C camera sensor as an example, its sampling period is 25~40 ms (There will be some changes if the environment conditions like light change.). The sampling period of single-line, four-line, eight-line laser radar and millimeter-wave radar is all the 80 ms. In order to reflect the perception information of sensors accurately and real-time, the upgrading period should be less than the minimum period of each sensor. Therefore, the upgrading period of road ownership radar diagram is set to 20 ms in this example.
After fusing the detecting results of massive types of sensors, the stored array of road ownership radar diagram reflects the status of surrounding ownerships and the changing frequency. On the basis of this, we can establish the basic control strategy such as the lane of the car-following model and the adjacent lane changing mode and intersection mode,and proceed the dynamic planning of local path and collaborative navigation.
4.3Themethodofacquiringinformationbasedonvariablegranularityroadownershipradardiagram
This example is based on the military lion 3 intelligent vehicles, equipped with one single laser radar, one forward-4-line laser radar, one forward-8-line laser radar, one backward millimeter-wave radar and one forward PIKE100C camera both in the front and rear of the vehicle for the perception of the surrounding environment. Various types of sensor coverage overlap each other, as is shown in Fig.9.However, after the location calibration, the coverage is round or fan-shaped, we can use the road ownership radar diagram to proceed the information fusion.
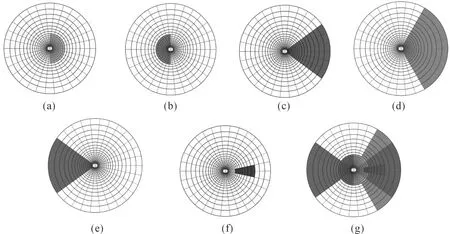
Fig.9Thecoverageareaofeachsensoroftheintelligentvehicle: (a)forwardsinglelineradar, (b)backwardsinglelineradar, (c)forward4-linesradar, (d)forward8-linesradar, (e)backwardmillimeterradar, (f)camera,and(g)allsensors.
The easiest way to fuse information is to set the grid the height of obstacle(unit/cm) as long as any of the sensors detects that a fan-shaped grid is occupied, and the fan-shaped grid which is not detected by any sensors is set to zero. This can ensure the results of information fusion reflects the ownership occupied situation of the obstacles around the vehicle. Fig.10 shows an example of the way in which the road ownership radar diagram is used to simulate the obstruction of the surrounding vehicle on the intercity expressway. The amplitude of the grid which contains obstacles in the figure is the height of the obstacles. For example, the amplitude of the grid which contains the far right fence means the height of the fence is 90 cm. Except, we can also introduce a confidence probability for each grid and set it to a real number range from 0 to 1. It can provide more precise support for the subsequent intelligent decision, path planning etc.
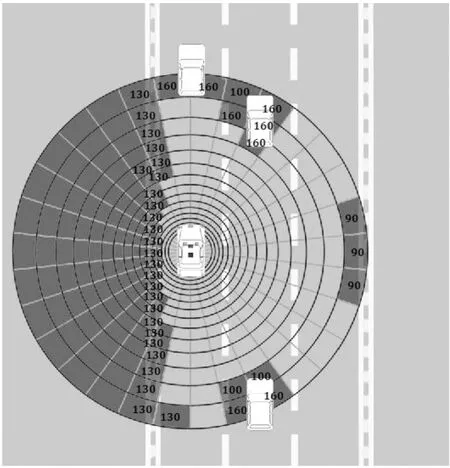
Fig.10Thestatesurroundingofintelligentvehicleusingtherightofwayoftheroadmap.
Using the variable ownership radar diagram for the information of environment perception processing, lion intelligent vehicle has been successfully completed several Beijing-Tianjin intercity expressway tests.
5 Conclusion
There are massive achievements and breakthroughs of Radar-based environment-perception technology in road detection, static obstacle detection, and environmental modeling, but the sensor configuration of the intelligent vehicle is the hardware basis for perceiving the surrounding environment and obtaining its own state. It is also the most costly and significant part on the testing platforms. Due to the differences of vehicle platform mechanical structure, the mechanical and electrical transformations are also slightly different. Intelligent vehicles sensor selection, installing location of the studying teams are also different, without unified program. This paper designs the radar sensor perception technology architecture of intelligent vehicle with the driving brain as the core, decouples the intelligent decision and sensor information and reduces the influence of the sensor quantity, type and installing position on the whole technology structure, and facilitates the migration of technical structures on platforms with different sensor collocations. In this paper, we propose a method to obtain the information using the variable granularity radar diagram. Under the condition of complete driving information, through the formal language of driving cognition, we can increase or decrease the number of radar sensors and change the radar sensor model or installation location, not affecting the intelligent driving decision directly, which can be easily transplanted on different test platforms.
Acknowledgment
This work was supported by National Natural Science Foundation of China under Grant No.61035004, No.61273213, No.61300006, No.61305055, No.90920305, No.61203366, No.91420202, No.61571045, No.61372148, the National High Technology Research and Development Program (“863” Program) of China under Grant No.2015AA015401, the National High Technology Research and Development Program (“973” Program) of China under Grant No. 2016YFB0100903, and the Junior Fellowships for Advanced Innovation Think-tank Program of China Association for Science and Technology under Grant No.DXB-ZKQN-2017-035, and the Beijing Municipal Science and Technology Commission special major under Grant No. D171100005017002.
[1]D.W.Gage, UGV History 101: A brief history of unmanned ground vehicle (UGV) development efforts,UnmannedSystems, vol.13, pp.9-32, 1970.
[2]T.Kanade and C.Thorpe,CMUstrategiccomputingvisionprojectreport: 1984to1985.Carnegie-Mellon University, the Robotics Institute, pp.10-90, 1986.
[3]M.Williams, PROMETHEUS-The European research programme for optimising the road transport system in Europe, inProceedingsofIEEEColloquiumonDriverInformation, 1988, pp.1-9.
[4]S.Tsugawa, M.Aoki, A.Hosaka, and K Seki, A survey of present IVHS activities in Japan,ControlEngineeringPractice, vol.5, no.11, pp.1591-1597, 1997.
[5]M.Yang, Overview and prospects of the study on driverless vehicles,JournalofHarbinInstituteofTechnology, vol.38, no.8, pp.1259-1262, 2006.
[6]H.B.Gao, X.Y.Zhang, T.L.Zhang, Y.C.Liu, and D.Y.Li, Research of intelligent vehicle variable granularity evaluation based on cloud model,ActaElectronicaSinica, vol.44, no.2, pp.365-374, 2016.
[7]X.Yuan, C.X.Zhao, and H.F.Zhang, Road detection and corner extraction using high definition lidar,InformationTechnologyJournal, vol.9, no.2, pp.1022-1030, 2010.
[8]Z.T.Wan,ResearchonLADARbasedroadandobstaclesdetection.National University of Defense Technology, 2010.
[9]F.Moosmann, O.Pink, and C.Stiller, Segmentation of 3D lidar data in non-flat urban environment using a local convexity criterion, inProceedingsofIntelligentVehicleSymposium, 2009, pp.215-220.
[10] B.Douillard, J.Underwood, N.Melkumyan, and S.Singh, Hybrid elevation map: 3D surface models for segmentation, inProceedingsofIEEE/RSJInternationalConferenceonIntellignetRobotsandSystems, 2010, pp.1532-1538.
[11] M.Himmelsbach, F.V.Hundelshausen, and H.J.Wuensche, Fast segmentation of 3D point clouds for ground vehicles, inProceedingsofIntelligentVehicleSymposlum, 2010, pp.560-565.
[12] J.H.Lee, T.Tsubouchi, and K.Yamamoto, People tracking using a robot in motion wuth laser range finder, inProceedingsofInternationalConferenceonIntelligentRobotsandSystems, 2006, pp.2936-2942.
[13] D.Brscic and H.Hashimoto, Tracking of objects in intelligent space using laser range finders, inProceedingsofInternationalConferenceonIntelligentRobotsandSystems, 2006, pp.1723-1728.
[14] F.Scholer, J.Behley, and V.Steinhage, Person tracking in three-dimensional laser ranger data with explicit occlusion adaption, inProceedingsofInternationalConferenceonRoboticsandAutomation, 2011, pp.1297-1303.
[15] L.Spinello, M.Luber, and K.O.Arras, Tracking people in 3D using a bottom-up top-down detector, inProceedingsofInternationalConferenceonRoboticsandAutomation, 2011, pp.1304-1310.
[16] L.E.Navarro-Serment, C.Mertz, and N.Vandapel, LADAR-based pedestrian detection and tracking, inProceedingsofIEEEWorkshoponHumanDetectionfromMobilePlatformsCalifornia, 2008.
[17] A.Petrovskaya and S.Thrun, Model based vehicle tracking in urban environments,inProceedingsofInternationalConferenceonRoboticsandAutomation, 2009.
[18] L.Wang,Simultaneouslocalizationandmappingofmobilerobotwithwholeareacoverage.Nanjing University of Science & Technology, 2005.
[19] D.Vivet, P.Checchin, and R.Chapuis, On the fly localization and mapping using a 360 Field-of-view Microwave Radar Sensor, inProceedingsofInternationalConferenceonIntelligentRobotsandSystems, 2009.
[20] K.Pathak, A.Birk, N.Vaskevicius, M.Pfingsthorn, S.Schwertfeger, and J.Poppinga, Online three-dimensional SLAM by registration of large planar surface segments and closed-form pose-graph relaxation,JournalofFieldRobotics, no.27, pp.52-84, 2010.
[21] S.Y.Park, S.I.Choi, J.Moon, and J.Kim, Localization of an unmanned ground vehicle using 3D registration of laser range data and DSM, inProceedingsofApplicationsofComputerVision, 2009, pp.1-6.
[22] B.Wu, Compression of 3D range data with adaptive thresholding using the Integral Image, inProceedingsofComputerScienceandInformationEngineeringKaohsiung:NationalUniversityofKaohsiung, 2011.
[23] Y.C.Lin, Large scale 3D scene registration using data from Velodyne LIDAR, inProceedingsofComputerScienceandInformationEngineeringKaohsiung:NationalUniversityofKaohsiung, 2011.
[24] H.Kurniawati, J.C.Schulmeister, T.Bandyopadhyay, G.Papadopoulos, F.S.Hover, and N.M.Patrikalakis, Infrastructure for 3D model reconstruction of marine structures, inProceedingsofInternationalConferenceonRoboticsandAutomation, 2010.
[25] M.Bertozzi, A.Broggi, and A.Fascioli, VisLab and the evolution of vision-based UGVs,Computer, vol.39, no.12, pp.31-38, 2006.
[26] E.Guizzo, How google’s self-driving car works,IEEESpectrumOnline, pp.18, 2011.
[27] X.Y.Zhang, H.B.Gao, M.Guo, G.P.Li, Y.C.Liu, and D.Y.Li, A study on key technologies of unmanned driving,CAAITransactionsonIntelligenceTechnology, vol.1, no.1, pp.4-43, 2016.
[28] M.W.M.G.Dissanayake, P.Newman, S.Clark, H.F.Durrant-Whyte, and M.Csorba,A solution to the simultaneous localization and map building problem,IEEETransactionsonRoboticsandAutomation, vol.17, no.3, pp.229-241, 2001.
•Hongbo Gao is with State Key Laboratory of Automotive Safety and Energy, Tsinghua University, Beijing 100083, China.
•Xinyu Zhang is with Information Technology Center, Tsinghua University, Beijing 100083, China. Email: xyzhang@tsinghua.edu.cn.
•Jianhui Zhao is with Department of Computer Science and Technology,Tsinghua University, Beijing 100083, and Military Transportation University, Tianjin 300161, China.
•Deyi Li is with Institute of Electronic Engineering of China, Beijing 100039, China.
*To whom correspondence should be addressed. Manuscript
2017-08-06; accepted: 2017-09-18
 CAAI Transactions on Intelligence Technology2017年3期
- CAAI Transactions on Intelligence Technology的其它文章
- Micro Structure of Injection Molding Machine Mold Clamping Mechanism: Design and Motion Simulation
- Retinal Image Segmentation Using Double-Scale Nonlinear Thresholding on Vessel Support Regions
- The Fuzzification of Attribute Information Granules and Its Formal Reasoning Model
- Enriching Basic Features via Multilayer Bag-of-words Binding for Chinese Question Classification
- Technology and Application of Intelligent Driving Based on Visual Perception
- Interactions Between Agents:the Key of Multi Task Reinforcement Learning Improvement for Dynamic Environments
