
The Role of Echocardiography in Hypertrophic Cardiomyopathy
2017-05-26 03:13:02JingPingSunXingShengYangandShaochunWang
Jing Ping Sun, Xing Sheng Yang, and Shaochun Wang
Introduction
The prevalence of hypertrophic cardiomyopathy(HCM) is about 0.05–0.2% of the general population [1]. The occurrence of HCM is a significant cause of sudden cardiac death in any age group and a cause of heart failure. The generally accepted definition of HCM is a disease state characterized by unexplained left ventricular (LV) hypertrophy without dilated ventricular chambers in the absence of another cardiac or systemic disease [2, 3], which itself is capable of producing the magnitude of hypertrophy, caused by a genetic disorder in one of the at least ten genes that encode the proteins of the cardiac sarcomere. Clinically, HCM is usually recognized by maximal LV wall thickness of 15 mm, with wall thickness of 13–14 mm considered borderline, particularly in the presence of other compelling information (e.g., family history of HCM),on the basis of echocardiography [1].
Diagnosis
Numerous cardiac abnormalities lead to LV hypertrophy, including primary myocardial disease, disorders of myocardial deposition, and hypertrophy due to excess afterload. These “hypertrophic cardiac syndromes” are often distinguished from one another, and from normal function, by other features, including valvular abnormalities, out fl ow tract obstruction, electrocardiographic patterns,diastolic LV dysfunction, and distribution of LV hypertrophy. This disease has a unique potential for clinical presentation during any phase of life from infancy to old age and may be expressed in a wide range of phenotypical forms, from severe symmetric LV hypertrophy to massive hypertrophy of asymmetrical distribution.
The physiopathologic mechanisms underlying HCM are complex and not clearly understood, but include dynamic LV out fl ow obstruction, mitral regurgitation, and diastolic dysfunction. These may all lead to shortness of breath, limited functional capacity, angina, and syncope; however, although most patients are asymptomatic throughout their lives, there is a risk of sudden cardiac death probably associated with arrhythmia and progression to advanced heart failure with LV systolic dysfunction.
Diagnosis of HCM is now mainly based on cardiac imaging methods, including two-dimensional echocardiography, MRI, and multislice CT scanning. However, echocardiography is the first choice to screen patients for this disease.
M-Mode Echocardiography
M-mode echocardiography was the first echocardiographic technique used for the diagnosis of HCM.Typically, M-mode scans through the left ventricle in the long parasternal view allow the detection of a thickened wall (>15 mm) and a reduced cavity of the left ventricle. The hypertrophy can be of concentric or asymmetric distribution, usually affecting the septal wall, with a septal to posterior wall ratio greater than 1.3 in normotensive patients or greater than 1.5 in hypertensive patients.
M-mode echocardiography can also determine the existence, degree, and duration of an abnormal systolic anterior movement (SAM) of the mitral valve,related to several factors, such as abnormalities in the mitral valve apparatus (i.e., posterior to anterior lea fl et mismatch and abnormal disposition of the subvalvular apparatus), reduced LV out fl ow tract(LVOT) dimensions, and the Venturi effect of the abnormally accelerated LV out fl ow. The duration of the contact of the mitral valve with the septal wall allows the classification of the severity of the SAM,given the high temporal resolution of M-mode scans across the mitral valve in the parasternal long axis(Figure 1A). Additionally, M-mode interrogation of the aortic valve lea flets provides indirect hemodynamic information about the existence of LV out fl ow obstruction as the early closing of an otherwise, normally appearing aortic valve can be detected during the middle of systole (Figure 1B). This mid-systolic closure or notching of the aortic valve must be differentiated from other causes of severe LV hypertrophy such as the presence of a subaorticfixed stenosis(subaortic membrane), where the abnormal closure of the aortic valve occurs in early systole, or a valvular aortic stenosis, where the valve does not open properly throughout the whole systole and thickening of the aortic leaflets is present.
Two-Dimensional Echocardiography
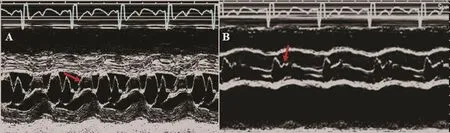
Figure 1 M-mode images of the parasternal long-axis view from a patient with hypertrophic cardiomyopathy (A) showing the mitral anterior leaflet anterior motion (arrow) during systole and (B) showing the aortic valve closed early in the middle of systole (arrow).
Two-dimensional echocardiography provides a powerful tool to evaluate patients with HCM with more anatomical information of the whole cardiac cavities. It also allows a better understanding of the distribution of the hypertrophy than M-mode echocardiography, especially in those rare presentations affecting localizations other than the septal wall or the posterior wall such as the LV inferior or lateral wall. The distribution of LV hypertrophy may be well determined by the use of 2D echo echocardiography in the short-axis view of the left ventricle,where the whole transverse section of the LV wall and cavity can be examined in most cases. From this view, this technique may also be able to detect right ventricular involvement (Figure 2). Also, from the apical views, 2D echocardiography allows the evaluation of the distribution of the LV hypertrophy that may not only affect the basal septum mostly but can also involve the whole septal or inferior wall(Figure 2).
Left atrial dimension, an index of chronic diastolic dysfunction and mitral regurgitation, which are both usually observed in HCM patients, can also be assessed with 2D echocardiography, mainly from the apical views. Finally, 2D echocardiography permits the estimation of LV systolic function as in any cardiac disease.
Color Doppler Echocardiography
Color Doppler 2D echocardiography detects the presence of a turbulent fl ow in the LVOT in the case of LV obstruction. The most frequent obstruction position is at the out fl ow tract, but may occur at three levels: LVOT, mid ventricular, and apical in patients with obstructive HCM. The presence of a fl ow convergence area in the LVOT can point out the existence of obstruction at this level probably due to an associated SAM, while visualization of a turbulent fl ow in the mid cavity may help in the diagnosis of these less frequent forms of HCM(Figure 3). Mid-ventricular obstruction may also develop secondary to apical myocardial infarction in a patient with angiographically normal coronary arteries or in patients with coronary artery disease and diffuse involvement of ventricular hypertrophy [4, 5]. Also, color Doppler echocardiography diagnoses the presence of mitral regurgitation as a consequence of SAM and/or the coexistence of organic valve disease [6]. The mitral regurgitant jet is usually eccentric and directed posterolaterally to the left atrium.
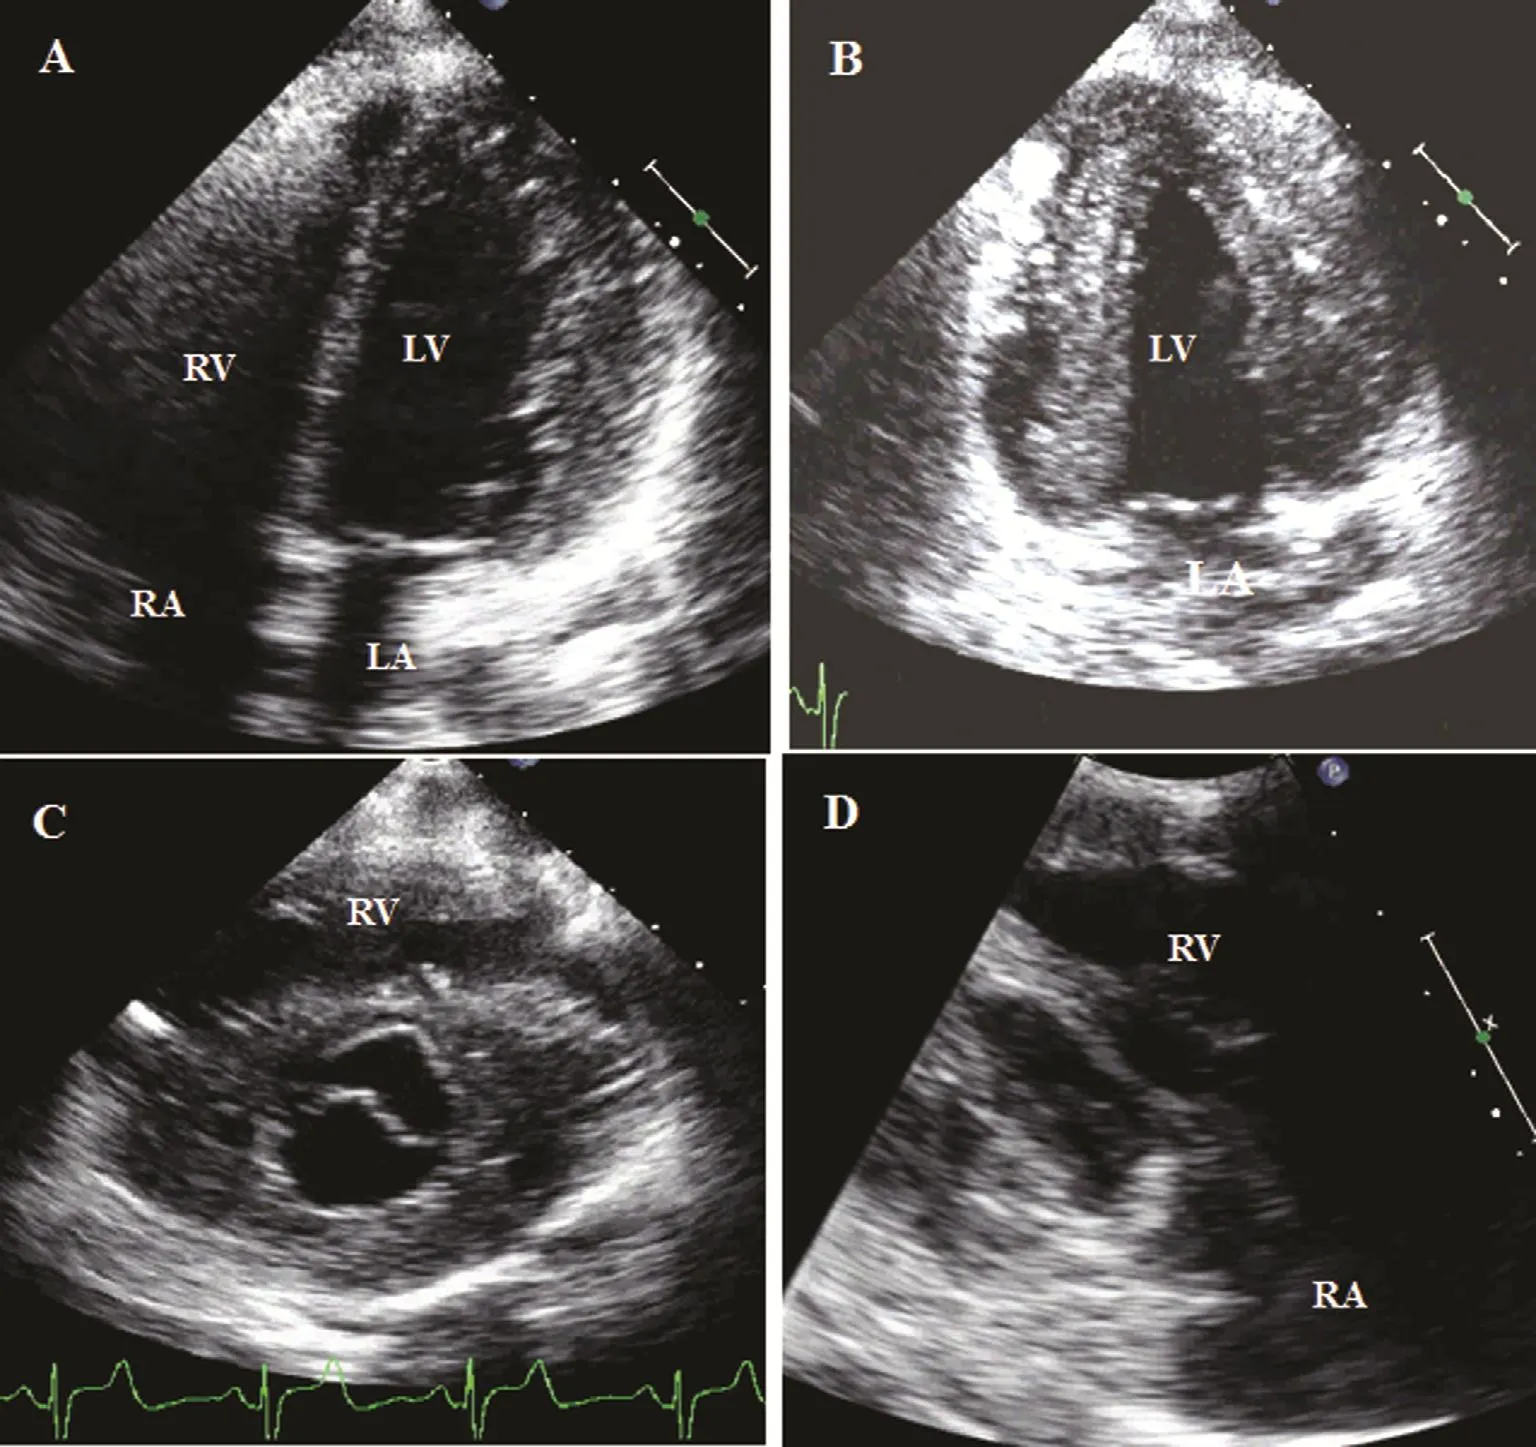
Figure 2 Two-dimensional images from a patient with hypertrophic cardiomyopathy showing the distribution of hypertrophic walls: (A) thickened lateral wall with a left ventricular chamber of normal size; (B) apical four-chamber view showing thickened left ventricular anterior and inferior walls; (C) parasternal short-axis view showing only a normal anterior septal wall but thickened remaining segments, including the right ventricular free wall; (D) right ventricular in fl ow tract view showing thickened right ventricular free wall and septal wall. LA, left atrium; LV, left ventricle; RA, right atrium; RV right ventricle.
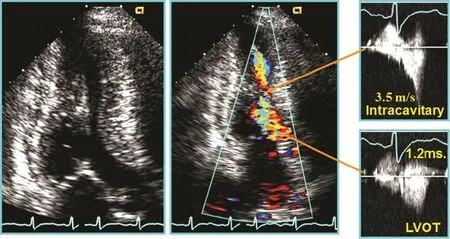
Figure 3 Two-Dimensional and Doppler Images from a Patient with Left Ventricular (LV) Mid-Cavity Obstruction.
Pulsed Wave and Continuous Wave Doppler Echocardiography
Pulsed wave Doppler echocardiography is a reliably tool to detect the level at which the obstruction is produced by mapping fl ow velocity from the apex to the out fl ow tract in the presence of LV or midcavity obstruction. Especially, pulsed wave Doppler echocardiography was used with color Doppler echocardiography (Figure 3).
Additionally, LV diastolic dysfunction often occurs in patients with HCM, mostly indicating impaired myocardial relaxation regardless of symptoms or the presence of LVOT obstruction.Assessment of diastolic function is helpful in the evaluation of symptoms and disease staging.Doppler echocardiographic parameters are sensitive measures of diastolic function. Therefore a comprehensive evaluation of diastolic function, including Doppler imaging of mitral valve inflow, tissue Doppler velocities at the mitral annulus, pulmonary vein fl ow velocities, pulmonary artery systolic pressure, and the size and volume of the left atrium, is recommended as part of the routine assessment of HCM.
Pseudonormalization is also often seen in patients with LVOT obstruction and secondary mitral regurgitation with increased atrial pressure. Also, a restrictive pattern may be seen as an effect of increased chamber stiffness causing both rapid atrial-ventricular pressure equilibration (rapid deceleration time) and compensatory increases in left atrial pressure (increased E-wave velocity) [7,8]. Finally, pulsed wave Doppler imaging of the LV in flow combined with velocities of the mitral annulus determined with pulsed tissue Doppler imaging may also provide accurate estimates of LV filling pressures [9].
Continuous wave Doppler echocardiography is an essential tool for the estimation of the severity of intraventricular obstruction. Excellent correlation has been demonstrated between pressure gradients determined from continuous wave Doppler echocardiography and cardiac catheterization in different subsets of patients with HCM [10]. Typically, the spectral continuous wave Doppler echocardiogram shows a dagger-shaped gradient across the LVOT [11].
Two-dimensional and Doppler techniques are useful tools to estimate the effect of therapy in patients with HCM. Figure 4 showed continuous wave Doppler images of a patient with HCM before and after percutaneous transluminal septal myocardial ablation; the LVOT obstruction was relieved.
The clinical uses of various echocardiographic techniques for screening and diagnosis of HCM are summarized in Table 1.
Two-Dimensional Speckle Tracking Echocardiography
Two-dimensional strain is a unique imaging mode that permits objective analysis of myocardial motion throughout the entire cardiac cycle.
Experimental measurements of septal wall mechanics in transgenic mice with HCM have shown that regions of myocyte disarray have reduced systolic shortening, torsional systolic shear,and sarcomere length [12]. The focal myofiber disarray and hypertrophy in HCM is present mainly in the hypertrophic wall. In addition, systolic and diastolic sarcomere lengths are significantly shorter in areas of myofiber disarray [13]. Shorter sarcomere lengths suggest that myocytes in areas of disarray may operate at a lower point on their length-tension curve, generating less systolic tension and shortening. Sun et al. [14] found that, compared with healthy volunteers, in patients with HCM the segmental abnormalities circumferential, radial, and longitudinal strain were significantly reduced in the septal, anterior septal, and anterior walls but not in other regions. This heterogeneity of regional dysfunction might reflect the regional distributions of myocardial disarray and fibrosis. Their results demonstrate that the extent of regional abnormalities on 2D strain images is directly related to the degree of regional LV hypertrophy. These results are consistent with results of studies using tissue Doppler imaging [15]. The standard deviation of the time to peak strain was significantly higher in the groups with HCM and amyloidosis compared with the control group, indicating the asynchronized contraction pattern that underlies the disease in these patients.This may be one of the mechanisms of systolic dysfunction. Secondary LV hypertrophy is caused by the remodeling of myocardium in response to longterm LV pressure overload (e.g., hypertension and aortic valvular stenosis); there is myo fiber compensational hypertrophy, but myo fiber array is still normal in the early stage. Systolic function is normal, but the diastolic relaxation may be impaired because of LV hypertrophy.

Figure 4 Continues wave Doppler images of the left ventricular out fl ow tract (LVOT) from a patient with hypertrophic cardiomyopathy before (left with high velocity) and after (right with normal velocity) percutaneous transluminal septal myocardial ablation showed the LVOT obstruction was relieved.
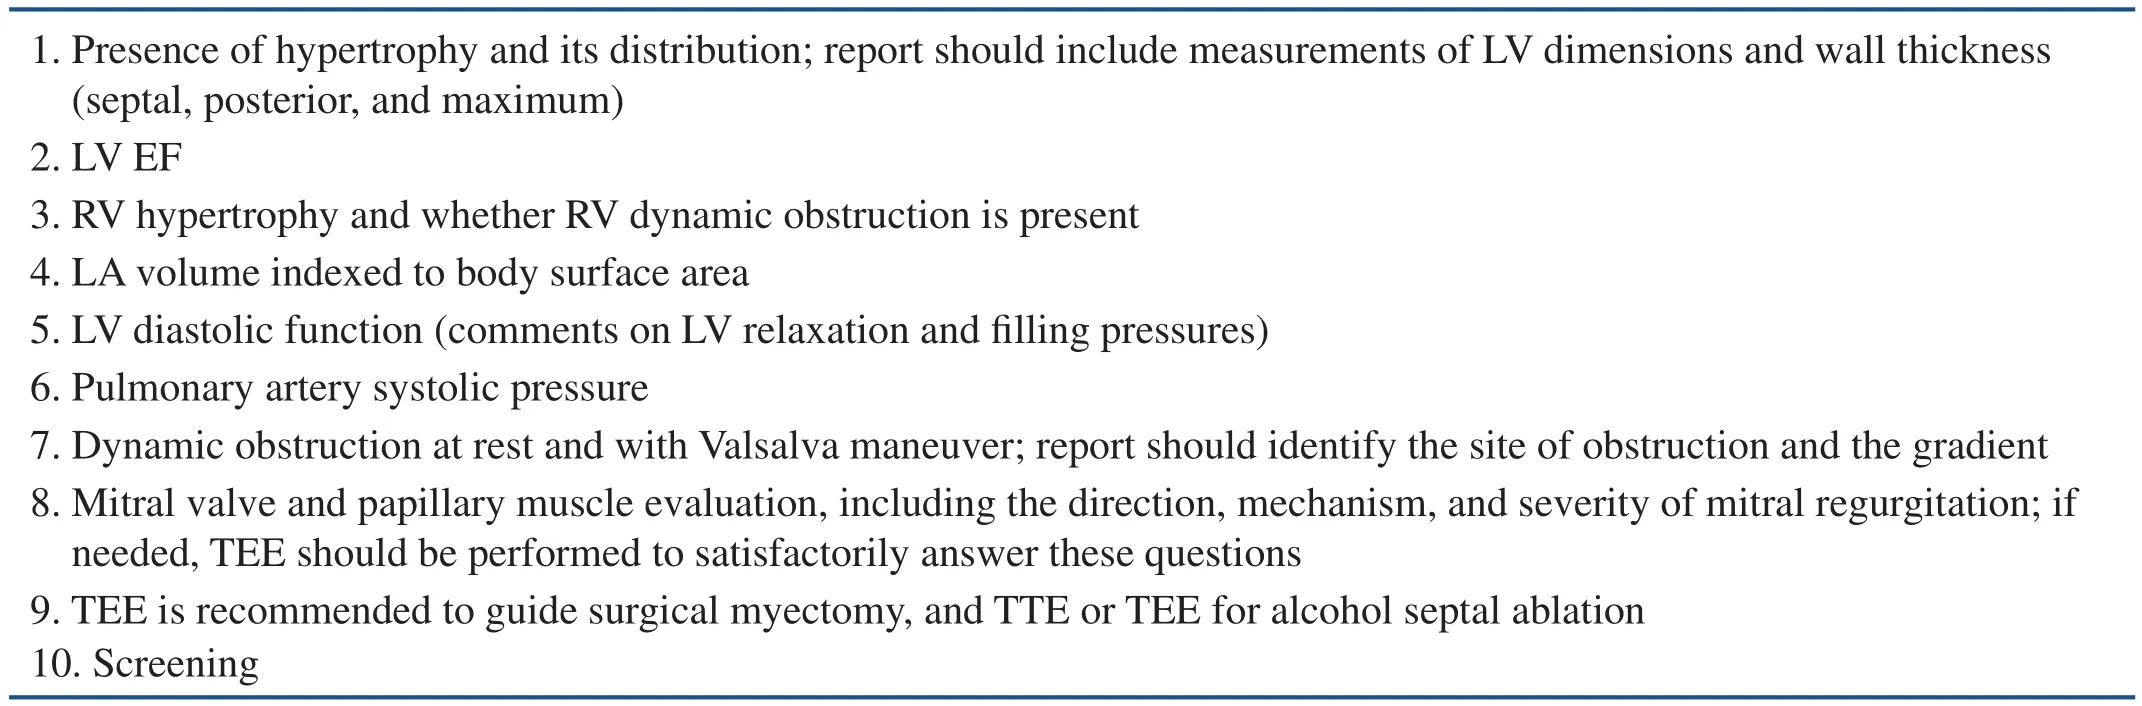
Table 1 Echocardiographic Evaluation of Patients with Hypertrophic Cardiomyopathy.
The assessment of myocardial deformation either by Doppler myocardial imaging or 2D speckle tracking echocardiography may be used to differentiate hypertrophic myopathies with similar phenotype appearance (i.e., myocardial hypertrophy) but with very different genotype and underlying cause such as HCM, amyloidosis, hypertensive cardiomyopathy, or Fabry disease.
The differentiation of such diseases is important as they have different prognostic and therapeutic implications. The most typical pattern of deformation in HCM is segments where no myocardial deformation is present, surrounded by regions of only slightly reduced deformation (Figure 5).Conversely, in amyloidotic disease, all ventricular segments show low or absent systolic longitudinal deformation. Additionally, a study [16] demonstrated LV myocardial longitudinal strain estimated by 2D layer-specific speckle-tracking echocardiography was reduced but LV circumferential strain and LV twist was enhanced with increasing blood pressure in hypertensive patients with normal LV ejection fraction; these early changes may represent early subclinical LV systolic dysfunction and the mechanism of reserved LV gross systolic function.Finally, longitudinal deformation is most affected in inferolateral segments of the left ventricle in patients with Fabry disease [17]. Three-dimensional strain echocardiography could provide a more comprehensive assessment of hypertrophic cardiomyopathies and also easier interpretation of deformation data by simple visualization of all ventricular segments[18]. Another potential application of myocardial deformation imaging is the prediction of the risk of ventricular arrhythmias in patients with HCM. It has been demonstrated that the presence of more than three LV segments with a reduction in the longitudinal systolic strain of 10% or more is an independent predictor of nonsustained ventricular tachycardia,which is, in turn, associated with the presence of myocardial fibrosis [19]. Finally, deformation imaging has also been used to evaluate left atrial dysfunction; a low peak systolic strain rate of the left atrium has been reported in patients with HCM and correlated with heart failure symptoms [20].
Conclusions
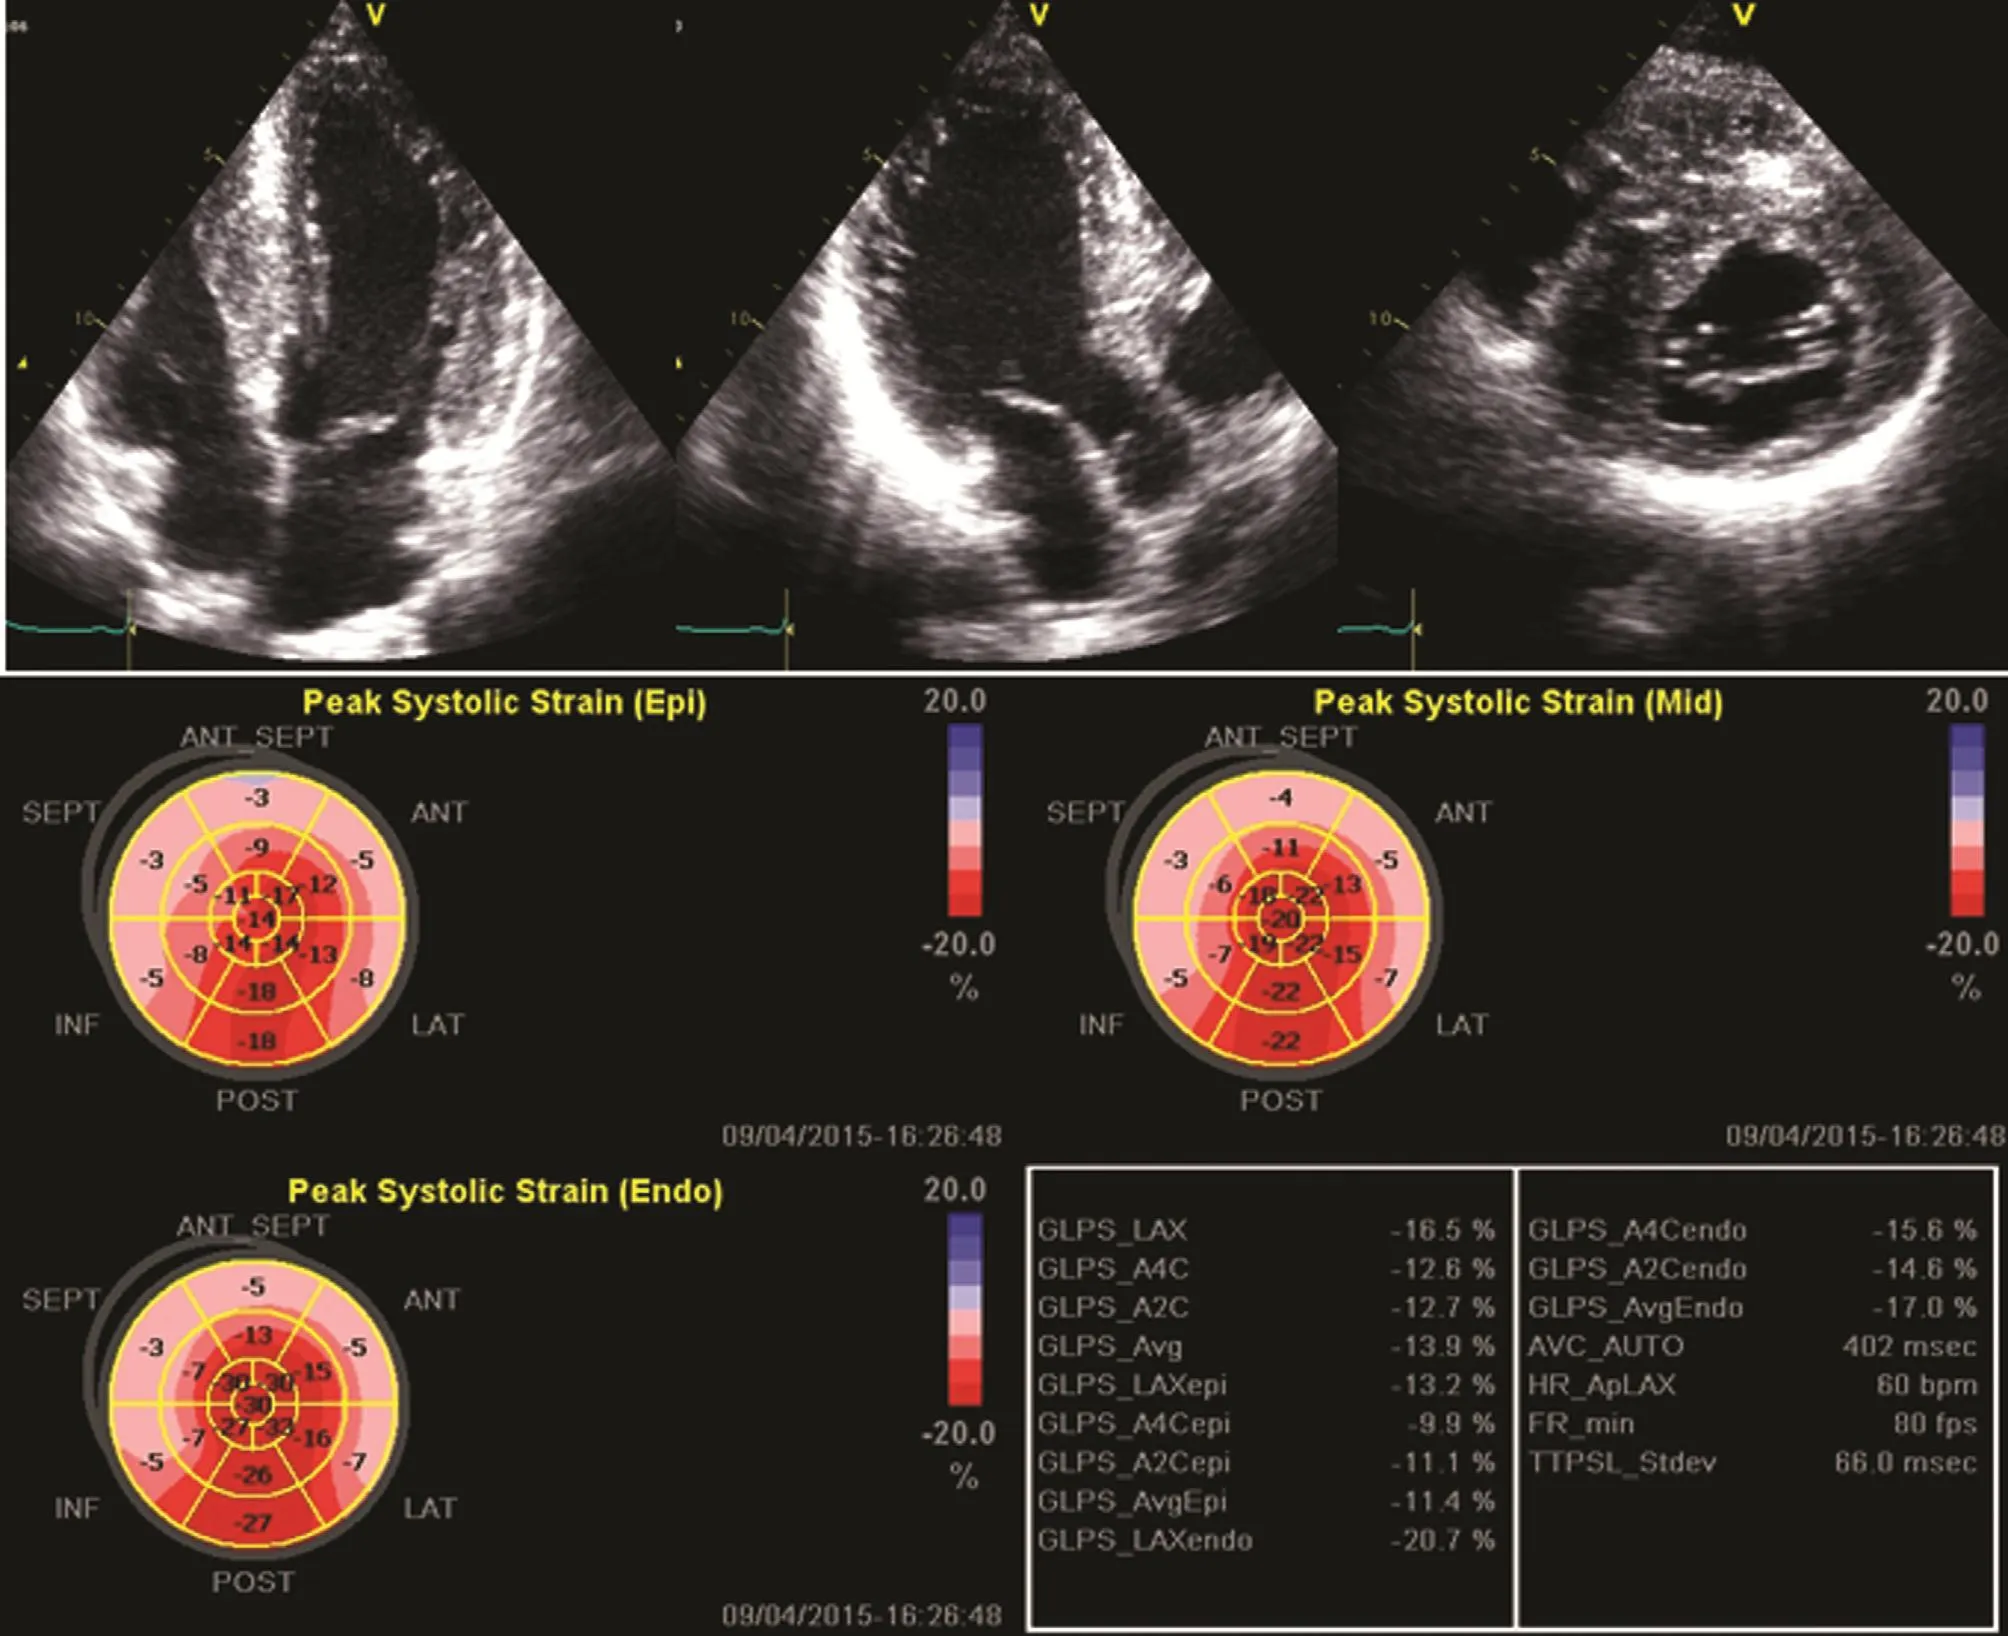
Figure 5 Apical Four-Chamber, Three-Chamber, and Parasternal Short-Axis Views from a Patient with Hypertrophic Cardiomyopathy Showing the Distribution of Hypertrophic Segments.
Echocardiography is an invaluable tool in the screening and diagnosis of HCM. It is also the first noninvasive imaging method for risk strati fication, treatment selection and follow-up of patients.Two-dimensional and Doppler echocardiography are useful for evaluation of LV diastolic and systolic function, which is important for clinical practice. Two-dimensional strain is a simple, rapid, and reproducible method for early detection of early abnormalities in HCM patients with normal LV systolic function. The diagnosis of HCM is still challenging, and diagnosis can only be 100% reliable when a gene mutation is identified. No single echocardiographic parameter is ideal, and history and clinical examination play a vital role.
REFERENCES
1. Nagueh SF, Bierig SM, Budoff MJ, Desai M, Dilsizian V, Eidem B, et al. American Society of Echocardiography clinical recommendations for multimodality cardiovascular imaging of patients with hypertrophic cardiomyopathy:endorsed by the American Society of Nuclear Cardiology, Society for Cardiovascular Magnetic Resonance,and Society of Cardiovascular Computed Tomography. J Am Soc Echocardiogr 2011;24(5):473–98.
2. Maron MS, Olivotto I, Zenovich AG, Link MS, Pandian NG,Kuvin JT, et al. Hypertrophic cardiomyopathy is predominantly a disease of left ventricular out fl ow tract obstruction.Circulation 2006;114:2232–9.
3. Maron BJ. Hypertrophic cardiomyopathy: a systematic review. JAMA 2002;287:1308–20.
4. Fighali S, Krajcer Z, Edelman S,Leachman RD. Progression of hypertrophic cardiomyopathy into a hypokinetic left ventricle: higher incidence in patients with midventricular obstruction. J Am Coll Cardiol 1987;9:288–94.
5. Sun JP, Yang XS, Wong K-T, Yu C-M. Hypertrophic cardiomyopathy with apical aneurysm. Int J Cardiol 2015;184:394–6.
6. Rakowski H, Sasson Z, Wigle ED.Echocardiographic and Doppler assessment of hypertrophic cardiomyopathy. J Am Soc Echocardiogr 1988;1:31–47.
7. Nihoyannopoulos P, Karatasakis G, Frenneaux M, McKenna WJ,Oakley CM. Diastolic function in hypertrophic cardiomyopathy: relation to exercise capacity. J Am Coll Cardiol 1992;19:536–40.
8. Elliott PM, Brecker SJ, McKenna WJ. Diastolic dysfunction in hypertrophic cardiomyopathy. Eur Heart J 1998;19:1125–7.
9. Nagueh SF, Lakkis NM, Middleton KJ, Spencer WH III, Zoghbi WA,Quinones MA. Doppler estimation of left ventricular filling pressures in patients with hypertrophic cardiomyopathy. Circulation 1999;99:254–61.
10. Panza JA, Petrone RK, Fananapazir L, Maron BJ. Utility of continuous wave Doppler echocardiography in the noninvasive assessment of left ventricular out fl ow tract pressure gradient in patients with hypertrophic cardiomyopathy. J Am Coll Cardiol 1992;19:91–9.
11. Kizilbash AM, Heinle SK, Grayburn PA. Spontaneous variability of left ventricular out flow tract gradient in hypertrophic obstructive cardiomyopathy. Circulation 1998;97:461–6.
12. Karlon WJ, Covell JW, McCulloch AD, Hunter JJ, Omens JH.Automated measurement of myo fiber disarray in transgenic mice with ventricular expression of rats. Anat Rec 1998;252:612–25.
13. Karlon WJ, McCulloch AD, Covell JW, Hunter JJ, Omens JH. Regional dysfunction correlated with myofiber disarray in transgenic mice with ventricular expression of rats. Am J Physiol Heart Circ Physiol 2000;278:H898–906.
14. Sun JP, Stewart WJ, Yang XS,Donnell RO, Leon AR, Felner JM, et al. Differentiation of hypertrophic cardiomyopathy and cardiac amyloidosis from other causes of ventricular wall thickening by two-dimensional strain imaging echocardiography. Am J Cardiol 2009;103(3):411–5.
15. Yang H, Sun JP, Lever HM,Popovic ZB, Drinko JK, Greenberg NL, et al. Use of strain imaging in detecting segmental dysfunction in patients with hypertrophic cardiomyopathy. J Am Soc Echocardiogr 2003;16:233–9.
16. Sun JP, Xu T, Yang Y, Yang XS,Shang Q, Li Y, et al. Layer-specific quantification of myocardial deformation may disclose the subclinical systolic dysfunction and the mechanism of preserved ejection fraction in patients with hypertension.Int J Cardiol 2016;219:172–6.
17. Cikes M, Sutherland GR, Anderson LJ, Bijnens BH. The role of echocardiographic deformation imaging in hypertrophic myopathies. Nat Rev Cardiol 2010;7:384–96.
18. Baccouche H, Maunz M, Beck T, Gaa E, Banzhaf M, Knayer U, et al. Differentiating cardiac amyloidosis and hypertrophic cardiomyopathy by use of threedimensional speckle-tracking echocardiography. Echocardiography 2012;29:668–77.
19. Di Salvo GPG, Limongelli G,Baldini L, Rea A, Verrengia M,D’Andrea A. Non-sustained ventricular tachycardia in hypertrophic cardiomyopathy and new ultrasonic derived parameters. J Am Soc Echocardiogr 2010;23:581–90.
20. Rosca M, Bogdan AP, Beladan C,Calin A, Muraru D, Popa E, et al.Left atrial dysfunction as a correlate of heart failure symptoms in hypertrophic cardiomyopathy. J Am Soc Echocardiogr 2010;23:1090–98.
 Cardiovascular Innovations and Applications2017年1期
- Cardiovascular Innovations and Applications的其它文章
- Inherited Cardiomyopathies: Genetics and Clinical Genetic Testing
- Rationale and Design of the Randomized Controlled Trial of Intensive Versus Usual ECG Screening for Atrial Fibrillation in Elderly Chinese by an Automated ECG System in Community Health Centers in Shanghai(AF-CATCH)
- Clinical Utility of Amlodipine/Valsartan Fixed-Dose Combination in the Management of Hypertension in Chinese Patients
- The Effect of Home-Based Cardiac Rehabilitation on Functional Capacity,Behavior, and Risk Factors in Patients with Acute Coronary Syndrome in China
- Depression, Anxiety, and Cardiovascular Disease in Chinese: A Review for a Bigger Picture
- Catheter Ablation of Atrial Fibrillation:Where Are We?