
Relationship Between Morning Hypertension and T-Peak to T-End Interval in Patients with Suspected Coronary Heart Disease
2017-05-23 08:44:07LiliWeiMDDatunQiMDPhDYongenShiMDChuanyuGaoMDPhDandWeiliLiuMD
Lili Wei, MD, Datun Qi, MD, PhD, Yong’en Shi, MD, Chuanyu Gao, MD, PhD and Weili Liu, MD
1Department of Cardiology, Zhengzhou University People’s Hospital, Zhengzhou, Henan 450000, China
Introduction
Morning hypertension (MH) prevails in 21.5%of the population older than 65 years on the basis of an investigation of 15,618 patients [1], and has been a significant predictor of cardiovascular events and target organ damage [2]. Normal blood pressure exhibits circadian rhythm, and systolic and diastolic blood pressures are 10–20% higher during awakening than during sleep [3]. Morning blood pressure is de fined as the results of home blood pressure monitoring or the ambulatory blood pressure recorded within 2 h after wake up or blood pressure from 6:00 a.m. to 10:00 a.m., and the criterion of MH based on home blood pressure monitoring is 135/85 mmHg or greater or an average blood pressure in the morning of 135/85 mmHg or greater [4, 5].
The peak to the end of the T wave (T-peak to T-end interval, Tp-e interval) is a novel index to predict sudden cardiac death and an index for ventricular repolarization dispersion [6]. Pierdomenico et al.[7] reported that the severity of coronary artery disease is positively correlated with Tp-e interval. MH as assessed by ambulatory blood pressure monitoring or home blood pressure measurements is significantly associated with cardiovascular events in adults [2]. However, the impact of MH on Tp-e interval remains unclear.
Kaneda et al. [8] found that MH causes a certain degree of ventricular remodeling and ventricular hypertrophy. Structural remodeling is accompanied by electrical remodeling, including great changes in the expression of voltage-gated depolarizing and repolarizing ionic currents, which results in decreased cardiomyocyte repolarization capacity and inconsistent ventricular muscle contractions,which would increase transmutable repolarization dispersion and influence Tp-e interval [8]. Here we aimed to investigate the relationship between MH and Tp-e interval.
Methods
Study Participants
We prospectively analyzed data collected from Henan Provincial People’s Hospital from October 1, 2015, to April 1, 2016. The inclusion criteria were as follows: (1) patients older than 50 years;(2) typical symptoms of angina pectoris, heart palpitations, and chest tightness; (3) admission diagnosis of coronary heart disease, including stable coronary heart disease or acute coronary syndrome; (4) normal heart function. We excluded patients with a history of hypertension, arrhythmias, heart failure, diabetes, percutaneous coronary intervention, coronary artery bypass graft,renal insufficiency, or obstructive sleep apnea syndrome. Informed consent was obtained from all patients.
Collection of Baseline Characteristics
The following clinical characteristics were collected: age, gender, smoking status, drinking status,body mass index (BMI), heart rate, fasting blood glucose (FBG) level, triglyceride level, total cholesterol level, high-density lipoprotein cholesterol(HDL-C) level, low-density lipoprotein cholesterol(LDL-C) level, and serum creatinine level.
Measurement of Blood Pressure
According to the results of ambulatory blood pressure monitoring, we calculated the average morning systolic blood pressure (MSBP) and morning diastolic blood pressure (MDBP) from 6:00 a.m. to 10:00 a.m. The patients were divided into an MH group (average blood pressure ≥135/85 mmHg)and a morning normotension (MN) group according to the US and European guideline recommendations [9].
Electrocardiography
Standard 12-lead electrocardiograms were recorded by 24-h Holter monitoring. The QT intervals of leads V1-V5 were measured from the beginning of the QRS complex to the end of the T wave. The corrected QT (QTc) interval was obtained with Bazett’s formula (QTc interval=QT interval/√RR interval) [10]. Tp-e interval was measured from the peak to the end of the T wave.The end of the T wave was de fined as the intersection of the tangent to the downslope of the T wave and isoelectric line [11].
Echocardiography
All patients were examined by two-dimensional echocardiography. Left ventricular end-diastolic diameter (LVDd), interventricular septum thickness (IVST), and left ventricular posterior wall thickness (LVPWT) were recorded. Left ventricular mass (LVM) and LVM index (LVMI)were calculated from the following formula:LVM=0.8×1.04[(LVDd+IVST+LVPWT)³-(LVDd)³]+0.6, where LVMI=LVM/body surface area. LVMI was used as an index of myocardial hypertrophy [12, 13].
Coronary Angiography
Coronary angiograms of the patients were obtained by two cardiologists with more than 10 years’experience. All patients underwent coronary angiography via the right radial artery. The coronary angiogram severity was evaluated by the Gensini score: Gensini score=stenosis score×localization score (Table 1) [14].
Statistical Analysis
All statistical analyses were performed with IBM SPSS Statistics version 22.0 (IBM, USA).Continuous variables were expressed as the mean±standard deviation and compared by thettest.Categorical variables were expressed as the number(and percentage) and compared by chi-square statistics. Pearson correlation was used for coefficients of correlation between Tp-e interval and other variables. Multivariate regression analysis was used to estimate the independent effects of various measures,including blood pressure, Gensini score, and LVMI,on Tp-e interval. P<0.05 was considered significant.
Results
Baseline Characteristics
As shown in Table 2, the 358 patients were divided into two groups: the MH group (n=170) and the MN group (n=188). There were no significant differences between the two groups in terms of age, sex, BMI,heart rate, FBG level, total cholesterol level, triglyceride level, HDL-C level, LDL-C level, serum creatinine level, and medication use(P>0.05). There were 180 normotensive patients and 178 untreated hypertensive patients according to ambulatory blood pressure monitoring. MSBP (152.56±16.18 mmHg vs.119.45±11.53 mmHg,P<0.001), MDBP (88.22±11.11 mmHg vs. 76.86±9.89 mmHg,P<0.001), LVMI(121.42±10.97 g/m2vs.105.63±17.10 g/m2, P<0.001),and Gensini score (72.12±32.90 vs. 39.47±29.32,P<0.001) were significantly different between the MH group and the MN group. Electrocardiography showed that Tp-e interval (84.52±14.77 msvs.65.19±19.03 ms, P<0.001) and QTc interval(416.21±29.59 ms vs. 401.70±36.10 ms, P<0.001)were significant longer in the MH group than in the MN group. Coronary stenosis was more serious in the MH group. There were more patients with twovessel disease (17.32% vs. 12.29%, P=0.007) and three- vessel disease (13.41% vs. 8.38%, P=0.005) in the MH group, but more patients with normal vessels(1.96% vs. 7.82%, P<0.001), coronary thrombosis(2.51% vs. 6.70%, P=0.02) and single-vessel disease(12.29% vs. 17.32%, P=0.14) in the MN group.
Pearson Correlation Coefficients Between Baseline Characteristics and Tp-e Interval
Table 3 shows the univariate correlations between Tp-e interval and several clinical variables. MSBP(r=0.678, P<0.001), MDBP (r=0.404, P<0.001),LVMI (r=0.640, P<0.001), and Gensini score(r=0.517,P<0.001) were positively correlatedwith Tp-e interval after adjustments for age, sex,BMI, serum creatinine level, and blood lipid level. A scatter plot is shown in Figure 1. Heart rate, BMI, FBG level, total cholesterol level, and HDL-C level were negatively correlated with Tp-e interval.
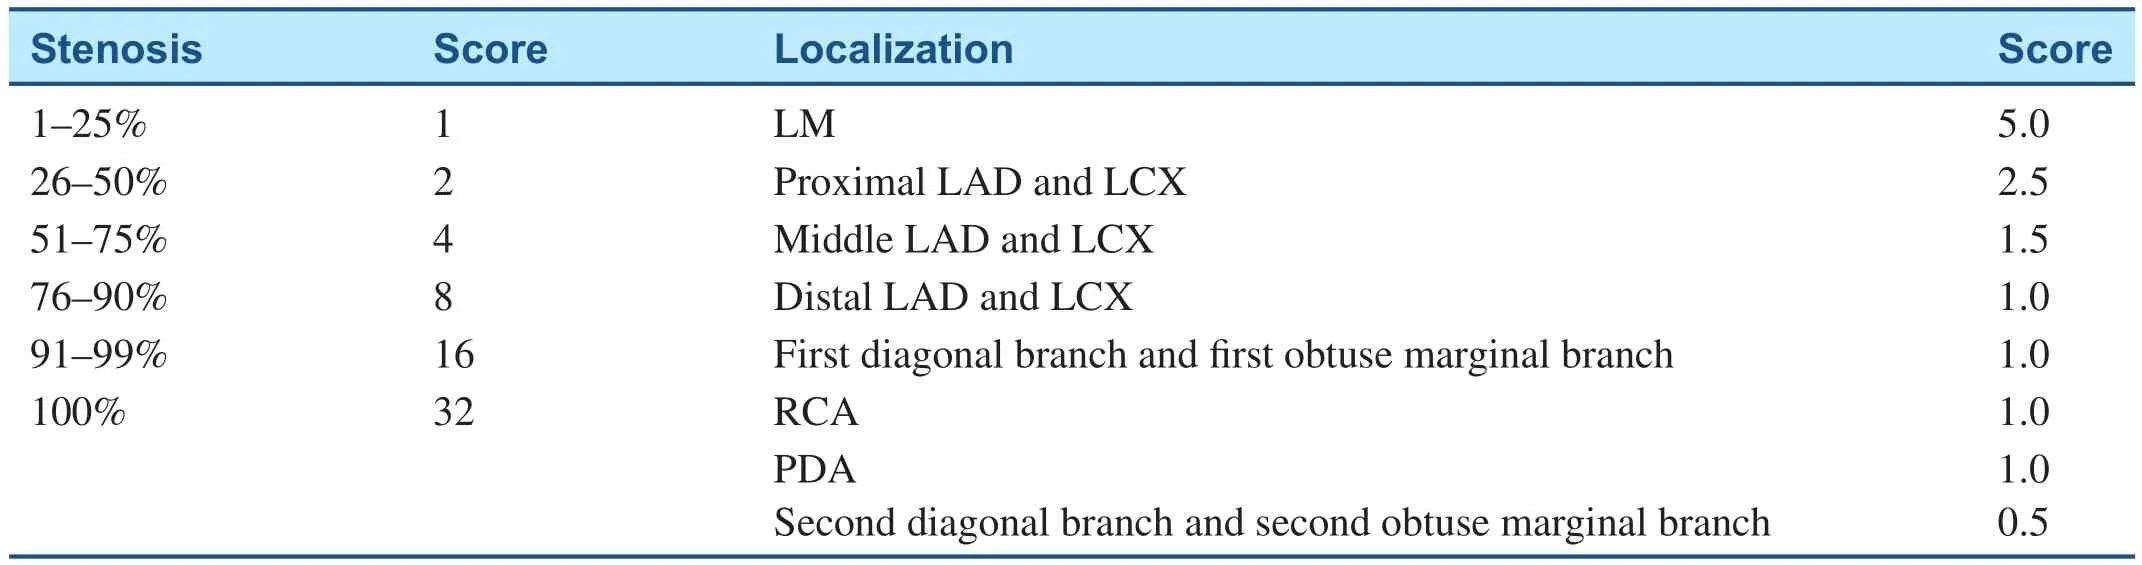
Table 1 Gensini Scoring.
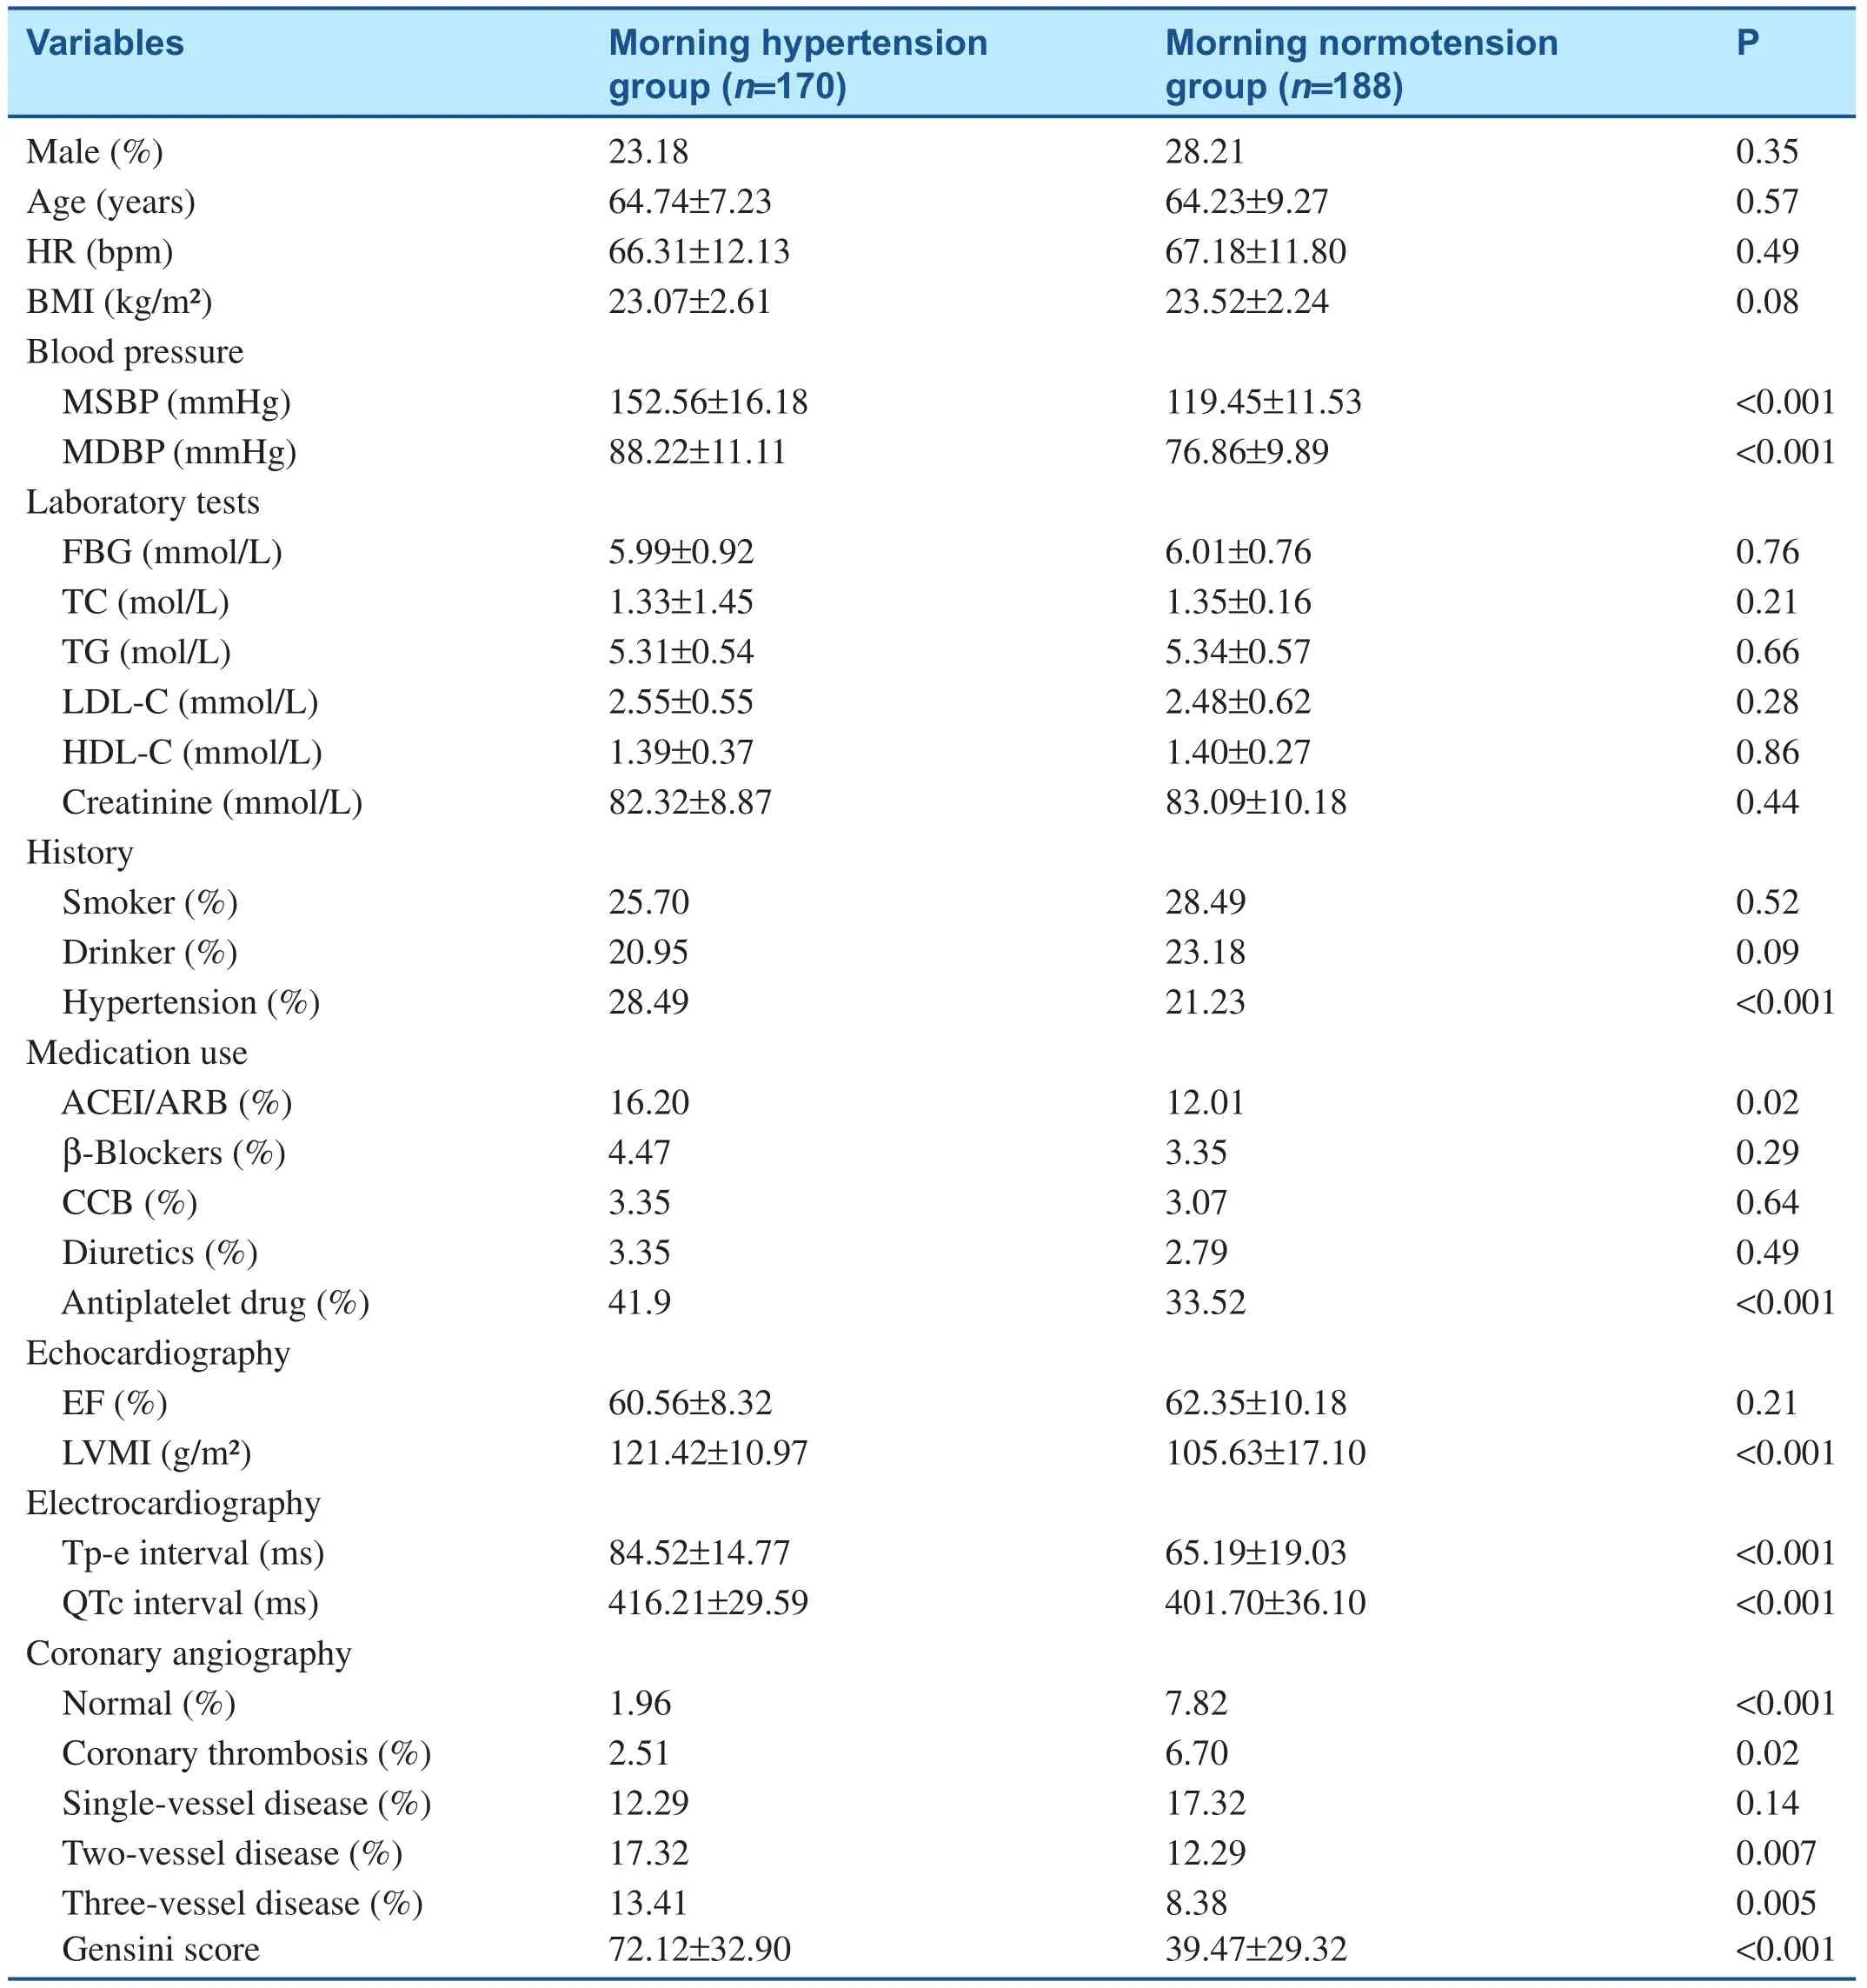
Table 2 Baseline Characteristics.

Table 3 Pearson Correlation Coefficients Between Baseline Characteristics and T-peak to T-end Interval.
Multivariate Predictors for Tp-e Interval Correlation with MSBP, MDBP, Gensini Score, and LVMI
As shown in Table 4, Tp-e interval was affected by MSBP (F=0.331, P<0.001), LVMI (F=0.466,P<0.001), and Gensini score (F=0.088, P<0.001).MSBP was the most important factor affecting Tp-e interval according to the standardized coefficients.R2suggested that the three independent variables could explain 45.8% of the variation of Tp-e interval, indicating that the final model fitted the data well.
Discussion
We found that morning blood pressure was positively correlated with Tp-e interval, after adjustment for confounding factors, including age, sex, BMI, blood lipid level, and smoking. LVMI and coronary artery lesion were also closely related to Tp-e interval.MH refers to average blood pressure in the morning greater than 135/85 mmHg. Since blood pressure increases in the morning, this kind of increase is related to target organ damage and cardiovascular events [4, 5]. Matsui et al. [15] showed that patients with MH have left ventricular hypertrophy and their left ventricular hypertrophy index is also higher than that in individuals with normal morning blood pressure. Repolarization time increases in hypertrophied myocytes, the repolarization time from epicardium to endocardium is extended. The repolarization time increases from epicardial to endocardia when the left ventricular hypertrophy index is high and the dispersion of ventricular repolarization is increased,so Tp-e interval increases in the electrocardiogram[16]. Our study also showed that the MH group had higher LVMI and a prolonged Tp-e interval.Correlation analysis showed that LVMI is positively correlated with Tp-e interval.
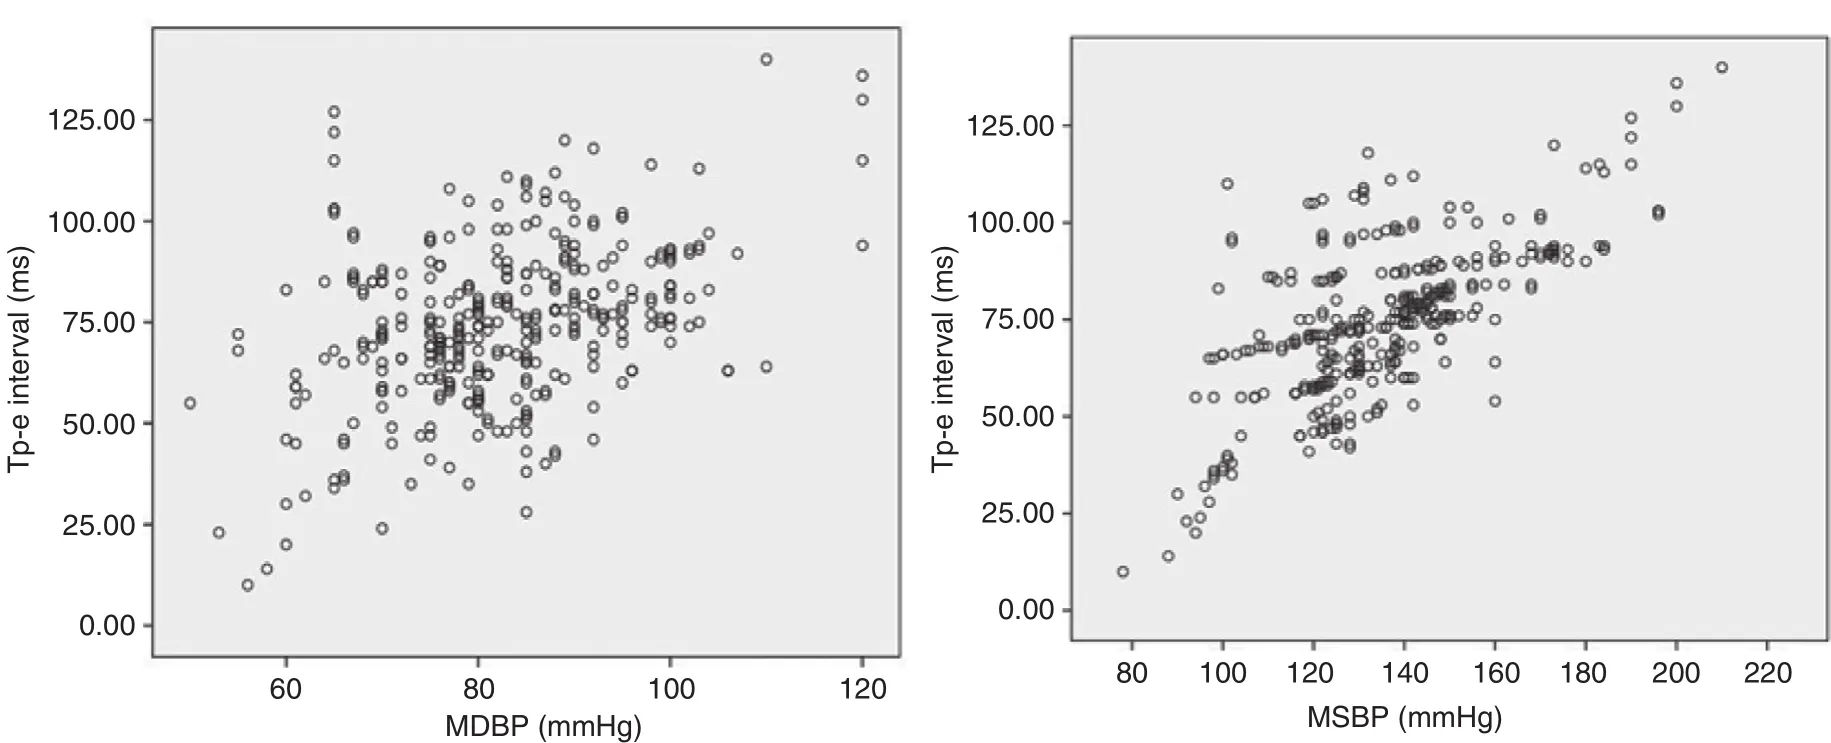
Figure 1 Scatter Plots of T-peak to T-end Interval (Tp-e Interval) in Morning Systolic Blood Pressure (MSBP) and Morning Diastolic Blood Pressure (MDBP).
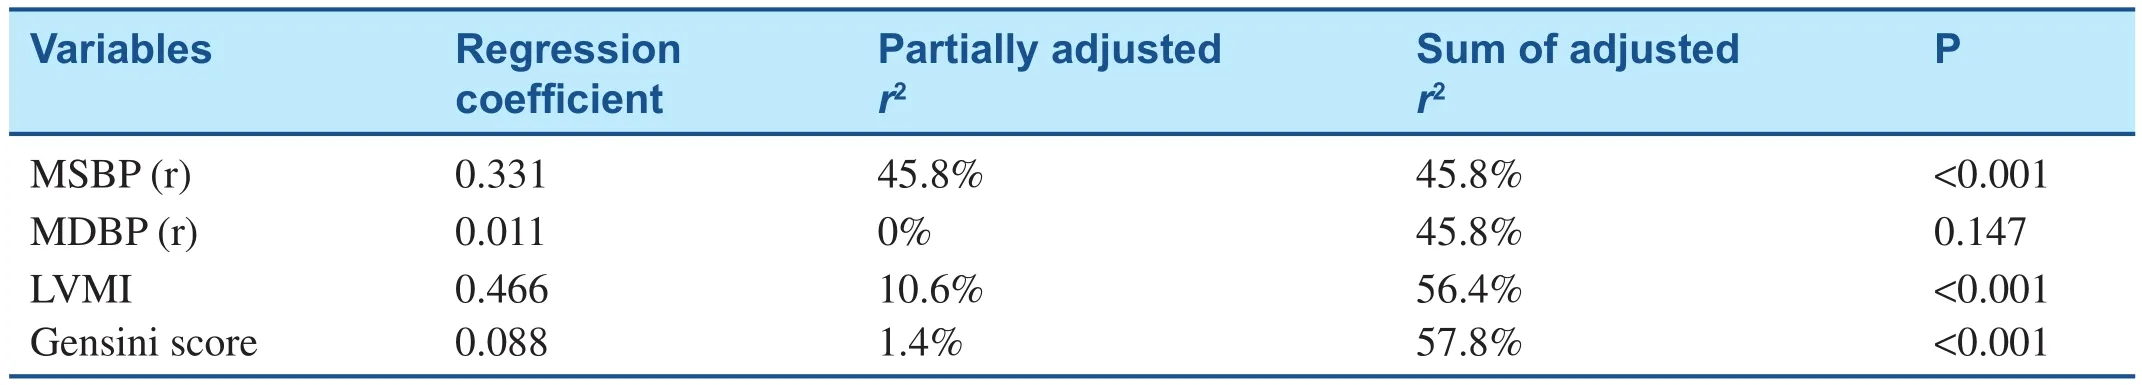
Table 4 Multivariate Predictors for T-peak to T-end Interval Correlation with Morning Systolic Blood Pressure, Morning Diastolic Blood Pressure, Gensini Score, and Left Ventricular Mass Index.
Pierdomenico et al. [17] showed that MH is a risk factor for coronary heart diseases. Bachmannet al.[6] reported that the degree of coronary stenosis is greater and the Tp-e interval is longer in MH patients[6]. Haarmark et al.[16] showed that in myocardial infarction patients who undergo percutaneous coronary intervention (PCI), pre-PCI Tp-e interval predicted post-PCI all-cause mortality [16]. So, Tp-e interval is prolonged by left ventricular hypertrophy or coronary ischemia. Our results showed that the severity of coronary artery stenosis was greater and the Gensini score was higher in the MH group, both of which were positively correlated with Tp-e interval. Therefore the rate of cardiovascular events will not be reduced if morning MH is not controlled [2,17]. The metabolic and electrochemical changes that occur during myocardial ischemia include alterations of tissue oxygen levels, pH, and intercellular and intracellular electrochemical gradients. Action potential duration in the ischemic zone increases slightly.This is caused by the reductions of transmembrane potential, action potential amplitude, and upstroke velocity, resulting in repolarization dispersion and increased Tp-e interval that is arrhythmogenic [18].
Although the mechanisms by which MSBP is associated with Tp-e interval remain unclear, it is known that neurohumoral activation of the sympathetic nervous system and the renin-angiotensin system results in an increase cortisol production in the morning and elevation of morning blood pressure [19–21]. This phenomenon is also affected by various psychological and physical stress conditions [22]. In normal individuals, the blood pressure reduces by 10–20% at night compared with the mean value in the daytime, and the renin-angiotensin-aldosterone system is activated to produce renin and angiotensin II in the morning [3].
This phenomenon is a physiological adjustment to compensate for the change from sleep to wake in healthy individuals, but excessive compensation leads to target organ damage, such as left ventricular myocardial hypertrophy [2, 8]. In our study, LVMI increased in patients with MH and was positivity correlated with morning blood pressure. Ikeda et al.[23] reported that the rise of morning blood pressure is a dominant predictor of left ventricular hypertrophy. Kaneda et al. [8] showed that high morning blood pressure leads to ventricular remodeling,ventricular hypertrophy, and subsequently transmural electrical heterogeneity. Similar to their study results, we also discovered that LVMI was related to Tp-e interval [24–26]. Tp-e interval has been used as a noninvasive index of transmural repolarization dispersion to reflect a difference between the longest action potential duration across the ventricular wall[27, 28]. Left ventricular hypertrophy affects action potentials of cardiomyocytes in various manners,facilitates the inconsistent ventricular repolarization of hypertrophy myocyte, increases ventricular repolarization dispersion, and prolongs the Tp-e interval and increases repolarization parameters [24].
Both Tp-e interval and QT interval reflect ventricular repolarization dispersion. QTc interval was also significantly increased in patients with MH and correlated with LVMI in our study. QT interval is an index highly correlated with sudden cardiac death. Our results showed that QTc interval was extended in the MH group and was related to morning blood pressure. However, prolonged Tp-e interval was significantly and independently associated with increased risk of sudden cardiac death.QTc interval is either normal or less reliable owing to prolonged QRS duration or at higher heart rates[29]. Furthermore, there was a strong correlation between Tp-e interval and global dispersion of repolarization during sympathetic nerve stimulation[30]. This indicates that an increase of Tp-e interval may be a reflection of increased sympathetic nerve activation, which is reported to increase the risks of arrhythmias and sudden cardiac death [31, 32]. So,proactive morning blood pressure control delays the development of ventricular hypertrophy.
Morning blood pressure remains the blind spot of blood pressure management, although in recent years great achievements have been made in the diagnosis and treatments of hypertension. Ishikawa et al. [33] con firmed that 60% of patients with clinically measured blood pressure are under control, but morning blood pressure is not effectively controlled.Therefore we should actively control morning blood pressure and use long-acting antihypertensive drugs in patients with coronary heart disease.
Limitations
Firstly, we could not record how Tp-e interval was changed after the taking of antihypertension drugs and percutaneous coronary intervention. Secondly,morning blood pressure is affected by other factors, such as race, and is reported to be higher in the Japanese population than the US population and the European population [34, 35]. Thirdly, since this was a single-center study, the findings should be con firmed in larger simple and multicenter trials.
Acknowledgment
The authors thank Hongxing Luo, from Zhengzhou University People’s Hospital, for critical revision during the manuscript’s writing.
Declaration
All authors sufficiently participated in and take public responsibility for the design, data collection,statistical analysis, and data interpretation.
Conflict of Interest
The authors declare that they have no conflicts of interest.
REFERENCES
1. Redon J, Bilo G, Parati G, SURGE Steering Committee. Home blood pressure control is low during the critical morning hours in patients with hypertension: the SURGE observational study. Fam Pract 2012;29(4):421–6.
2. Asayama K, Ohkubo T, Kikuya M, Obara T, Metoki H, Inoue R, et al. Prediction of stroke by home “morning” versus “evening” blood pressure values: the Ohasama study. Hypertension 2006;48(4):737–43.
3. Pickering TG, Harsh field GA,Kleinert HD, Blank S, Laragh JH. Blood pressure during normal daily activities, sleep, and exercise.Comparison of values in normal and hypertensive subjects. J Am Med Assoc 1982;247(7):992–6.
4. Kario K, Ishikawa J, Pickering TG,Hoshide S, Eguchi K, Morinari M, et al. Morning hypertension: the strongest independent risk factor for stroke in elderly hyper tensive patients. Hypertens Res 2006;29(8):581–7.
5. Kario K. Morning surge in blood pressure and cardiovascular risk: evidence and perspectives.Hypertension 2010;56(5):765–73.
6. Bachmann TN, Skov MW,Rasmussen PV, Graff C,Pietersen A, Lind B, et al.Electrocardiographic Tpeak-Tend interval and risk of cardiovascular morbidity and mortality: results from the Copenhagen ECG study.Heart Rhythm 2016;13(4):915–24.
7. Pierdomenico SD, Pierdomenico AM, Cuccurullo F. Morning blood pressure surge, dipping, and risk of ischemic stroke in elderly patients treated for hypertension. Am J Hypertens 2014;27(4):564–70.
8. Kaneda R, Kario K, Hoshide S,Umeda Y, Hoshide Y, Shimada K.Morning blood pressure hyperreactivity is an independent predictor for hypertensive cardiac hypertrophy in a community-dwelling population. Am J Hypertens 2005;18(12 Pt 1):1528–33.
9. James PA, Oparil S, Carter BL, Cushman WC, Dennison-Himmelfarb C, Handler J, et al. 2014 Evidence-based guideline for the management of high blood pressure in adults: report from the panel members appointed to the Eighth Joint National Committee (JNC 8). J Am Med Assoc 2014;311(5):507–20.
10. Goldenberg I, Moss AJ, Zareba W. QT interval: how to measure it and what is “normal”. J Cardiovasc Electrophysiol 2006;17(3):333–6.
11. Zehir R, Karabay CY, Kalaycı A,Akgün T, Kılıçgedik A, Kırma C.Evaluation of Tpe interval and Tpe/QT ratio in patients with slow coronary flow. Anatol J Cardiol 2015;15(6):463–7.
12. Matsui Y, Eguchi K, Shibasaki S,Shimizu M, Ishikawa J, Shimada K, et al. Association between the morning–evening difference in home blood pressure and cardiac damage in untreated hypertensive patients. J Hypertens 2009;27(4):712–20.
13. Mancia G, De Backer G,Dominiczak A, Cifkova R,Fagard R, Germano G, et al.2007 Guidelines for the management of arterial hypertension: the Task Force for the Management of Arterial Hypertension of the European Society of Hypertension(ESH) and of the European Society of Cardiology (ESC). J Hypertens 2007;25(6):1105–87.
14. Gensini GG. A more meaningful scoring system for determining the severity of coronary heart disease.Am J Cardiol 1983;51:606.
15. Matsui Y, Eguchi K, Shibasaki S,Ishikawa J, Shimada K, Kario K.Morning hypertension assessed by home monitoring is a strong predictor of concentric left ventricular hypertrophy in patients with untreated hypertension. J Clin Hypertens(Greenwich) 2010;12(10):776–83.
16. Haarmark C, Hansen PR, Vedel-Larsen E, Pedersen SH, Graff C,Andersen MP, et al. The prognostic value of the Tpeak-Tend interval in patients undergoing primary percutaneous coronary intervention for ST-segment elevation myocardial infarction. J Electrocardiol 2009;42(6):555–60.
17. Pierdomenico SD, Pierdomenico AM, Di Tommaso R, Coccina F, Di Carlo S, Porreca E, et al. Morning blood pressure surge, dipping, and risk of coronary events in elderly treated hypertensive patients. Am J Hypertens 2016;29(1):39–45.
18. Burton FL, Cobbe SM. Dispersion of ventricular repolarization and refractory period. Cardiovasc Res 2001;50:10.
19. Linsell CR, Lightman SL,Mullen PE, Brown MJ, Causon RC. Circadian rhythms of epinephrine and norepinephrine in man. J Clin Endocrinol Metab 1985;60(6):1210–5.
20. Kawasaki T, Cugini P, Uezono K,Sasaki H, Itoh K, Nishiura M, et al.Circadian variations of total renin,active renin, plasma renin activity and plasma aldosterone in clinically healthy young subjects. Horm Metab Res 1990;22(12):636–9.
21. Posener JA, Schildkraut JJ, Samson JA, Schatzberg AF. Diurnal variation of plasma cortisol and homovanillic acid in healthy subjects. Psychoneuroendocrinology 1996;21(1):33–8.
22. Kario K, James GD, Marion R,Ahmed M, Pickering TG. The influence of work- and home-related stress on the levels and diurnal variation of ambulatory blood pressure and neurohumoral factors in employed women. Hypertens Res 2002;25(4):499–506.
23. Ikeda T, Tomoko GO, Shibuya Y,Matsuo K, Kosugi T, Nami OK,et al. Morning rise in blood pressure is a predictor of left ventricular hypertrophy in treated hypertensive patients. Hypertens Res 2004;27(12):939–46.
24. Shipsey SJ, Bryant SM, Hart G.Effects of hypertrophy on regional action potential characteristics in the rat left ventricle: a cellular basis for T-wave inversion? Circulation 1997;96(6):2061–8.
25. McIntosh MA, Cobbe SM, Kane KA, Rankin AC. Action potential prolongation and potassium currents in left-ventricular myocytes isolated from hypertrophied rabbit hearts. J Mol Cell Cardiol 1998;30(1):43–53.
26. Wolk R, Sneddon KP, Dempster J, Kane KA, Cobbe SM, Hicks MN. Regional electrophysiological effects of left ventricular hypertrophy in isolated rabbit hearts under normal and ischaemic conditions. Cardiovasc Res 2000;48(1):120–8.
27. Yan GX, Antzelevitch C. Cellular basis for the normal T wave and the electrocardiographic manifestations of the long-QT syndrome.Circulation 1998;98(18):1928–36.
28. Shimizu W, Antzelevitch C.Cellular and ionic basis for T-wave alternans under long-QT conditions.Circulation 1999;99(11):1499–507.
29. Chua KC, Nair SG, Chugh SS. Risk markers of sudden death on the 12-lead ECG: Tpeak-Tend interval makes the cut. Heart Rhythm 2015;12(8):1798–9.
30. Yagishita D, Chui RW, Yamakawa K, Rajendran PS, Ajijola OA,Nakamura K, et al. Sympathetic nerve stimulation, not circulating norepinephrine, modulates T-peak to T-end interval by increasing global dispersion of repolarization. Circ Arrhythm Electrophysiol 2015;8(1):174–85.
31. Priori SG, Mantica M, Schwartz PJ. Delayed after depolarizations elicited in vivo by left stellate ganglion stimulation. Circulation 1988;78(1):178–85.
32. Vaseghi M, Zhou W, Shi J, Ajijola OA, Hadaya J, Shivkumar K, et al.Sympathetic innervation of the anterior left ventricular wall by the right and left stellate ganglia. Heart Rhythm 2012;9(8):1303–9.
33. Ishikawa J, Kario K, Hoshide S,Eguchi K, Morinari M, Kaneda R,et al. Determinants of exaggerated difference in morning and evening blood pressure measured by selfmeasured blood pressure monitoring in medicated hypertensive patients: Jichi morning hypertension reach (J-MORE) study. Am J Hypertens 2005;18(7):958–65.
34. Mansoor GA, White WB. Selfmeasured home blood pressure in predicting ambulatory hypertension. Am J Hypertens 2004;17(11 Pt 1):1017–22.
35. Den Hond E, Celis H, Fagard R,Keary L, Leeman M, O’brien E,et al. Self-measured versus ambulatory blood pressure in the diagnosis of hypertension. J Hypertens 2003;21(4):717–22.
 Cardiovascular Innovations and Applications2017年2期
- Cardiovascular Innovations and Applications的其它文章
- Occlusive Spasm of the Left Anterior Descending Artery and First Diagonal Branch After Implantation of Everolimus Eluting Stents Without Re-stenosis in a Female Patient with Resting Angina
- Chronic Kidney Disease is a New Target of Cardiac Rehabilitation
- Evaluation of Multidisciplinary Collaborative Care in Patients with Acute Coronary Syndrome and Depression and/or Anxiety Disorders
- Role of Cholesterol Crystals During Acute Myocardial Infarction and Cerebrovascular Accident
- Digoxin and Heart Failure: Are We Clear Yet?
- Telemedicine: Its Importance in Cardiology Practice. Experience in Chile