基于3D扫描技术的木材缺陷定量化分析
2017-05-16 02:28:56陈广胜
农业工程学报 2017年7期
赵 鹏,赵 匀,陈广胜
(1. 东北林业大学信息与计算机工程学院,哈尔滨 150040; 2. 东北农业大学工程学院,哈尔滨 150010)
基于3D扫描技术的木材缺陷定量化分析
赵 鹏1,赵 匀2,陈广胜1
(1. 东北林业大学信息与计算机工程学院,哈尔滨 150040; 2. 东北农业大学工程学院,哈尔滨 150010)
木材缺陷检测是有效进行木材分级提高木材使用率的重要途径之一,该文提出了一种基于3D激光扫描点云数据的木材缺陷探测与量化的方法。首先,使用Artec 3D Scanner扫描木材表面后获取3D点云数据,在对3D点云数据进行预处理后,通过比较当前点Z坐标值(深度值)与设置的阈值的大小关系判定读入的点云数据是否为缺陷点;其次,采用深度优先搜索算法对筛选保留的缺陷点进行分类,并且对各个缺陷使用不同的颜色进行标注;最后,再使用积分法计算各个缺陷处所占表面积和体积。试验结果表明,该方法可以比较精确的测量木材表面孔洞等凹陷的表面积和体积,相对误差在5%内,测量精度较高,可为后续的木材分级和合理定价提供定量依据。此外,该方法使用的Artec Scanner仪器质量轻体积小(标准质量为0.85 kg,尺寸为261 mm×158 mm×64 mm),它和笔记本电脑可以组成便携式的木材缺陷定量检测系统。该系统携带方便,可应用于林场、木材加工企业及木材进出口部门的现场测定。
光学测量;扫描;体积测量;缺陷检测;缺陷量化
赵 鹏,赵 匀,陈广胜. 基于3D扫描技术的木材缺陷定量化分析[J]. 农业工程学报,2017,33(7):171-176.doi:10.11975/j.issn.1002-6819.2017.07.022 http://www.tcsae.org
Zhao Peng, Zhao Yun, Chen Guangsheng. Quantitative analysis of wood defect based on 3D scanning technique[J]. Transactions of the Chinese Society of Agricultural Engineering (Transactions of the CSAE), 2017, 33(7): 171-176. (in Chinese with English abstract)doi:10.11975/j.issn.1002-6819.2017.07.022 http://www.tcsae.org
0 引 言
木材的生长周期缓慢,需求量较大,使用范围较广,而木材缺陷在一定程度上使木材质量受到影响,降低其使用率和加工效率,因而如何快速准确地对木材缺陷进行检测成为国内外学者研究的重要课题之一。对木材缺陷进行检测主要有定性和定量两类方法,定性方法多数采用人工法,检测人员通过观察木材表面纹理、色泽、构造特性、缺陷的类型等来进行木材分级[1]。但是,人眼主观的检测存在较大的主观误差与效率低等缺点,远远不能满足木材生产加工中缺陷检测质量分级的需要。21世纪以来,先进的自动化检测技术开始应用于木材加工的各个领域,探测木材缺陷的方法出现了核磁共振法、激光扫描法、光谱分析法、声学法等[2-5]。其中,激光扫描法和光谱分析法适用于木材表面的缺陷检测,而核磁共振法和声学法更适用于木材内部缺陷的探测。
在木材表面的外部缺陷检测中,光谱分析法主要是分类识别缺陷的种类(例如节子、虫眼、腐蚀和裂纹等);激光扫描法通过扫描木材表面获取表面的3D形状信息,可用于木材表面粗糙度测量等[6-7]。但是,使用木材表面信息进行凹陷类缺陷的定量分析仍然很少有文献报道。因此,本论文提出了一种针对常见的凹陷类缺陷(例如孔洞)进行定量测量的方法。首先将木材表面进行3D激光扫描,针对3D点云数据进行筛选和缺陷分类后,采用积分方式计算缺陷处所占表面积和体积,从而精确定量地测量出木材表面凹陷类缺陷的大小。
1 木材缺陷的3D扫描和处理
1.1 3D扫描
3D扫描技术以非接触式激光等方式为主,同时具有较高的测量精度与较快的扫描速度,能获取物体大量的点云数据,对物体的3D重建有很大的作用[8-10]。本文使用Artec 3D Scanner手持光栅扫描仪(参见图1)获取物体表面3D点云数据,它利用光栅发出的激光来完成扫描。
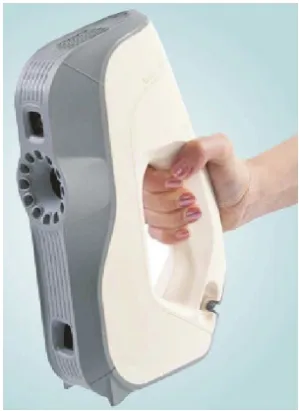
图1 Artec 3D Scanner手持光栅扫描仪Fig.1 Portable grating Artec 3D Scanner
它的原理和拍摄三维物体的设备相似,只需要对目标物体扫描一圈就能得到目标物体的三维信息,同时对物体的外形和表面纹理信息进行捕获。而且在扫描前不需要对物体表面轮廓进行标记和电磁跟踪定位,3D扫描分辨率达到0.5 mm,同时带有可调节闪光灯,质量轻且便于携带,还具有数据存储格式丰富等优点。
1.2 数据处理
本试验使用仪器配备的软件系统Artec Studio 9读取扫描仪的数据,并展示还原后的木材表面,然后把木材表面与坐标轴XOY平面校准,将木材表面存储成obj格式的文件,方便后续处理。
此外,使用Geomagic Studio 2013读取Artec Studio 9生成的obj文件,并将obj文件转换成按点坐标等性质输出的txt格式的文件。再使用Cyclone对处理程序输出的点云数据txt文件还原成三维模型进行展示,该软件读入点坐标X、Y、Z值,R、G、B值,在展示时起到测试程序正确性的作用,可以直观观察处理后点云数据的相关特征。图 2为木板经过手持光栅扫描仪进行扫描后,使用Artec Studio 9读取扫描数据,再使用Cyclone软件得到的预览展示。
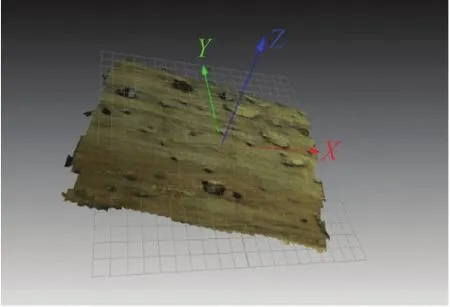
图2 Cyclone对木材表面的展示Fig.2 View of wood surface by Cyclone
1.3 缺陷分类
采用深度优先搜索方法对缺陷点进行区域分割,对已经通过点坐标Z值与阈值进行判定后筛选保留的点按照每个缺陷处进行划分标号,使构成同一个形如孔洞、裂缝等缺陷处的点被标记成相同序号,其算法流程图如图3所示。
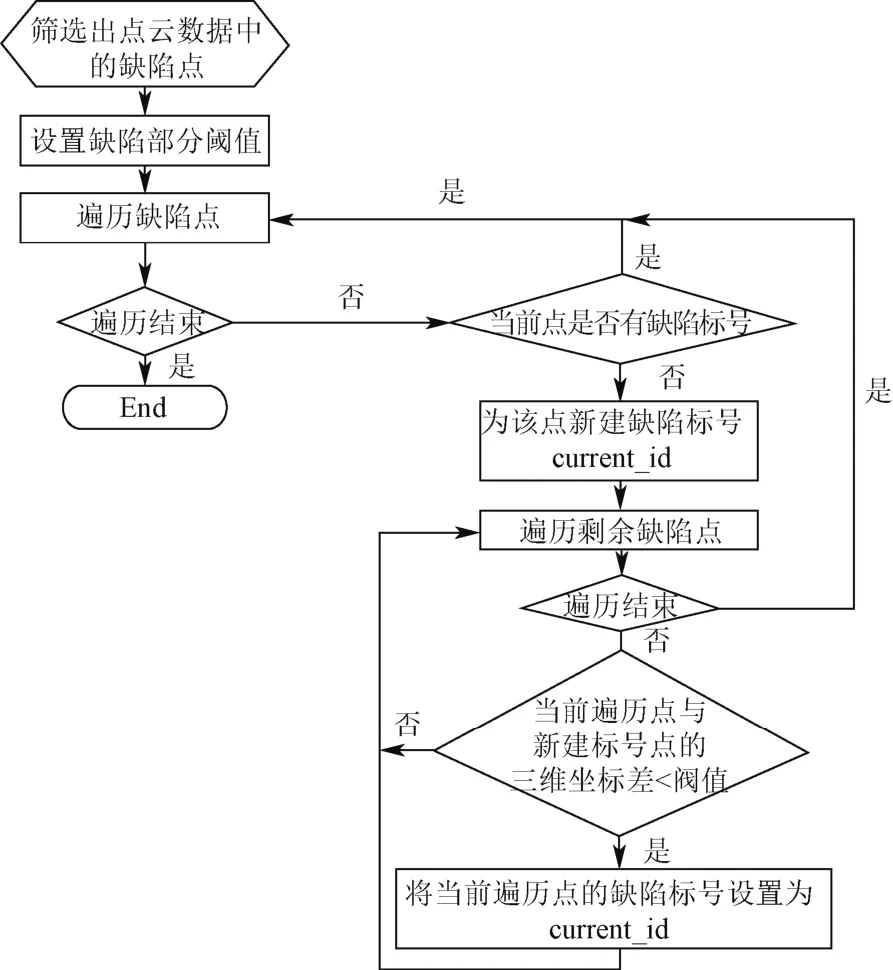
图3 缺陷分类的算法流程图Fig.3 Flow graph of defect classification
构成同一个缺陷处的点标记成同一序号后,选取不同的颜色对各个缺陷处进行染色,使同一个缺陷处内的缺陷点都使用同一种颜色进行标记,方便Cyclone软件进行直观显示以及后续缺陷处的定量计算。图 4展示了分类后的不同缺陷处的不同颜色。
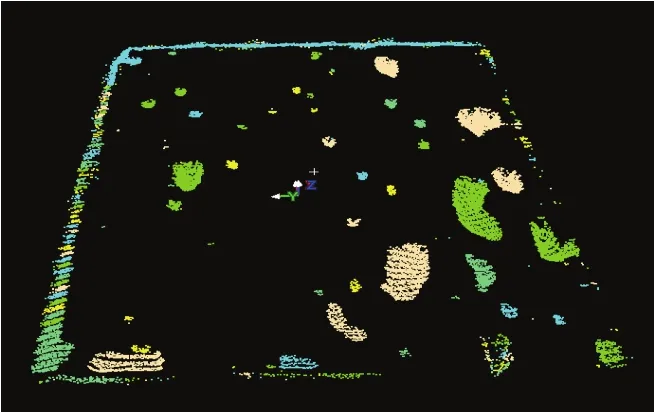
图4 Cyclone软件展示处理后的木板孔洞缺陷实例Fig.4 View of wood cavity defects by Cyclone
2 木材缺陷定量计算
采用积分法计算缺陷处的体积和表面积,需要将构成缺陷处的缺陷点扩张至 1个表面,每个缺陷点都是组成1个缺陷处的小三角面的顶点,如图5所示。近距离观察构成缺陷处的缺陷点,可以得出每 3个相邻缺陷点组成1个三角面,其中每个缺陷点又是6个三角面的顶点,所以表面模型选用正六边形如图6a所示。对于任意一缺陷点O,四周有A、B、C、D、E、F6个缺陷点与缺陷点O相邻。
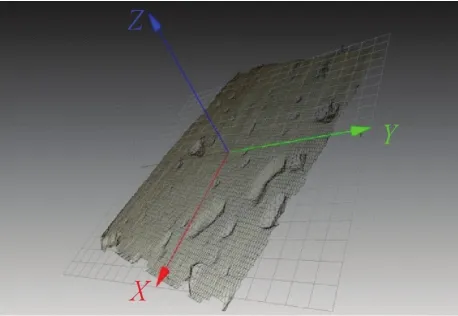
图5 木材表面忽略RGB、反射率的效果图Fig.5 View graph of wood surface without RGB and reflection information

图6 用于计算表面积和体积的积分法Fig.6 Integration method used for area and volume computations
关于表面模型的选择方式,这里分别对线段OA、OB、OC、OD、OE、OF做垂直平分线,两两交于点P、Q、R、S、N、T,连结PQ、QR、RS、SN、NT、TP形成小六边形,如图6b所示。假设点O为构成木板表面缺陷处的一个缺陷点,那么将该点扩大成图6b中紫色小六边形最为准确。同样的,与缺陷点O构成缺陷三角面的点A、B、C、D、E、F都可遵循缺陷点O的方式将一个点扩至一个小六边形。
公式(1)为缺陷点扩张至正六边形表面的面积(图6b中紫色小正六边形的面积S底),其中L为小正六边形平行对边距离的平均值,它实际是当前缺陷点O与其周围的点A~F距离Li的平均值。这样,各缺陷的表面积S即可通过累加的方式求出,如公式(2)。
如果以积分的方式来求体积,需要将点O扩张成一个底面来进行体积的计算,扩张方法与上面的表面积计算方法类似,只是图6b中的点O及周围点A~F都要求是各缺陷点在XOY平面上的投影点。当前点O形成的正六棱柱与相邻点A~F形成的正六棱柱不会存在重合部分,在 2个正六棱柱之间也不会出现间隙,用于体积计算具有较高精度(图6c)。正六棱柱的体积V正六棱柱为公式(3)所示,其中正六棱柱的高h就是该缺陷点三维坐标中的Z值的绝对值。各缺陷处的体积也是通过累加的方式求出,如公式(4)。在公式中,iL是第i个正六边形的平行对边距离的平均值(mm),n是正六边形的总数;iz是第i个正六棱柱的高ih。

3 试验结果与分析
3.1 物理试验
试验中,选取了大量的木材表面孔洞等凹陷类缺陷进行测量试验,参见图7。
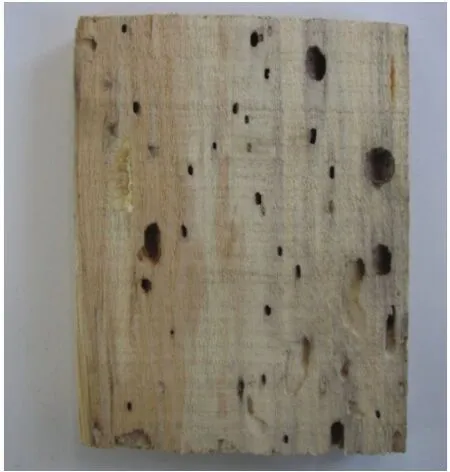
图7 处理的木材样本Fig.7 Processed wood specimen
首先,使用Artec 3D Scanner扫描仪获取木材表面3D点云数据,再通过上述算法计算得出各个缺陷处的体积、表面积等信息,最后使用Visual C++2005的控制台框架结构进行可视化显示,具体界面演示结果如图8所示。
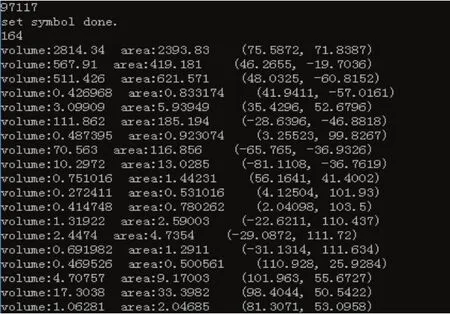
图8 各缺陷处的体积、表面积、坐标点输出Fig.8 Output of every defect’s volume, area and coordinates
3.2 模拟试验
为了客观地评价本文方法的测量精度,这里还进行了测量精度测试的模拟试验。选取表面无缺陷的标准优等木材,使用电钻在表面钻孔,钻出各种规格大小的圆柱形孔洞(该孔洞可以看作是标准圆柱体,其直径D为4~20 mm,深度H为1~7 mm)。使用本文方法进行扫描处理和数据计算,然后和标准的圆柱体表面积和体积公式算出的结果作比较。即可客观地求出本文方法的测量精度,具体结果参见表1和表2。可以看出,本文的测量精度随着圆柱形孔洞的深度增加而逐渐降低。这是因为误差主要来源于Artec 3D Scanner扫描仪的扫描误差,该仪器主要是进行物体表面的点云数据扫描。如果凹陷类缺陷的深度过大,则产生的扫描误差将增大,从而对后续的测量结果产生影响。但凹陷深度在3 mm以内,测量精度较好,相对误差能够控制在5%以内。
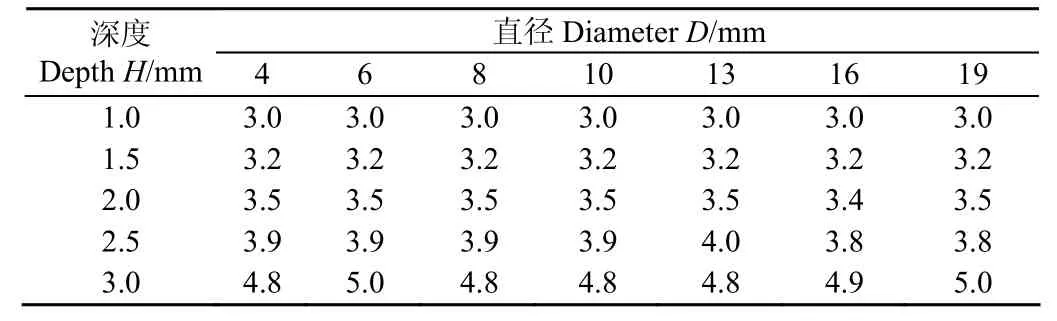
表1 圆柱形孔洞体积测量的相对误差Table1 Relative error of volume measurement for cylinder cavity %
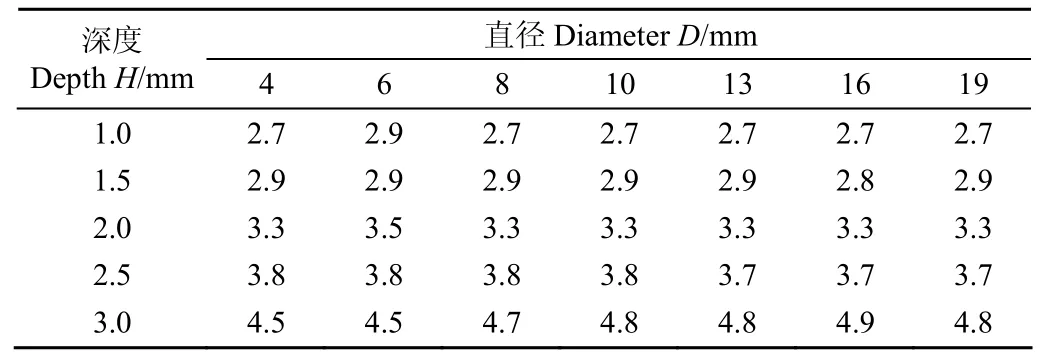
表2 圆柱形孔洞表面积测量的相对误差Table2 Relative error of area measurement for cylinder cavity %
4 讨 论
在影响木材缺陷测量精度的因素中,除了3.2节中提到的缺陷深度外,还应该注意1.2节的木材表面与坐标轴XOY平面校准问题。读入Artec Scanner扫描的数据后,正确的操作方式是在木板表面无缺陷处任意选 3个点,尽量保证每两点距离足够远,防止 3点形成面较小并且与坐标轴XOY面夹角过大从而造成误差。Artec Studio 9会根据选取的三点所构成的平面旋转至与坐标轴XOY面重合(参见图2)。
图8中的每一行记录是一个缺陷的体积、表面积和中心点坐标,如果把每行记录累加,就可以求出全部缺陷的总体积和总表面积。此外,需要进一步估算出被测木材的体积和表面积(如果被测木材是标准的长方体形状,那么表面积和体积可以使用简单的公式计算出来;如果被测木材形状不规则,那么可以用扫描仪扫描后得到的三角网模型使用三棱柱体积公式和海伦面积公式计算,并且累加求出被测木材的体积和表面积)。这样,就可以求出缺陷的表面积和体积所占的百分比。
实际上,Artec Scanner扫描获取的每一个数据点格式为(X,Y,Z,R,G,B,S),其中的R,G,B,S分别表示该点的红绿蓝颜色分量及反射率。因此,还可以使用BGR,, 颜色信息进行木材表面的颜色分类,采用主流的颜色矩特征、模糊分类特征等方法[11-14]。具体的方法可参考相关文献,这里不再论述。但是,在进行颜色分类时应该剔除掉木材表面的缺陷点,这样能够提高颜色分类精度。幸运的是,利用本文提出的凹陷类缺陷检测方法,可以准确的检测出孔洞等缺陷并且剔除掉它们,这样就排除了木材缺陷带来的干扰;这也是本文方法对于木材其他指标检测的贡献。
因此,应用Artec Scanner扫描仪和笔记本电脑,就可以开发一个便携式多功能木材质量检测系统,完成木材表面的颜色分级和孔洞等凹陷类缺陷检测,这也是今后的研发方向。
木材质量检测和分级是合理高效利用木材及合理定价的重要依据,检测的指标主要有木材树种分类识别[15-25]、木材物理性能参数预测[26-28](例如密度、含水率、表面粗糙度、抗拉强度等)及木材表面内部的缺陷检测。近年来,检测使用的主要方法有图像分析法和近红外光谱处理法等。近年来,三维激光扫描检测技术逐渐在工农业生产中得到应用,例如,2个典型实例是应用于粮仓中储粮的体积测量和滑坡堆积体体积测量[29-30]。本文探讨了它在林业工程方面的应用,针对木材表面的缺陷,提出了一种基于 3D激光扫描点云数据的木材凹陷类缺陷的定量测量处理方法,它能够对木板表面孔洞等各个缺陷进行划分与测量,求出各个缺陷的表面积和体积。进一步,如果估算出被测木材的体积和表面积,那么就可以求出缺陷的表面积和体积所占的百分比。这个指标对于后续的板材分级和定价具有重要意义,它给出了定量的指标依据。未来,随着3D扫描仪的精度的提高和价格的降低,这种测量处理方式有可能具有更高的精度和实际应用价值。
5 结 论
本文提出了一种基于 3D激光扫描点云数据的木材凹陷类缺陷的定量测量处理方法,它能够对木板表面孔洞等各个缺陷进行划分与测量,求出各个缺陷的表面积和体积。这种方法使用了先进的Artec激光扫描仪器,数据处理中还使用了深度优先搜索和三角剖分等技术。试验结果表明该方法的测量精度在一定范围内比较好,使用 3D点云数据能准确的对木板表面凹陷类缺陷进行探测与量化计算。如果缺陷深度在3 mm以内,测量精度还是比较好的,相对误差能够控制在5%以内。
[1] Kline D E, Surak C, Araman P A. Automated hardwood lumber grading utilizing a multiple sensor machine vision technology[J]. Computers and Electronics in Agriculture, 2003, 41(2): 139-155.
[2] Longuetaud F, Mothe F, Kerautret B, et al. Automatic knot detection and measurements from X-ray CT images of wood: a review and validation of an improved algorithm on softwood samples[J]. Computers and Electronics in Agriculture, 2012, 85(2): 77-89.
[3] Lebow P K, Brunner C C, Maristany A G, et al. Classification of wood surface features by spectral reflectance[J]. Wood and Fiber Science, 1996, 28(1): 74-90.
[4] Funck J W, Zhong Y, Butler D A, et al. Image segmentation algorithms applied to wood defect detection[J]. Computers and Electronics in Agriculture, 2003, 41(4): 157-179.
[5] Gao S, Wang N, Wang L H, et al. Application of an ultrasonic wave propagation field in the quantitative identification of cavity defect of log disc[J]. Computers and Electronics in Agriculture, 2014, 108(3): 123-129.
[6] 杨忠,刘亚娜,吕斌,等. 非接触式可见光近红外光谱法快速预测天然高分子材料表面粗糙度的研究[J]. 光谱学与光谱分析,2013,33(3):682-685. Yang Zhong, Liu Yana, Lü Bin, et al. Rapid prediction of surface roughness of natural polymer material by visible/near infrared spectroscopy as a non-contact[J]. Spectroscopy and Spectral Analysis, 2013, 33(3): 682-685 (in Chinese with English abstract)
[7] 刘亚娜,杨忠,吕斌,等. 木材表面光泽度的近红外漫反射光谱技术快速测定研究[J]. 光谱学与光谱分析,2014,34(3):648-651. Liu Yana, Yang Zhong, Lü Bin, et al. Study of rapid prediction of wood surface glossiness by near infrared spectroscopy[J]. Spectroscopy and Spectral Analysis, 2014, 34(3): 648-651. (in Chinese with English abstract)
[8] Remondino F. Heritage recording and 3D Modeling with Photo-grammetry and 3D Scanning[J]. Remote Sensing, 2011, 12(3): 1104-1138.
[9] Montagnat J, Delingette H, Ayache N. A review of deformable surfaces: Topology, geometry and deformation[J]. Image & Vision Computing, 2001, 19(14): 1023-1040.
[10] Luo Z Q, Liu X M, Su J H, et al. Deposit 3D modeling and application[J]. Journal of Central South University of Technology, 2007, 14(2): 225-229.
[11] Bombardier V, Schmitt E, Charpentier P. A fuzzy sensor for color matching vision system[J]. Measurement, 2009, 42(2): 189-201.
[12] Bombardier V, Mazaud C, Lhoste P, et al. Contribution of fuzzy reasoning method to knowledge integration in a wood defect recognition system[J]. Computers in Industry Journal, 2007, 58(5): 355-366.
[13] 戴天虹. 基于计算机视觉的木质板材颜色分类方法的研[D].哈尔滨:东北林业大学,2008. Dai Tianhong. Research on Classification Method of Wooden Board Color Based On Computer Vision[D]. Harbin: Northeast Forestry University, 2008. (in Chinese with English abstract)
[14] 于海鹏. 基于数字图像处理学的木材纹理定量化研究[D].哈尔滨:东北林业大学,2005. Yu Haipeng. Quantization of Wood Texture by Digital Image Processing[D]. Harbin: Northeast Forestry University, 2005. (in Chinese with English abstract)
[15] Moore A K, Owen N L. Infrared spectroscopic studies of solid wood[J]. Applied Spectroscopy Review, 2001, 36(1): 65-86.
[16] Packianather M S, Drake P R. Neural networks for classifying images of wood veneer[J]. International Journal of Advanced Manufacturing Technology, 2000, 16(6): 424-433.
[17] Nakamura M, Masuda M, Shinohara K. Multiresolutional image analysis of wood and other materials[J]. Journal of Wood Science, 1999, 45(1): 10-18.
[18] Phelps J E, Mcginnes E A. Growth-quality evaluation of black walnut wood, Part 2-Color analysis of veneer produced on different sites[J]. Wood and Fiber Science, 1983, 15(2): 177-185.
[19] Chen G S, Zhao P. Dynamic wood slice recognition using image blur information[J]. Sensors & Actuators A: Physical, 2012, 176(1): 27-33.
[20] Tsuchikawa S, Hirashima Y, Sasaki Y, et al. Near-infrared spectroscopic study of the physical and mechanical properties of wood with meso- and micro-scale anatomical observation[J]. Applied Spectroscopy, 2005, 59(1): 86-93.
[21] Orton C R, Parkinson D Y, Evans P D, et al. Fourier transform infrared studies of heterogeneity, photodegradation, and lignin/hemicellulose ratios within hardwoods and softwoods[J]. Applied Spectroscopy, 2004, 58(11): 1265-1271.
[22] Lavine B K, Davidson C E, Moores A J, et al. Raman spectroscopy and genetic algorithms for the classification of wood types[J]. Applied Spectroscopy, 2001, 55(8): 960-966.
[23] Piuri V, Scotti F. Design of an automatic wood types classification system by using fluorescence spectra[J]. IEEE Trans SMC-Part C, 2010, 40(3): 358-366.
[24] Zhao P, Cao J. Wood species identification using spectral reflection feature and optimal illumination radian design[J]. Journal of Forestry Research, 2016, 27(1): 219-224.
[25] Zhao P, Dou G, Chen G S. Wood species identification using feature-level fusion scheme[J]. Optik, 2014, 125(3): 1144-1148.
[26] Hauksson J B, Bergqvist G, Bergsten U, et al. Prediction of basic wood properties for Norway Spruce. Interpretation of near infrared spectroscopy data using partial least squares regression[J]. Wood Science and Technology, 2001, 35(2): 475-485.
[27] Schimleck L R, Evans R, Matheson A C. Estimation ofPinus radiataD. Don clear wood properties by near-infrared spectroscopy[J]. Journal of Wood Science, 2002, 48(2): 132-137.
[28] 王晓旭,黄安民,杨忠,等. 近红外光谱用于杉木木材强度分等的研究[J]. 光谱学与光谱分析,2011,31(4):975-978. Wang Xiaoxu, Huang Anmin, Yang Zhong, et al. Study on the wood grading by near infrared spectroscopy[J] Spectroscopy and Spectral Analysis, 2011, 31(4): 975-978. (in Chinese with English abstract)
[29] 邵晴,徐涛,吉野辰萌,等. 基于三维激光扫描技术的粮食储量监测系统的设计与试验[J]. 农业工程学报,2015,31(20):262-267. Shao Qing, Xu Tao, Yoshino Tatsuo, et al. Design and experiment for grain storage monitoring system based on 3-D laser scanning technology[J]. Transactions of the Chinese Society of Agricultural Engineering(Transactions of the CSAE), 2015, 31(20): 262-267. (in Chinese with English abstract)
[30] 陈展鹏,雷廷武,晏清洪,等. 汶川震区滑坡堆积体体积三维激光扫描仪测量与计算方法[J]. 农业工程学报,2013,29(8):135-144. Chen Zhanpeng, Lei Tingwu, Yan Qinghong, et al. Measuring and calculation methods for landslide volume with 3-D laser scanner in Wenchuan earthquake area[J]. Transactions of the Chinese Society of Agricultural Engineering (Transactions of the CSAE), 2013, 29(8): 135-144. (in Chinese with English abstract)
Quantitative analysis of wood defect based on 3D scanning technique
Zhao Peng1, Zhao Yun2, Chen Guangsheng1
(1.College of Information and Computer Engineering, Northeast Forestry University,Harbin,150040,China; 2.College of Engineering, Northeast Agricultural University,Harbin,150010,China)
Wood quality detection is a key issue in the wood manufacture factory or wood trade process. It consists of wood species recognition, wood physical parameter (such as density, hardness, water ratio, degree of surface roughness) prediction and wood defect detection, which are intimately connected with the efficient wood utilizations and wood prices. In the wood defect detection, the internal and external defects were inspected and processed with different schemes. It was an important way for effective wood grading and wood utilization to make the wood defect detection. In this paper, a detection and quantification scheme of wood defect was proposed based on three-dimensional (3D) laser scanning point cloud. This scheme could be used in the wood external defect detection such as cavity or tunnel. First, the Artec 3D Scanner was used to scan the wood surface to get the 3D point cloud. After preprocessing, theZ-axis coordinate value of current point was compared with the set threshold to judge whether it was a defect point. Second, a deep preferred search algorithm was used to classify the retained defect points marked with different colors. After this step, the segmented defects could be viewed with the Artec Cyclone software. Last, the integration algorithm was used to calculate the surface area and volume of every defect. In this step, every defect point was extended into a regular hexagon and a prism for the subsequent area and volume calculation by using the standard mathematical equations. The overall area or volume of every defect was computed by summarizing every defect point’s area or volume. One detection system was realized with Visual C++ programming tool, the Artec 3D Scanner and a laptop. The simulation experimental results indicated that our scheme could accurately measure the surface areas and volumes of cavity or tunnel on wood surface with measurement error of 5%, if the defect’s depth was less than 3 mm. This scheme could give the quantitative proofs for the subsequent wood grading and wood price. In fact, every 3D data point’s format was (X,Y,Z,R,G,B,S), in which theR,G,BandSrepresented the red, green, blue and reflection information, respectively. Therefore, we could use theR,GandBinformation to perform the color classification for the wood surface by use of color moments or fuzzy classification algorithms. However, the wood defect points should be deleted in color classification in order to overcome the disturbance from wood surface’s defect points. Fortunately, the deletion of defect points could be easily performed by use of our scheme, which was the advantage of our scheme compared to other wood parameter detection methods. Moreover, the used Artec Scanner was portable with small mass and volume (i.e. with a standard mass of 0.85 kg, a 3D scanning resolution of 0.5 mm, a size of 261 mm×158 mm×64 mm, and multiple data storage formats), so it could form a portable wood defect detection system with a laptop. In the future, with the development of 3D scanning instrumentation, the used 3D scanner can become more accurate with cheaper price, so our scheme may be conveniently used in wood manufacture factory or wood trade.
optical testing; scanning; volume measurement; defect detection; defect quantification
10.11975/j.issn.1002-6819.2017.07.022
TP391.4; TP242.6
A
1002-6819(2017)-07-0171-06
2016-08-29
2017-04-07
国家自然科学基金面上项目资助(31670717);黑龙江省自然科学基金面上项目资助(C2016011);教育部新世纪优秀人才专项资助(NCET-12-0809)。
赵 鹏,男(汉族),黑龙江省阿城市人,教授,博士,博士生导师,主要研究方向是图像处理、模式识别和光学测量,从事林业信息工程和农业信息工程的学科交叉研究。哈尔滨 东北林业大学信息学院,150040。
Email:bit_zhao@aliyun.com
猜你喜欢
建筑与预算(2024年2期)2024-03-22 06:51:36
大自然探索(2024年1期)2024-02-29 09:10:32
发明与创新(2023年30期)2023-10-11 01:37:12
小学生学习指导(高年级)(2023年3期)2023-03-31 06:03:22
小学生学习指导(高年级)(2022年3期)2022-03-29 07:49:16
军事文摘(2021年16期)2021-11-05 08:49:06
电子技术与软件工程(2021年7期)2021-06-16 09:35:48
收藏界(2019年3期)2019-10-10 03:16:22
小学生导刊(高年级)(2017年2期)2017-06-10 02:40:42
光学精密工程(2016年4期)2016-11-07 09:04:56