基于BP神经网络的玉米种植密度和施肥量优化
2017-04-24 03:47:54王福林董志贵吴志辉
农业工程学报 2017年6期
王福林,董志贵,吴志辉,方 堃
基于BP神经网络的玉米种植密度和施肥量优化
王福林,董志贵,吴志辉,方 堃
(东北农业大学工程学院,哈尔滨 150030)
为解决利用回归模型进行作物种植密度和施肥量优化时存在的拟合精度差和准确性低等问题,该文提出一种基于BP神经网络的优化方法。以玉米作物为研究对象,选取种植密度、施氮量、施磷量、施钾量为试验因素,玉米产量为影响指标,设计4因素5水平正交旋转试验方案进行田间试验,获取不同种植密度和施肥量水平下的玉米产量。利用BP神经网络模型对试验数据进行函数拟合,拟合后运用该文提出的优化方法获得试验条件下红星农场德美亚1号玉米最佳种植密度9.32×10⁴株/hm2、施N量139.5 kg/hm2、施P2O5量85.4 kg/hm2、施K2O量70.8 kg/hm2,该参数组合下玉米的最优产量为16 308.53 kg/hm2,高于二次回归模型优化得到的最高产量16 009.00 kg/hm2。以BP神经网络优化结果在试验区进行验证试验,获得试验方案下玉米产量为15 948.3 kg/hm2,试验与优化结果相对误差仅为−2.21%,表明该优化方法拟合函数精度高,优化结果准确,为解决农业生产领域中类似优化问题提供了一种可靠方法。
神经网络;回归分析;优化;玉米;产量;种植密度;施肥量
0 引 言
作物产量的影响因素包括遗传因素(品种特性)、环境因素(土壤、气候、病虫害)、栽培措施(种植密度、群体结构、田间管理、施肥量)[1-6]。同一区域内作物的种植环境、种植模式、耕作和灌溉方式、田间管理水平基本相同,种植密度、施肥量(包括N、P2O5、K2O)是对农作物产量贡献最大的因子[7-10]。已有研究[11-17]表明,提高施肥量和增加种植密度均是促进群体生长和增产的有效途径。但是,中国的农业生产尚属于粗放式管理水平,缺少完善的播种施肥理论指导农业生产,农业生产人员为提高玉米产量盲目的加大施肥量或增加种植密度,导致养分利用率低、生产成本增加、农业资源浪费等一系列问题。同时,长期不合理施肥还会导致土壤养分失衡,作物产量和品质下降,农业资源污染,生态环境破坏等一些严重后果[18]。因此,建立和完善解释作物产量与种植密度和施肥量之间相互关系的理论体系,构建产量与种植密度和施肥量的数学模型,寻找产量与种植密度和施肥量的最佳组合,是保障国家粮食安全和实施农业可持续发展战略面临的重大课题。以最佳的种植密度与施肥量组合进行农业生产活动,对保证农作物产量,节约农业生产资源,减轻农业面源污染,改善生态环境,提升作物品质[3]具有重要的意义。
目前,国内外有关作物产量与种植密度和施肥量的研究报道,多采用正交或正交旋转试验设计方法设计试验方案,获取产量与种植密度和施肥量的对应数据关系,利用最小二乘法进行参数估计,建立产量与种植密度和施肥量的非线性方程,然后利用方差分析法、单因素效应法、主效应和交互效应法分析试验结果,找出最佳种植密度和施肥量[19-24]。但是,这种方法具有明显的缺陷和局限性:1)近似计算产生的误差较大时影响回归模型的精度;2)在假设模型的基础上进行的回归,具有一定的局限性;3)多变量的变量替换难度较大;4)回归方程对样本数据的自带噪声处理能力较差。农业生产过程中,作物产量受多种因素的交互影响,种植密度、施肥量与产量之间的关系非常复杂,具有很强的非线性和黑箱特性,用传统的分析方法很难定量地描述它们之间的因果关系[25]。随着BP神经网络的成熟与发展,BP神经网络理论在农业工程领域广泛应用。张淑娟等[25]应用BP神经网络建立土壤含水率、有机质、全氮、碱解氮、速效磷、速效钾与作物籽粒质量之间的映射函数,分析作物产量与土壤空间分布信息关系,获得较好的结果。张漫等[26]利用BP神经网络建立空气温湿度、光照强度、 CO2浓度与净光合速率的映射函数,进行温室番茄CO2增施策略研究与预测,较精确地反映了番茄在不同CO2浓度生长环境下植株的动态变化规律。鞠金艳等[27-29]利用BP神经网络建立农机总动力与年份的映射函数进行农机总动力组合预测,精确地预测了农机总动力的发展趋势。理论与实际应用证明,BP神经网络模型适用于研究种植密度、施肥量与作物产量之间的函数关系,进而获取最优参数组合。
本文以玉米为研究对象,提出基于BP神经网络的优化方法,寻找玉米作物最佳的种植密度和施肥量。首先以二次正交旋转方法设计试验并获取田间试验数据;然后采用BP神经网络建立玉米产量的网络模型,逼近玉米产量与种植密度、施肥量的函数关系;拟合后采用BP神经网络的优化方法进行玉米种植密度和施肥量优化,并采用其他田间试验结果验证优化结果。
1 材料与方法
1.1 试验区概况
玉米产量与种植密度和施肥量的试验于2014年5月—2015年10月在黑龙江省农垦总局北安管局红星农场试验园区进行。试验区位于126°47´E、48°01´N,属中温带大陆性季风气候,年降水500~550 mm,≥10 ℃积温1 950~2 050 ℃,无霜期大约118 d,省属第四积温带。试验区面积为4 706.9 m2,地势平坦,土壤类型为漫岗黑土,质地为壤质黏土至黏土,前茬种植作物为马铃薯,土地肥力中上等,未做过施肥试验。试验前取耕层(0~20 cm)土壤样品进行理化性质分析[30],结果表明pH值为6.07,全氮为1.84 mg/kg,全磷为0.87 mg/kg,缓效钾693.71 mg/kg,速效钾176.35 mg/kg,速效磷37.63 mg/kg,破解氮为186.21 mg/kg,有机质为45.37 g/kg。试验区广泛种植的玉米品种为德美亚1号,生长期105~110 d。该品种在当地种植的经验值为播种量9.0×10⁴株/hm2,发芽率98%,种植密度为8.82×104株/hm2,施N量128 kg/hm2,施P2O5量92 kg/hm2,施K2O量70 kg/hm2。
1.2 试验设计及过程
为反映种植密度和施肥量对玉米产量的综合影响规律,选取种植密度、施N量、施P2O5量、施K2O量4个因素作为试验因素,玉米产量为响应指标,研究不同参数组合对玉米产量的影响,响应指标越大越好。运用二次正交旋转回归方法设计试验,各因素的0水平选取试验区德美亚1号种植的经验值,试验因素水平编码如表1所示。
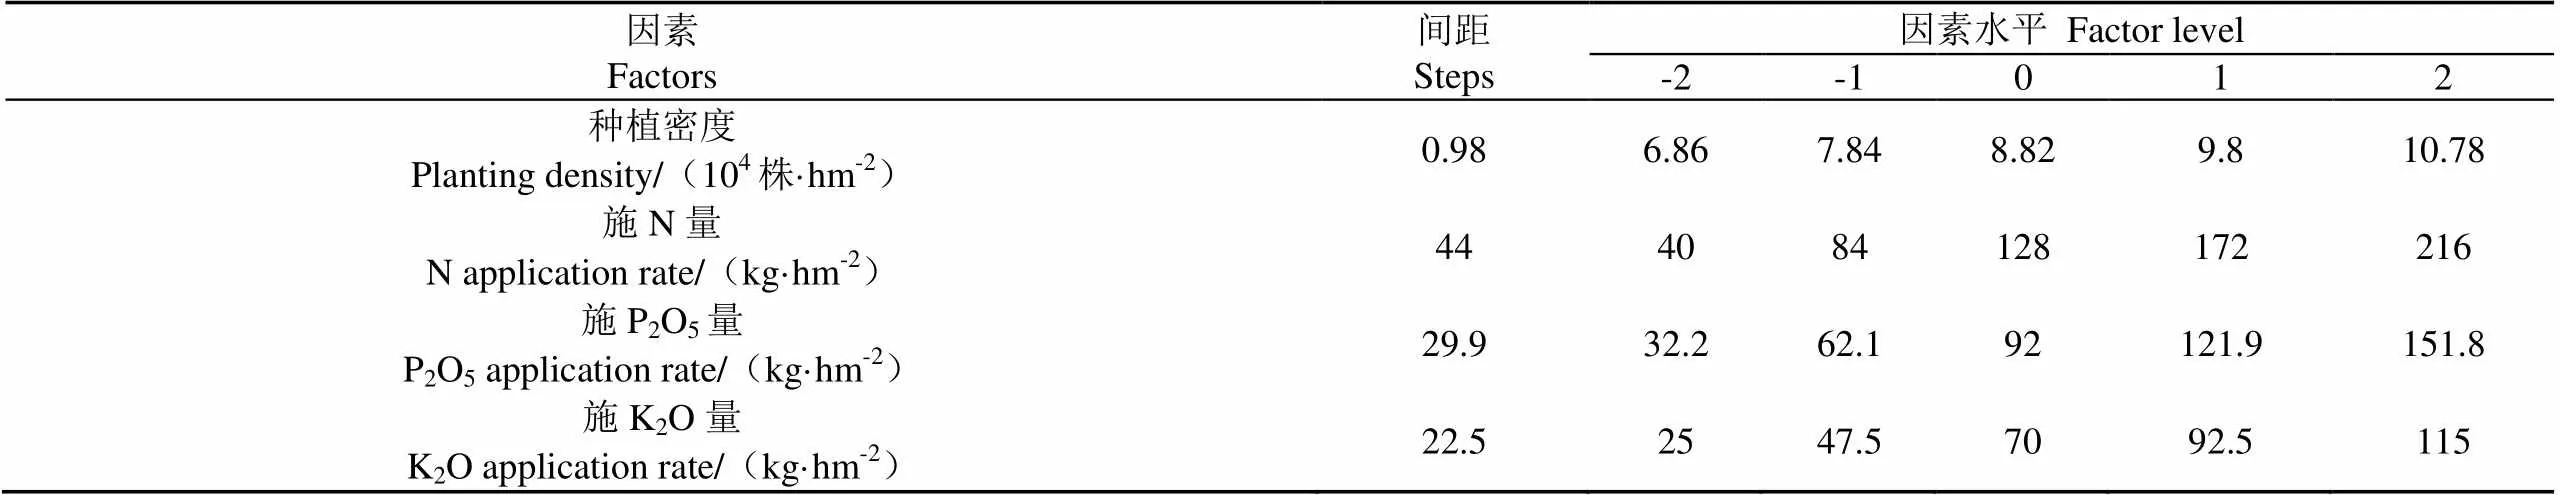
表1 二次正交旋转设计各因素水平编码表
试验共计36个处理,每个处理为1个小区,小区尺寸4.4 m×5 m,随机排列布置。小区内采用大垄双行种植模式,包含4垄8行,垄宽100 cm,垄高15 cm,相邻两垄中心间距110 cm,垄上行距40 cm,如图1所示。试验区四周设置保护区,小区间设置保护行和过道,保护行宽110 cm,过道宽110 cm。试验重复2次,2014年5月10日播种,9月23日收获;2015年5月12日播种,9月22日收获。试验期间无人工灌溉,2014年5-9月降雨量为471.4 mm,2015年5-9月降雨量为460.7 mm。
根据试验设计进行田间种植试验,试验过程中田间管理按当地玉米高产田间管理方法进行。成熟后每个小区(8行)人工收获、标识、烘干,按14%标准水测产,记录百粒数,称质量。试验方案与结果如表2所示,由于2 a试验数据结果变化趋势基本一致,本文试验结果为2 a试验数据的加权平均值(权重各为0.5)。

表2 试验方案与结果
注:*为处理25~36试验数据的平均值。
Note: * is mean of experimental results of treatment 25-36.
2 玉米种植密度和施肥量的BP神经网络模型
2.1 基于BP神经网络的优化方法简介
基于BP神经网络的优化方法分为BP神经网络模型的创建与训练和BP神经网络的全局优化。
BP神经网络模型的创建与训练:首先,确定模型的网络层数、每层神经元数量、传递函数、数据归一化区间,对网络各层权重与阈值进行初始化。然后,利用试验数据作为训练样本,对已构建的网络模型进行学习训练,当网络输出层所有神经元的误差能量总和满足期望精度时结束训练,保存网络的权值和阈值,完成输入与输出的非线性函数关系映射。
BP神经网络全局优化的基本思路:人为选取或随机产生1个初始可行点(0)(输入向量),然后求出(0)点的梯度,若(0)点的梯度为0,则(0)便是最优解。若(0)点的梯度不为0,则取1个步长,在(0)点的梯度方向上找1个点(1),若(1)不满足约束条件,则将步长减半,再重新求得1个点(2),若(2)仍不满足约束条件,则步长继续减半,直至()(表示迭代次数,且为大于0的整数)满足约束条件,然后检查步长是否为0,若为0,则()即为最优解,结束计算;若步长不为0,且()优于(0),则把()看成(0),完成1次迭代,然后从(0)出发,进行下一次迭代计算。若步长不为0,但()不优于(0),则继续减小步长,直至求得的(+)(为大于0的整数)优于(0),或满足迭代终止条件。若求得的(+)优于(0),则把(+)看成(0),完成1次迭代,然后从(0)出发,进行下一次迭代计算。
若(1)满足约束条件,且(1)优于(0),则加大步长,再求1个(2),若(2)仍满足约束条件,且优于(1),则继续加大步长,直至求得的()不优于(-1)或不满足约束条件为止,则把上次求得的点看成(-1),完成1次迭代计算,然后把(-1)看成(0),再从(0)出发,进行下一次迭代计算。
若(1)满足约束条件,但(1)不优于(0),则将步长减半,再求1个(2),若求得的(2)不满足约束条件,则将步长继续减半,直到()满足约束条件。若求得的(2)满足约束条件,但仍不优于(0),则将步长继续减半,直至求得的()优于(0)或满足迭代终止条件。若已求得的()优于(0),则把()看成(0),完成1次迭代,然后从(0)出发,进行下一次迭代计算。
如此计算下去,直至满足迭代终止条件为止(即梯度为0,或步长为0)。
2.2 构建玉米种植密度和施肥量的BP神经网络模型
2.2.1 BP神经网络结构设计
本文采用3层BP神经网络(输入层、隐含层、输出层)创建玉米种植密度和施肥量优化模型。试验设计选取玉米的种植密度、施N量、施P2O5量、施K2O量4个变量,输入层神经元的数量为4个,其中1为种植密度,2为施N量,3为施P2O5量,4为施K2O量;目标函数为1个,输出层神经元的数量为1个,1为玉米产量。隐含层神经元数量的计算公式[31]
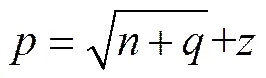
式中为隐含层节点数,为输入层节点数,为输出层节点数,为经验值(1≤≤10)。经计算,本文中隐含层神经元数在4~12之间,通过网络性能测试确定隐含层神经元数量为7。BP神经网络的结构如图2所示。
注:1为种植密度,2为施N量,3为施P2O5量,4为施K2O量;1~7为隐含层节点;1为玉米产量。
Note:1is planting density,2is N application rate,3is P2O5application rate,4is K2O application rate;1-7are hidden layer nodes;1is maize yield.
图2 BP神经网络结构图
Fig.2 Structure chart of BP neural network
输入层至隐含层、隐含层至输出层的传递函数均为单级Sigmoid函数。产量与种植密度和施肥量之间的目标函数关系式可表述为
=()=[·(·+1)+2] (2)
式中()为BP神经网络输入层到隐含层、隐含层至输出层的传递函数单级Sigmoid函数;为输入向量,=[1,2,3,4]T;为输出向量,=[1];()为输入与输出之间的关系;为输入层与隐含层的权值矩阵;1为隐含层的阈值;为隐含层与输出层的权值矩阵;2为输出层的阈值。
2.2.2 数据归一化处理
为消除输入向量与输出向量的量纲影响,满足传递函数的值域区间,防止输入信号过大导致网络输出饱和,需对训练样本(表2)进行归一化处理,=[1,2,3,4,5]=[1,2,3,4,1]。设归一化处理的区间为[,],则输入、输出数据归一化处理的计算公式为
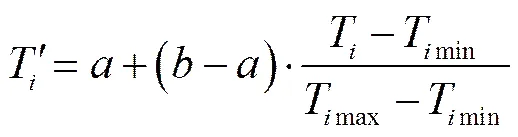
式中T为训练样本数据的第个输入;为T归一化后的数据,Î[,];Tmax为训练样本中第个输入的最大值;Tmin为训练样本中第个输入的最小值。
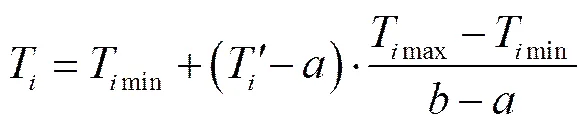
式(3)的逆变换公式为
2.2.3 BP神经网络的拟合
本文利用Matlab R2010a编写整体变学习率BP神经网络计算机程序,对归一化后的训练样本数据进行模型拟合,并与二次回归模型拟合的结果进行比较。玉米产量与种植密度和施肥量的BP神经网络模型采用4-7-1网络结构,归一化区间[0.2,0.6],初始学习率为0.8,网络输出误差满足0.000 1时,输入层与隐含层的权值矩阵为

隐含层的阈值1=[−1.570 4 −2.343 5 3.920 1 −1.286 8 0.343 4 0.032 8 −0.232 4]T、=[11.394 8 −19.389 4 −5.669 6 6.831 4 −9.430 3 −2.450 1 2.883 6]、2=[−0.812 3]。
2.3 玉米种植密度和施肥量的全局优化
2.3.1 优化方法
设人为给定或随机产生1个初始可行点(0)(输入向量),并设()为第次迭代时求得的可行点,然后求()的梯度,即
若()满足迭代终止条件,即满足
=0∈[0,1,2,…] (7)
则最优解(输入向量)
*=() (8)
对应的*(输出向量)便是最优值。
若不满足式(7),则令

(+1)=()+D() (10)
式中步长因子,且>0。
若(+1)不满足约束条件,则令
(+1)()+·D() (11)
式中为收缩系数,且0<<1,一般可取0.5。
若新的(+1)仍不满足约束条件,则令
0.5(12)
重新按式(11)进行计算,直到(+1)满足约束条件为止。然后判断是否满足下式
=0 (13)
若满足式(13),则令
*=(+1) (14)
式中*为最优解,对应的*便是最优值。
若不满足式(13),则判断(+1)是否优于(),即是否满足下式
((+1))>(()) (15)
若满足式(15),则从(+1)点出发,进行下一次迭代计算;若(+1)不满足式(15),则按式(12)继续减小的值,直至满足式(13)或式(15)为止。
若(+1)满足约束条件且优于(),则令
2(16)
()(+1) (17)
然后按式(9)和式(10)重新进行计算,于是得到1个新的(+1)。若新求得的(+1)不满足约束条件或不满足式(15),则(+1)的值取()的值。然后从(+1)点出发,进行下一次迭代计算。若新求得的(+1)满足约束条件且满足式(15),再按式(17)将(+1)的值赋给(),并按式(16)继续增加步长,再按式(9)和式(10)重新进行计算,直至求得的(+1)不满足约束条件或不优于()为止,则(+1)的值取()的值。然后从(+1)点出发,进行下一次迭代计算。
若(+1)满足约束条件但不优于(),则按式(12)将的值减半,然后按式(11)重新进行计算,求得一个新点(+1)。若求得的新点(+1)不满足约束条件,则按式(12)继续将的值减半,直至满足约束条件。若求得的新点(+1)满足约束条件,但仍不优于(),则再按式(12)继续减小的值,然后再按式(11)重新进行计算,再求得1个新的(+1),如此进行下去,直至求得的新点(+1)优于()或满足迭代终止条件。若新的(+1)优于(),则从(+1)点出发,进行下一次迭代计算。
如此计算下去,直至满足迭代终止条件为止(即梯度或步长为0)。
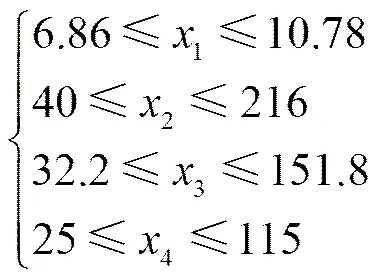
2.3.2 优化的约束条件
根据试验设计时各因素水平的上下限,玉米种植密度和施肥量优化问题的约束条件为
3 结果与分析
3.1 基于BP神经网络模型的玉米产量拟合结果
根据表2中的试验数据,玉米产量1与种植密度1(104株/hm2)、施N量2(kg/hm2)、施P2O5量3(kg/hm2)、施K2O量4(kg/hm2)的二次回归方程为
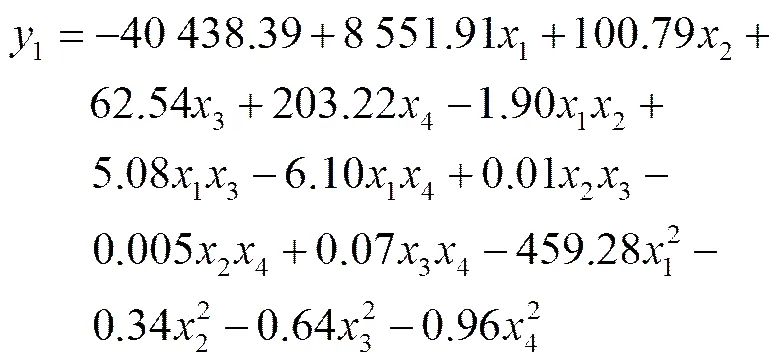
BP神经网络模型的拟合值与试验值对比如图3a所示。二次回归模型拟合值与试验值对比如图3b所示。对比图3a和图3b可知,BP神经网络模型的2为0.98(<0.01)、均方根误差(root-mean-square error,RMSE)为189.89 kg/hm2,二次回归模型的2为0.87(<0.05)、均方根误差为464.25 kg/hm2,表明BP神经网络模型的拟合程度和精度均优于回归模型,运用BP神经网络模型拟合函数能够更真实地反映试验因素与试验目标之间的函数关系。
注:RMSE是均方根误差,下同。
Note: RMSE is root-mean-square error, same as below.
图3 不同模型玉米产量拟合值与试验值对比
Fig.3 Comparison of experimental and fitted values by different models
3.2 基于BP神经网络模型的全局优化
以训练后的BP神经网络模型为目标函数,采用本文提出的优化方法对玉米种植密度和施肥量进行优化,求解使网络输出取得最优值的网络输入。从10个不同的随机初始点(0)分别进行优化求解,优化结果如表3所示。由表3可知,从不同的初始点进行优化求解,获得本试验条件下红星农场德美亚1号玉米最佳种植密度和施肥量为种植密度9.32×10⁴株/hm2,施N量139.5 kg/hm2,施P2O5量85.4 kg/hm2,施K2O量70.8 kg/hm2,该参数组合下玉米的产量高达16 308.53 kg/hm2。
运用Design-Expert 8.0优化软件对二次回归模型拟合的回归方程进行优化,获得试验条件下红星农场德美亚1号玉米最佳种植密度9.325×10⁴株/hm2,施N量137.26 kg/hm2,施P2O5量92.44 kg/hm2,施K2O量70.98 kg/hm2。该参数组合下玉米的产量高达为16 009.00 kg/hm2。
对比2种方法所得优化结果,BP神经网络模型拟合函数的RMSE、2、值都优于二次回归模型拟合函数;BP神经网络全局优化方法所得玉米最佳种植密度和施肥量对应的玉米产量高于回归模型的优化所得。玉米产量与最佳种植密度和施肥量的优化研究属于黑箱问题,而黑箱问题的最优解存在不确定性,无法判断2个结果的优劣。利用基于BP神经网络的优化方法和回归模型进行玉米种植密度和施肥量的优化研究,均是建立在种植密度和施肥量与产量之间函数关系逼近的基础上。理论上,相对平均误差小的拟合函数更接近问题的真实函数,所得优化结果的准确性越高。
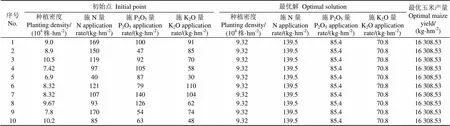
表3 10次BP神经网络优化计算结果
3.3 试验验证结果
为检验BP神经网络优化方法所得最佳种植密度和施肥量参数的可靠性,于2016年5-10月在黑龙江省农垦总局北安管局红星农场进行试验。试验区面积1 hm2,划分为10个面积相等的小区,采用大垄双行种植模式,小区间不设保护行。试验于2016年5月10日播种,试验期间无人工灌溉,降雨量为445.7 mm,9月23日成熟后人工收获,收获时按小区单收单打,14%标准水分别称质量测产。当种植密度为9.32×10⁴株/hm2,施N量139.5 kg/hm2,施P2O5量85.4 kg/hm2,施K2O量70.8 kg/hm2时,验证试验结果如表4所示。由表4可知,试验所得的玉米最大产量和最小产量分别为16 171.7和15 798.8 kg/hm2,平均产量为15 948.3 kg/hm2,与BP神经网络优化产量(16 308.53 kg/hm2)的绝对误差为−360.23 kg/hm2,相对误差为−2.21%,小于5%。虽然试验结果与优化结果之间存在一定的误差,但考虑到降雨量、收获及晾晒时落粒损失、测产标准水不均匀等因素的综合影响,试验结果的误差在允许范围内。可见,BP神经网络优化方法所得优化结果准确可靠。
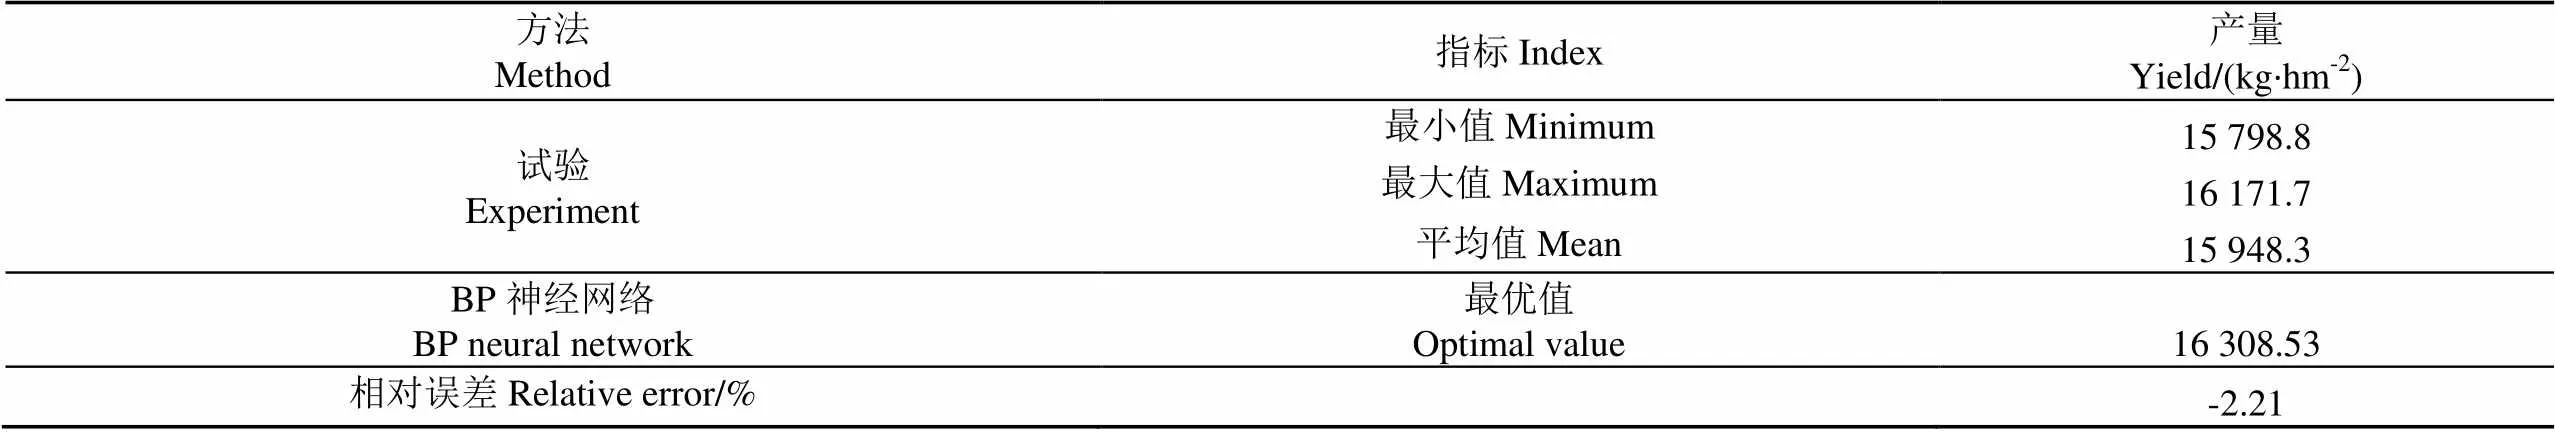
表4 基于BP神经网络优化结果的玉米产量验证
注:种植密度9.32×10⁴株·hm-2;施N量139.5 kg·hm-2;施P2O5量85.4 kg·hm-2;施K2O量70.8 kg·hm-2。
Note: Planting density is 9.32×10⁴plants·hm-2; N application rate is 139.5 kg·hm-2; P2O5application rate is 85.4 kg·hm-2; K2O application rate is 70.8 kg·hm-2.
5 结 论
本文在BP神经网络函数关系拟合的基础上,提出一种基于BP神经网络的优化方法,并将其应用于玉米种植密度和施肥量的优化这一实际问题。该方法将BP神经网络的函数拟合与优化结合起来,扩大了BP神经网络的应用范围。
利用本文提出的优化方法对红星农场德美亚1号玉米种植密度和施肥量试验数据进行优化,获得试验条件下玉米最佳种植密度9.32×10⁴株/hm2,施N量139.5 kg/hm2,施P2O5量85.4 kg/hm2,施K2O量70.8 kg/hm2。该参数组合下玉米产量高达为16 308.53 kg/hm2,高于二次回归模型优化所得玉米最高产量16 009.00 kg/hm2。以BP神经网络优化方法所得优化结果在黑龙江省农垦总局北安管局红星农场试验园区进行验证试验,得出该优化方案的玉米产量为15 948.3 kg/hm2,试验结果与优化结果的相对误差仅为−2.21%,表明基于BP神经网络的优化方法应用于玉米种植密度和施肥量优化的可靠性。
基于BP神经网络的优化方法在玉米种植密度和施肥量优化上的应用,对指导红星农场玉米生产、提高玉米产量、降低生产成本、减轻农业面源污染具有重要的现实意义;同时,为解决农业生产领域中类似优化问题提供了一种思路。
[1] 吕硕,杨晓光,赵锦,等. 气候变化和品种更替对东北地区春玉米产量潜力的影响[J]. 农业工程学报,2013,29(18):179-190.
Lü Shuo, Yang Xiaoguang, Zhao Jin, et al. Effects of climate change and variety alternative on potential yield of spring maize in Northeast China[J]. Transactions of the Chinese Society of Agricultural Engineering (Transactions of the CSAE), 2013, 29(18): 179-190. (In Chinese with English abstract)
[2] 薛吉全,张仁和,马国胜,等. 种植密度、氮肥和水分胁迫对玉米产量形成的影响[J]. 作物学报,2010,36(6):1022-1029.
Xue Jiquan, Zhang Renhe, Ma Guosheng, et al. Effects of plant density, nitrogen application, and water stress on yield formation of maize[J]. Acta Agronomica Sinica,2010, 36(6): 1022-1029. (In Chinese with English abstract)
[3] Muoneke C O, Ogwuche M A O, Kalu B A. Effect of maize planting density on the performance of maize/soybean intercropping system in a guinea savannah agroecosystem[J]. African Journal of Agricultural Research, 2007, 2(12): 667-677.
[4] 王庆杰,李洪文,何进,等. 垄作免耕技术对土壤水分和玉米产量的影响[J]. 农业工程学报,2012,28(增刊2):146-150.
Wang Qingjie, Li Hongwen, He Jin, et al. Effect of ridge culture and no-tillage on soil moisture and maize yield[J]. Transactions of the Chinese Society of Agricultural Engineering (Transactions of the CSAE), 2012, 28(Supp.2): 146-150. (in English with Chinese abstract)
[5] 李霞,汤明军,张东兴,等. 深松对土壤特性及玉米产量的影响[J]. 农业工程学报,2014,30(23):65-69. Li Xia, Tang Mingjun, Zhang Dongxing, et al. Effects of sub-soiling on soil physical quality and corn yield [J]. Transactions of the Chinese Society of Agricultural Engineering (Transactions of the CSAE), 2014, 30(23): 65-69. (in English with Chinese abstract)
[6] Liu Bing, Liu Xiaobing, Wang Cheng, et al. Responses of soybean yield and yield components to light enrichment and planting density [J]. International Journal of Plant Production, 2010, 4(1): 1-9.
[7] 杨锦忠,陆强. 作物产量模型中因子重要性的排序[J]. 农业系统科学与综合研究,1997,13(2):151-153.
Yang Jinzhong, Lu Qiang. Relative importance of factors involved in crop yield models[J]. System Sciences and Comprehensive Studies in Agriculture, 1997, 13(2): 151-153. (in Chinese with English abstract)
[8] 黄开健,杨华铨,谭华. 秋玉米高产栽培技术的最佳密度和施肥量研究[J]. 玉米科学,2001,9(1):57-59.
Huang Kaijian, Yang Huaquan, Tan Hua. The optimal density and fertilizing amount of autumn maize[J]. Maize Science, 2001, 9(1): 57-59. (in Chinese with English abstract)
[9] 胡芬,陈尚模. 寿阳试验区玉米地农田水分平衡及其覆盖调控试验[J]. 农业工程学报,2000,16(4):146-148.
Hu Fen, Chen Shangmo. Shouyang test water balance in maize and its coverage of control test[J]. Transactions of the Chinese Society of Agricultural Engineering (Transactions of the CSAE), 2000, 16(4): 146-148. (in Chinese with English abstract)
[10] 蔡太义,贾志宽,孟蕾,等. 渭北旱塬不同秸秆覆盖量对土壤水分和春玉米产量的影响[J]. 农业工程学报,2011,27(3):43-48.
Cai Taiyi, Jia Zhikuan, Meng Lei, et al. Effects of different rates of straw mulch on soil moisture and yield of spring maize in Weibei Highland area of China[J]. Transactions of the Chinese Society of Agricultural Engineering (Transactions of the CSAE), 2011, 27(3): 43-48. (in Chinese with English abstract)
[11] 王宏庭,王斌,赵萍萍,等. 种植方式、密度、施肥量对玉米产量和肥料利用率的影响[J]. 玉米科学,2009,17(5):104-107.
Wang Hongting, Wang Bin, Zhao Pingping, et al. Influence of plant arrangement, density and the rate of fertilizer applied on maize yield and fertilizer use efficiency[J]. Journal of Maize Science, 2009, 17(5): 104-107. (in Chinese with English abstract)
[12] 李宗新,陈源泉,王庆成,等. 密植条件下种植方式对夏玉米群体根冠特性及产量的影响[J]. 生态学报,2012,32(23):7391-7401.
Li Zongxin, Chen Yuanquan, Wang Qingcheng, et al. Effect of different planting methods on root shoot characteristics and grain yield of summer maize under high densities[J]. Acta Ecologica Sinica, 2012, 32(23): 7391-7401. (in Chinese with English abstract)
[13] 陈传永,侯玉虹,孙锐,等. 密植对不同玉米品种产量性能的影响及其耐密性分析[J]. 作物学报,2010,36(7):1153-1160. Chen Chuanyong, Hou Yuhong, Sun Rui, et al. Effects of planting density on yield performance and density tolerance analysis for maize hybrids[J]. Acta Agronomica Sinica, 2010, 36(7): 1153-1160. (in Chinese with English abstract)
[14] 李渝,张雅蓉,张文安,等. 贵州黄壤地区不同施肥处理及降雨量对玉米产量的影响[J]. 水资源与水工程学报,2015,26(1):230-235.
Li Yu, Zhang Yarong, Zhang Wenan, et al. Effects of different fertilizer controls and precipitation on corn yield in yellow soil region of Guizhou[J]. Journal of Water Resources and Water Engineering, 2015, 26(1): 230-235. (in Chinese with English abstract)
[15] Liu Xiaoling, Jia Liangliang, Han Baowen, et al. Effects of different nutrient management systems and cultivation methods on crop yield and soil fertility[J]. Agricultural Science and Technology, 2011, 12(11): 1674-1679.
[16] 饶大恒,邹细标. 密度、施肥量和施肥方式对玉米形状及产量影响的研究[J]. 江西农业大学学报,1993,15(4):418-422.
Rao Daheng, Zou Xibiao. Studies on the effects of planting density, fertilizer amount and fertilizing pattern on the characteristics and yield of corn[J]. Acta Agriculturae Universitis Jiangxiensis, 1993, 15(4): 418-422. (in Chinese with English abstract)
[17] 刘恩科,赵秉强,胡昌浩,等. 长期施氮、磷、钾化肥对玉米产量及土壤肥力的影响[J]. 植物营养与肥料学报,2007,13(5):789-794.
Liu Enke, Zhao Bingqiang, Hu Changhao, et al. Effects of long-term nitrogen, phosphorus and potassium fertilizer applications on maize yield and soil fertility[J]. Plant Nutrition and Fertilizer Science, 2007, 13(5): 789-794. (in Chinese with English abstract)
[18] 李忠芳,徐明岗,张会民,等. 长期施肥下中国主要粮食作物产量的变化[J]. 中国农业科学,2009,42(7):2407-2414.
Li Zhongfang, Xu Minggang, Zhang Huimin, et al. Grain yield trends of different food crops under long-term fertilization in China[J]. Scientia Agricultural Sinica, 2009, 42(7): 2407-2414. (in Chinese with English abstract)
[19] 李改珍,艾复清,赵宇航. 不同密度及施氮肥对油菜产量的影响[J]. 山地农业生物学报,2004,23(3):198-201.
Li Gaizhen, Ai Fuqing, Zhao Yuhang. Study on high-yield cultivating technique for rape in different nitrogen and density[J]. Journal of Mountain Agriculture and Biology, 2004, 23(3): 198-201. (in Chinese with English abstract)
[20] 艾复清,李改珍. 施氮量、密度与油菜产量关系的旋转回归分析[J]. 中国农学通报,2005,21(4):142-144.
Ai Fuqing, Li Gaizhen. Study on yield of the rape in different nitrogen and density[J]. Chinese Agriculture Science Bulletin, 2005, 21(4): 142-144. (in Chinese with English abstract)
[21] Shapiro C A, Wortmann C S. Corn response to nitrogen rate, row spacing, and plant density in Eastern Nebraska[J]. Agronomy Journal, 2006, 98(3): 529-535.
[22] Widdicomde W D, Thelen K D. Row width and plant density effects on corn grain production in the Northern corn belt[J]. Agronomy Journal, 2002, 94(5): 1020-1023.
[23] Cox W J, Cherney D J R. Row spacing, plant density, and nitrogen effects on corn silage[J]. Agronomy Journal, 2001, 93(3): 597-602.
[24] Cox W J, Hanchar J J, Knoblauch W A, et al. Growth, yield, quality and economics of corn silage under different row spacing[J]. Agronomy Journal, 2006, 98(1): 163-167.
[25] 张淑娟,何勇,方慧. 人工神经网络在作物产量与土壤空间分布信息关系分析中的应用[J] . 系统工程理论与实践,2003(12):121-127.
Zhang Shujuan, He Yong, Fang Hui. Application of artificial neutral network on relationship analysis of crop yield and soil space distributing information[J]. System Engineering Theory and Practice, 2003(12): 121-127. (in Chinese with English abstract)
[26] 张漫,李婷,季宇寒,等. 基于BP神经网络算法的温室番茄CO2增施策略优化[J]. 农业机械学报,2015,46(8):239-244.
Zhang Man, Li Ting, Ji Yuhan, et al. Optimization of CO2enrichment strategy based on BPNN for tomato plants in greenhouse[J]. Transactions of the Chinese Society for Agricultural Machinery, 2015, 46(8): 239-244. (in Chinese with English abstract)
[27] 鞠金艳,王金武,王金峰. 基于BP神经网络的农机总动力组合预测方法[J]. 农业机械学报,2010,41(6):87-92.
Ju Jinyan, Wang Jinwu, Wang Jinfeng. Combined prediction method of total power of agricultural machinery based on BP neural network[J]. Transactions of the Chinese Society for Agricultural Machinery, 2010, 41(6): 87-92. (in Chinese with English abstract)
[28] 王吉权,王福林,邱立春. 基于BP神经网络的农机总动力预测研究[J]. 农业机械学报,2011,42(12):121-126.
Wang Jiquan, Wang Fulin, Qiu Lichun. Prediction of tolal power in agriculture machinery based on BP neural network[J]. Transactions of the Chinese Society for Agricultural Machinery, 2011, 42(12): 121-126. (in Chinese with English abstract)
[29] 王吉权. BP神经网络的理论及其在农业机械化中的应用研究[D]. 沈阳:沈阳农业大学,2011.
Wang Jiquan. Research on BP Neural Network Theory and Its Application in Agricultural Mechanization[D]. Shenyang: Shenyang Agricultural University, 2011. (in Chinese with English abstract)
[30] 王伟. 黑龙江省大豆合理施肥参数的研究[D]. 哈尔滨:东北农业大学,2009.
Wang Wei. A Study on Parameters of Rational Fertilization for Soybean in Heilongjiang[D]. Harbin: Northeast Agricultural University, 2009. (in Chinese with English abstract)
[31] 韩力群. 人工神经网络教程[M]. 北京:北京邮电大学出版社,2006,12.
Optimization of maize planting density and fertilizer application rate based on BP neural network
Wang Fulin, Dong Zhigui, Wu Zhihui, Fang Kun
(150030)
Planting density and fertilizer application rate are the important factors affecting crop yield, and the unreasonable utilization has caused a series of serious consequences such as high cost, agriculture resources waste, agricultural non-point source pollution, and ecological environment deterioration and so on. In this study, a BP neural network-based optimization method of planting density and fertilizer application rate was proposed and tested for its feasibility by field experiments. The field experiment was carried out in Hongxing Farm of Heilongjiang, China (126°47´E, 48°01´N) in 2014 and 2015. The experiment of 4 factors and 5 levels was designed by using the quadratic orthogonal rotation method. Four factors included planting density, N, P and K application rate. Five levels were considered as the equally spaced values taken from the planting density of 6.86×10⁴-10.78×10⁴plants/hm2, the N application rate of 40-216 kg/hm2, the P2O5application rate of 32.2-151.8 kg/hm2and the K2O application rate of 25-115 kg/hm2. Among the 5 levels, the 0 level referred to the local experience value. A total of 36 plots were prepared and each plot had the width of 4.4 m and the length of 5 m. Maize (variety of Deyamei No.1 ) was planted on ridges in the width of 100 cm and in the height of 15 cm. Irrigation was not conducted during the experiment. The rainfall during the growing season of maize was 471.4 mm in 2014 and 460.7 mm in 2015. At harvest, the maize yield was determined. The field data was fitted using BP neural network model and regression method, respectively for optimization of planting density and fertilizer application rates. The BP neural work optimization method included model establishment and global optimization. The data was processed in Matlab. The results showed that the BP neural network model had higher determination coefficient of 0.98 (<0.01) than the regression model (2=0.87,<0.05). Meanwhile, the former had smaller root-mean-square error of 189.89 kg/hm2than the latter (464.25 kg/hm2). It indicates that the BP neural network model was better in fitting the relationship between maize yield and fertilizer application rate. Furthermore, the global optimization was conducted for 10 times by using BP neural network model. Each computation started from random input values of planting density and fertilizer application rate within the designed range in the field experiment. All the computation provided a same optimization result: the maize yield of 16 308.53 kg/hm2, the planting density of 9.32×10⁴plants/hm2, the N application rate of 139.5 kg/hm2, the P2O5application rate of 85.4 kg/hm2and the K2O application rate of 70.8 kg/hm2. In 2016, a field experiment was conducted in the same place with the optimization results of the planting density and fertilizer application rate. The results showed that the maize yield was 15 948.3 kg/hm2with a maximum value of 16 171.7 kg/hm2and a minimum value of 15 798.8 kg/hm2. The relative error between the measured and optimized maize yield was -2.21%, below than 5%. It suggested that the BP neural network model was reliable. Therefore, this study provides a stable and feasible optimization method to solve the similar optimization problem in field of agriculture production. Meanwhile, this study expands the application of BP neural network in agriculture.
neural networks; regression analysis; optimization; maize; yield; planting density; fertilizer application rate
10.11975/j.issn.1002-6819.2017.06.012
S157.4
A
1002-6819(2017)-06-0092-08
2016-08-25
2017-03-12
国家自然科学基金面上项目(31071331);国家“十二五”科技支撑计划课题子课题(2014BAD06B04-2-9);公益性行业(农业)专项课题(201503116-04)。
王福林,男,黑龙江安达人,教授,博士,博士生导师,主要从事农业系统工程与管理工程研究。哈尔滨 东北农业大学工程学院,150030。Email:fulinwang1462@126.com
猜你喜欢
现代农村科技(2022年9期)2022-08-16 02:25:50
电机与控制应用(2022年4期)2022-06-27 06:29:28
成都信息工程大学学报(2021年5期)2021-12-30 06:25:30
Frontiers of Nursing(2018年1期)2018-05-21 02:34:14
高中生·天天向上(2016年6期)2016-11-22 09:39:34
河北科技大学学报(2015年5期)2015-03-11 16:16:37
电测与仪表(2014年2期)2014-04-04 09:04:00
湖南农业科学(2014年20期)2014-02-27 14:32:55
湖南农业科学(2014年8期)2014-02-27 14:32:13
湖南农业科学(2014年5期)2014-02-27 14:29:53