Development and evaluation ofan individualtree growth and yield modelfor the mixed species forest ofthe Adirondacks Region of New York,USA
Aaron Weiskittel,Christian Kuehne,4*,John PaulMcTagueand Mike Oppenheimer
Development and evaluation ofan individualtree growth and yield modelfor the mixed species forest ofthe Adirondacks Region of New York,USA
Aaron Weiskittel1,Christian Kuehne1,4*,John PaulMcTague2and Mike Oppenheimer3
Background:Growth and yield models are important tools for forest planning.Due to its geographic location,
topology,and history of management,the forests of the Adirondacks Region of New York are unique and complex. However,only a relatively limited numberofgrowth and yield models have been developed and/or can be reasonably extended to this region currently.
Methods:In this analysis,571 long–term continuous forest inventory plots with a total of 10 – 52 years of measurement data from four experimental forests maintained by the State University of New York College of EnvironmentalScience and Forestry and one nonindustrialprivate forestwere used to develop an individualtree growth modelfor the primary hardwood and softwood species in the region.Species–specific annualized static and dynamic equations were developed using the available data and the system was evaluated for long–term behavior.
Results:Equivalence tests indicated thatthe Northeast Variant ofthe Forest Vegetation Simulator(FVS–NE)was biased in its estimation of tree total and bole height,diameter and height increment,and mortality for most species examined.In contrast,the developed static and annualized dynamic,species–specific equations performed quite well given the underlying variability in the data.Long–term modelprojections were consistent with the data and suggest a relatively robust system for prediction.
Conclusions:Overall,the developed growth modelshowed reasonable behaviorand is a significant improvement over existing models for the region.The modelalso highlighted the complexities offorest dynamics in the region and should help improve forest planning efforts there.
Individualtree growth model,Mixed species,Forest vegetation simulator
Background
The forests in the Adirondacks Region of New York are a complex mixture of hardwood and softwood species that have a long and varied history of natural disturbance occurrences(Lorimer and White 2003)and human management(McMartin 1994).The region is considered an ecotone at the southernmost end of the eastern forest–boreal ecoregion with over 25 different tree species present and is particularly sensitive to variation in localclimate(Beier et al.2012).Due to variation in elevation and geology,a variety of forest communities occur in this region ranging from high alpine to northern hardwood (Leopold et al.1988).Historically,research in the region was concentrated on spruce–fir(Picea – Abies)with increasing attention on northern hardwoods(Berven et al. 2013).The forest currently faces a number of issues including climate change(Beier et al.2012),beech bark disease(McGee 2000),high fern cover(Engelman and Nyland 2006),and atmospheric deposition(Chen et al. 2004),which are all likely to affect future stand dynamics and management options.Consequently,there is a strongneed to understand and project the potential influence of alternative forest management strategies.
Growth and yield models are important tools for effective and sustainable forest management and have a long history of development(Weiskittel et al.2011a). However,a relatively limited number of growth and yield simulators exist for the Adirondacks Region. Aldridge(1982)developed stand–level basal area and volume projections equations,but they were only applicable to northern hardwood stands in the region. Likewise,Pan and Raynal(1995)presented individual tree volume growth equations for three plantation conifers in the region.Today,the most commonly used models in the region currently are Northeast–TWIGS (NE–TWIGS;Hilt and Teck 1989)and the Northeast variant of the Forest Vegetation Simulator(FVS–NE; Dixon et al.2007).Recent work has suggested NE–TWIGS and FVS–NE to have some important limitations in the region(Ray et al.2009).For example, Russell et al.(2013)indicated FVS–NE predictions of total height as well as diameter and height increment were statistically not equivalent for many of the common species in the Adirondacks.Based also on recent US Forest Service Forest Inventory and Analysis(FIA) data,Pandit et al.(2012)also indicated that FVS–NE had biased short–term predictions of stand–level basal area growth in New York,especially in the elm–ash(Ulmus–Fraxinus)and oak–hickory(Quercus–Carya)foresttypes.
The goal of this project was to develop an individual–tree growth and yield simulator that is specific to the Adirondacks Region of New York.Specific objectives were to:(1)test the component equations of Northeast (FVS–NE)for bias in the Adirondacks Region;(2)refit component equations(totalheight,bole height,diameter increment,height increment,and mortality)as necessary;and(3)evaluate and present long–term prediction behavior for forest types common to the region.
Methods
Study area
The Adirondacks Region of New York is located in Upstate New York and is characterized by a unique mountain range that varies in elevation from 350 to over 1500 m.Climate and soil conditions vary dramatically with elevation,but the average monthly summer high and winter low temperatures are 26 and –15 °C,respectively.Total annual precipitation is around 1044 mm with a nearly equal distribution of precipitation during the year(monthly mean ± SD;87.1 ± 19.3 mm). Soils in the region are generally young,thin,sandy, acidic,and infertile.
Common forest types in the region include black spruce(Picea mariana(Miller)B.S.P) – northern white cedar swamps(Thuja occidentalis L.),red spruce(Picea rubens Sarg.) – balsam fir(Abies balsamea L.)flats,red spruce – balsam fir – red maple(Acer rubrum L.) – yellow birch(Betula alleghaniensis Britton),and sugar maple(Acer saccharum Marsh.) – American beech (Fagus grandifolia Ehrh.) – yellow birch.Other species present include white spruce(Picea glauca(Moench) Voss.),eastern white pine(Pinus strobus L.),Norway spruce(Picea abies(L.)Karst.),red pine(Pinus resinosa Ait.),eastern hemlock(Tsuga canadensis(L.)Carr.), paper birch (Betula papyrifera Marsh.),gray birch (Betula populifolia Marsh.),quaking aspen(Populus tremuloides Michx.),bigtooth aspen(Populus grandidentata Michx.),black cherry(Prunus serotina Ehrh.), northern red oak(Quercus rubra L.),and white ash (Fraxinus americana L.).
Based on their frequency and occurrence,this analysis focused on the top eight hardwoods(American beech, ash,black cherry,quaking aspen,red maple,red oak,sugar maple,yellow birch)and top six softwoods(balsam fir, eastern hemlock,red pine,spruce,white cedar,white pine).The other species present were grouped into either“other hardwoods”(OH)or “other softwoods”(OS).
Data
The data used in this analysis was obtained from long–term continuous forest inventory(CFI)plots.In addition to the privately owned Shirley Forest(SF),this data included four experimentalforests maintained and managed by the State University of New York College of Environmental Science and Forestry(SUNY–ESF),namely Dubuar Memorial Forest(DMF),Huntington Wildlife Forest(HWF),Pack Demonstration Forest(PDF),and Pack Experimental Forest(PEF).Large differences in site quality,based on observed dominant height,are apparent among the experimental forests.For example,Germain et al.(2016)reported white pine site index(dominant/codominant height at base age 50 in m)values of 25 and 16 for HWF and PDF respectively.Given differences in location and sampling,each of these forests are described separately below.
Dubuar memorialforest
Dubuar Memorial Forest is a 1068 ha forest in St. Lawrence County and is near Wanakena,NY.In 1982,approximately 72 potential plot locations were selected to be sampled across the entire property with an even distribution between hardwood and softwood forest types.Exact plot locations were referenced to the north–south/east–west grid system already surveyed on the property.The plots have been measured in 1989,1996,and 2006 with a total of 5765 observations.
Each CFI plot is a fixed–area series of concentric circles including a 0.08 ha(1/5 acre)for sawtimber[>27.9 cm(>11 in.)DBH for hardwoods and >22.8 cm (>9 in.)DBH for softwoods],a 0.04 ha(1/10 acre)for poletimber[>12.7 cm(>5 in.)DBH],and a 0.001 ha (1/300 acre)for saplings[>2.5 cm(>1 in.)DBH and<12.7 cm(<5 in.)DBH].Measurement of saplings was only completed in 1982.A subsample of trees were selected for total and bole height measurements. Bole height(BHT)was defined as the distance between a 30 cm stump and either a 10 cm upper–stem diameter outside bark or where the central stem terminates due to forking.
Huntington wildlife forest
Huntington Wildlife Forest is an approximately 6000 ha forestin Essex and Hamilton Counties and near Newcomb, NY.In 1970,290 plots were established in a systematic grid.The plots have been measured in 1970,1981, 1991,2001,and 2011 for a total of 21,170 observations.Each CFI plot is a fixed–area series of concentric circles including a 0.08 ha (1/5 acre)for sawtimber[26.9 cm(>10.6 in.)DBH]and a 0.2 ha(1/ 20 acre)for poletimber[>11.7 cm(>4.6 in.)DBH and<26.9 cm(<10.6 in.)DBH].A subsample of trees were selected for total and bole height measurements.
Pack demonstration forest
Pack Demonstration Forest is a 977 ha forest in Warren County near Warrensburg,NY.In 1983,a total of 95 plots were established in a systematic grid.The plots have been measured in 1993 and 2003 for a total of 5795 observations.Each CFI plot is a fixed–area,circular 0.04 ha(1/10 acre)plot with trees >9.1 cm(>3.6 in.) DBH being measured.A subsample of trees were selected for totaland bole height measurements.
Pack experimentalforest
Pack Experimental Forest is located in St.Lawrence County near Cranberry Lake.In 1989,a total of 27 plots were established in a systematic grid.The plots have been measured in 1989,1996,and 2006 for a total of 1706 observations.Like Dubuar Memorial Forest,the Pack Experimental Forest uses CFI plots that are a fixed–area series of concentric circles including a 0.08 ha(1/5 acre) for sawtimber[>27.9 cm(>11 in.)DBH for hardwoods and >22.9 cm(>9 in.)DBH for softwoods]and a 0.04 ha (1/10 acre)for poletimber[>12.7 cm(>5 in.)DBH].A subsample of trees were selected for total and bole height measurements.In contrast to the other experimental forest mentioned above,the Pack Experimental Forest has not received any active forest management in recent decades due to limited access.
Shirley forest
Shirley Forest is a privately owned forest with several locations in Essex County west of Lake Champlain with a total of 93 potential plots established in the 1960s and 1970s.The majority of plots have been measured in 1962/63,1967/68,1973/74,1977/79, 1984/86,1995/98,2002/05,and 2011/2014 for a total of 11,060 observations.The circular fixed–area CFI plots were 0.08 ha(1/5 acre)in size and trees with DBH > 12.7 cm(>5 in.)were measured.No height and bole height measurements were taken.SF has received active forest management on a regular basis with harvest operation taking place approximately every 10 to 20 years.
Analysis
All available measurements from the five studied forests not taken after cleaning or harvesting operations were standardized,merged into a common format, and converted to metric units.This resulted in a dataset with 45,496 observations with 16.6% and 15.7%having total and bole height measurements,respectively(Table 1).Table 2 displays the same tree measurement statistics of Table 1 by the key tree species.Missing individual tree total and bole height values were imputed by using a plot– and species–specific mixed–model as outlined by Robinson and Wykoff(2004).Stand– and tree–level attributes were then summarized for each plot and included stem density(TPH,#ha–1),additive stand density index (SDI,#ha–1),quadratic mean diameter(QMD,cm), total basal area(BA,m2·ha–1),basal area in larger trees(BAL,m2·ha–1),and percent basal area in hardwood species(PBAHW,%)(Table 3).
Since tree age measurements were not available,climate site index(CSI,m)of Weiskittel et al.(2011b) was used in place of traditional site index,which is similar to the Acadian variant of FVS(Weiskittel et al.2012).CSI is a base–age 50 years estimate of site index based on downscaled climate variables(http:// forest.moscowfsl.wsu.edu/climate/)and a random forest nonparametric regression model built on field–observed values(Table 3).The general approach to model and derive CSI has been described in detail previously(Jiang et al.2015).Since FVS–NE requires traditional site index,it was assumed that CSI was an equivalent estimate for the fastest–growing species on the plot.FVS–NE then uses the estimate for the fastest–growing species on the plot to convert to species–specific values based on nine species groups (Dixon et al.2007).
To evaluate the suitability of FVS–NE component equations,an equivalence test(Robinson and Froese 2004)with 15% allowable error was conducted.Equations were then fit to the Adirondacks data and included individual tree total and bole height,diameter and height increment,and mortality.Each of these equations was fit to the primary species using nonlinear mixed effects modeling(NLME)with each forest being treated as random(Pinheiro et al.2016).Extending the random effects structure by including plots and trees did not improve prediction accuracy.The specific equations are further described separately below.All analyses were conducted using the programming software R version 3.3.1(R Core Team 2016).

Table 1 Individualtree attributes by forest,which are Dubuar Memorial Forest(DMF),Huntington Wildlife Forest(HWF),Pack Demonstration Forest(PDF),Pack ExperimentalForest(PEF),and Shirley Forest(SF)
The primary species included in this analysis were American beech(AB),ashes(AS,including white and black ash(Fraxinus nigra Marshall)),black cherry (BC),balsam fir(BF),eastern hemlock(EH),quaking aspen(QA),red maple(RM),red pine(RN),red oak (RO),sugar maple(SM),spruces(SP,including black, red,and white spruce),northern white cedar(WC), white pine(WP),yellow birch(YB,also including river birch(Betula nigra L.)),other hardwood species (OH),and other softwood species(OS).However,species specific equations could not be derived for all attributes.
Total height
Based on the findings of Rijal et al.(2012b),a modified Chapman–Richards equation form was used for the prediction and imputation of total tree height(HT,m):

where DBH is diameter at breast height(cm),BA is total basal area(m2·ha–1),and BAL is the basal area in larger trees(m2·ha–1).Unlike Rijal et al.(2012b), climate site index was not found to be a significant predictor in preliminary analysis.In addition,an additive term(e.g.1.3 m)for when DBH is equal to zero was not included as prior work has suggested that this constraint may cause poorer model performance across the full range of DBH(Newton and Amponsah 2007).
Bole height
Although Rijal et al.(2012a)modeled height to crown base and our Adirondacks data contained measurements of bole height(defined as the first live branch or a 10.2 cm(4 in)top),its applicability was still tested.However,rather than using a modified Chapman–Richards equation form similar to Rijal et al. (2012a),a modified logistic similar to Hann et al. (2003)was used for the prediction and imputation of bole height(BHT,m):
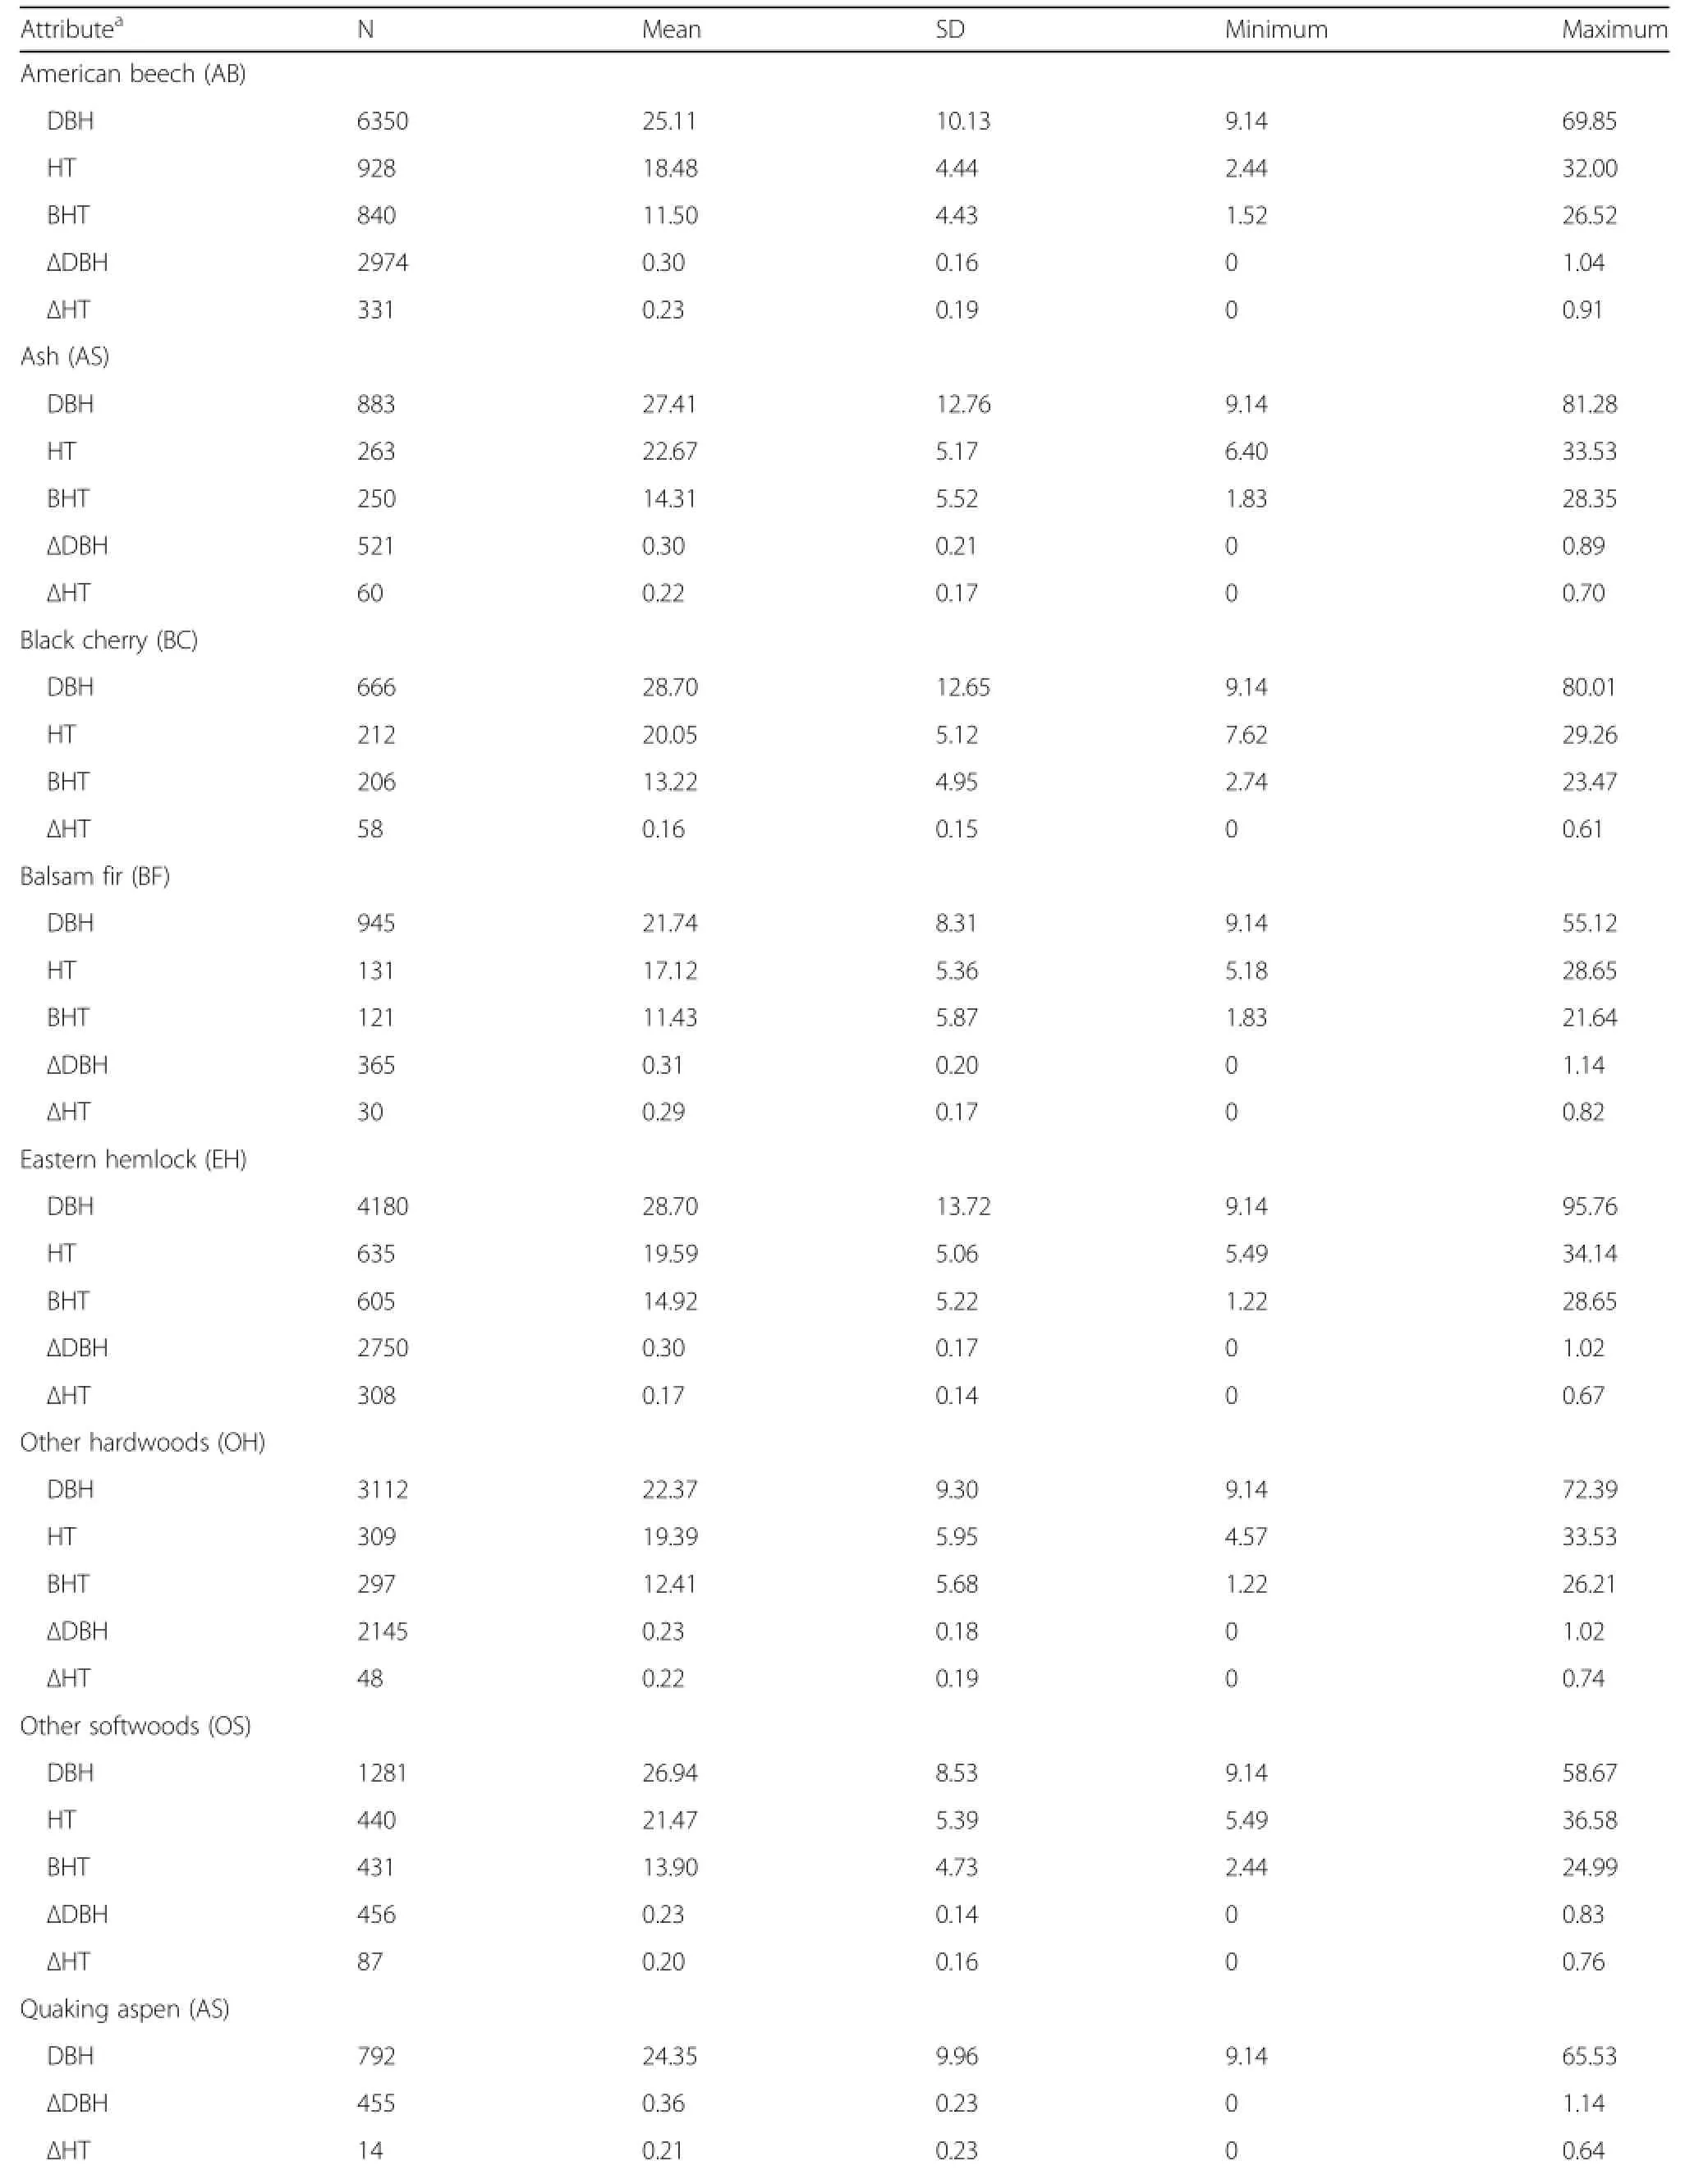
Table 2 Tree–levelattributes by species examined in this analysis
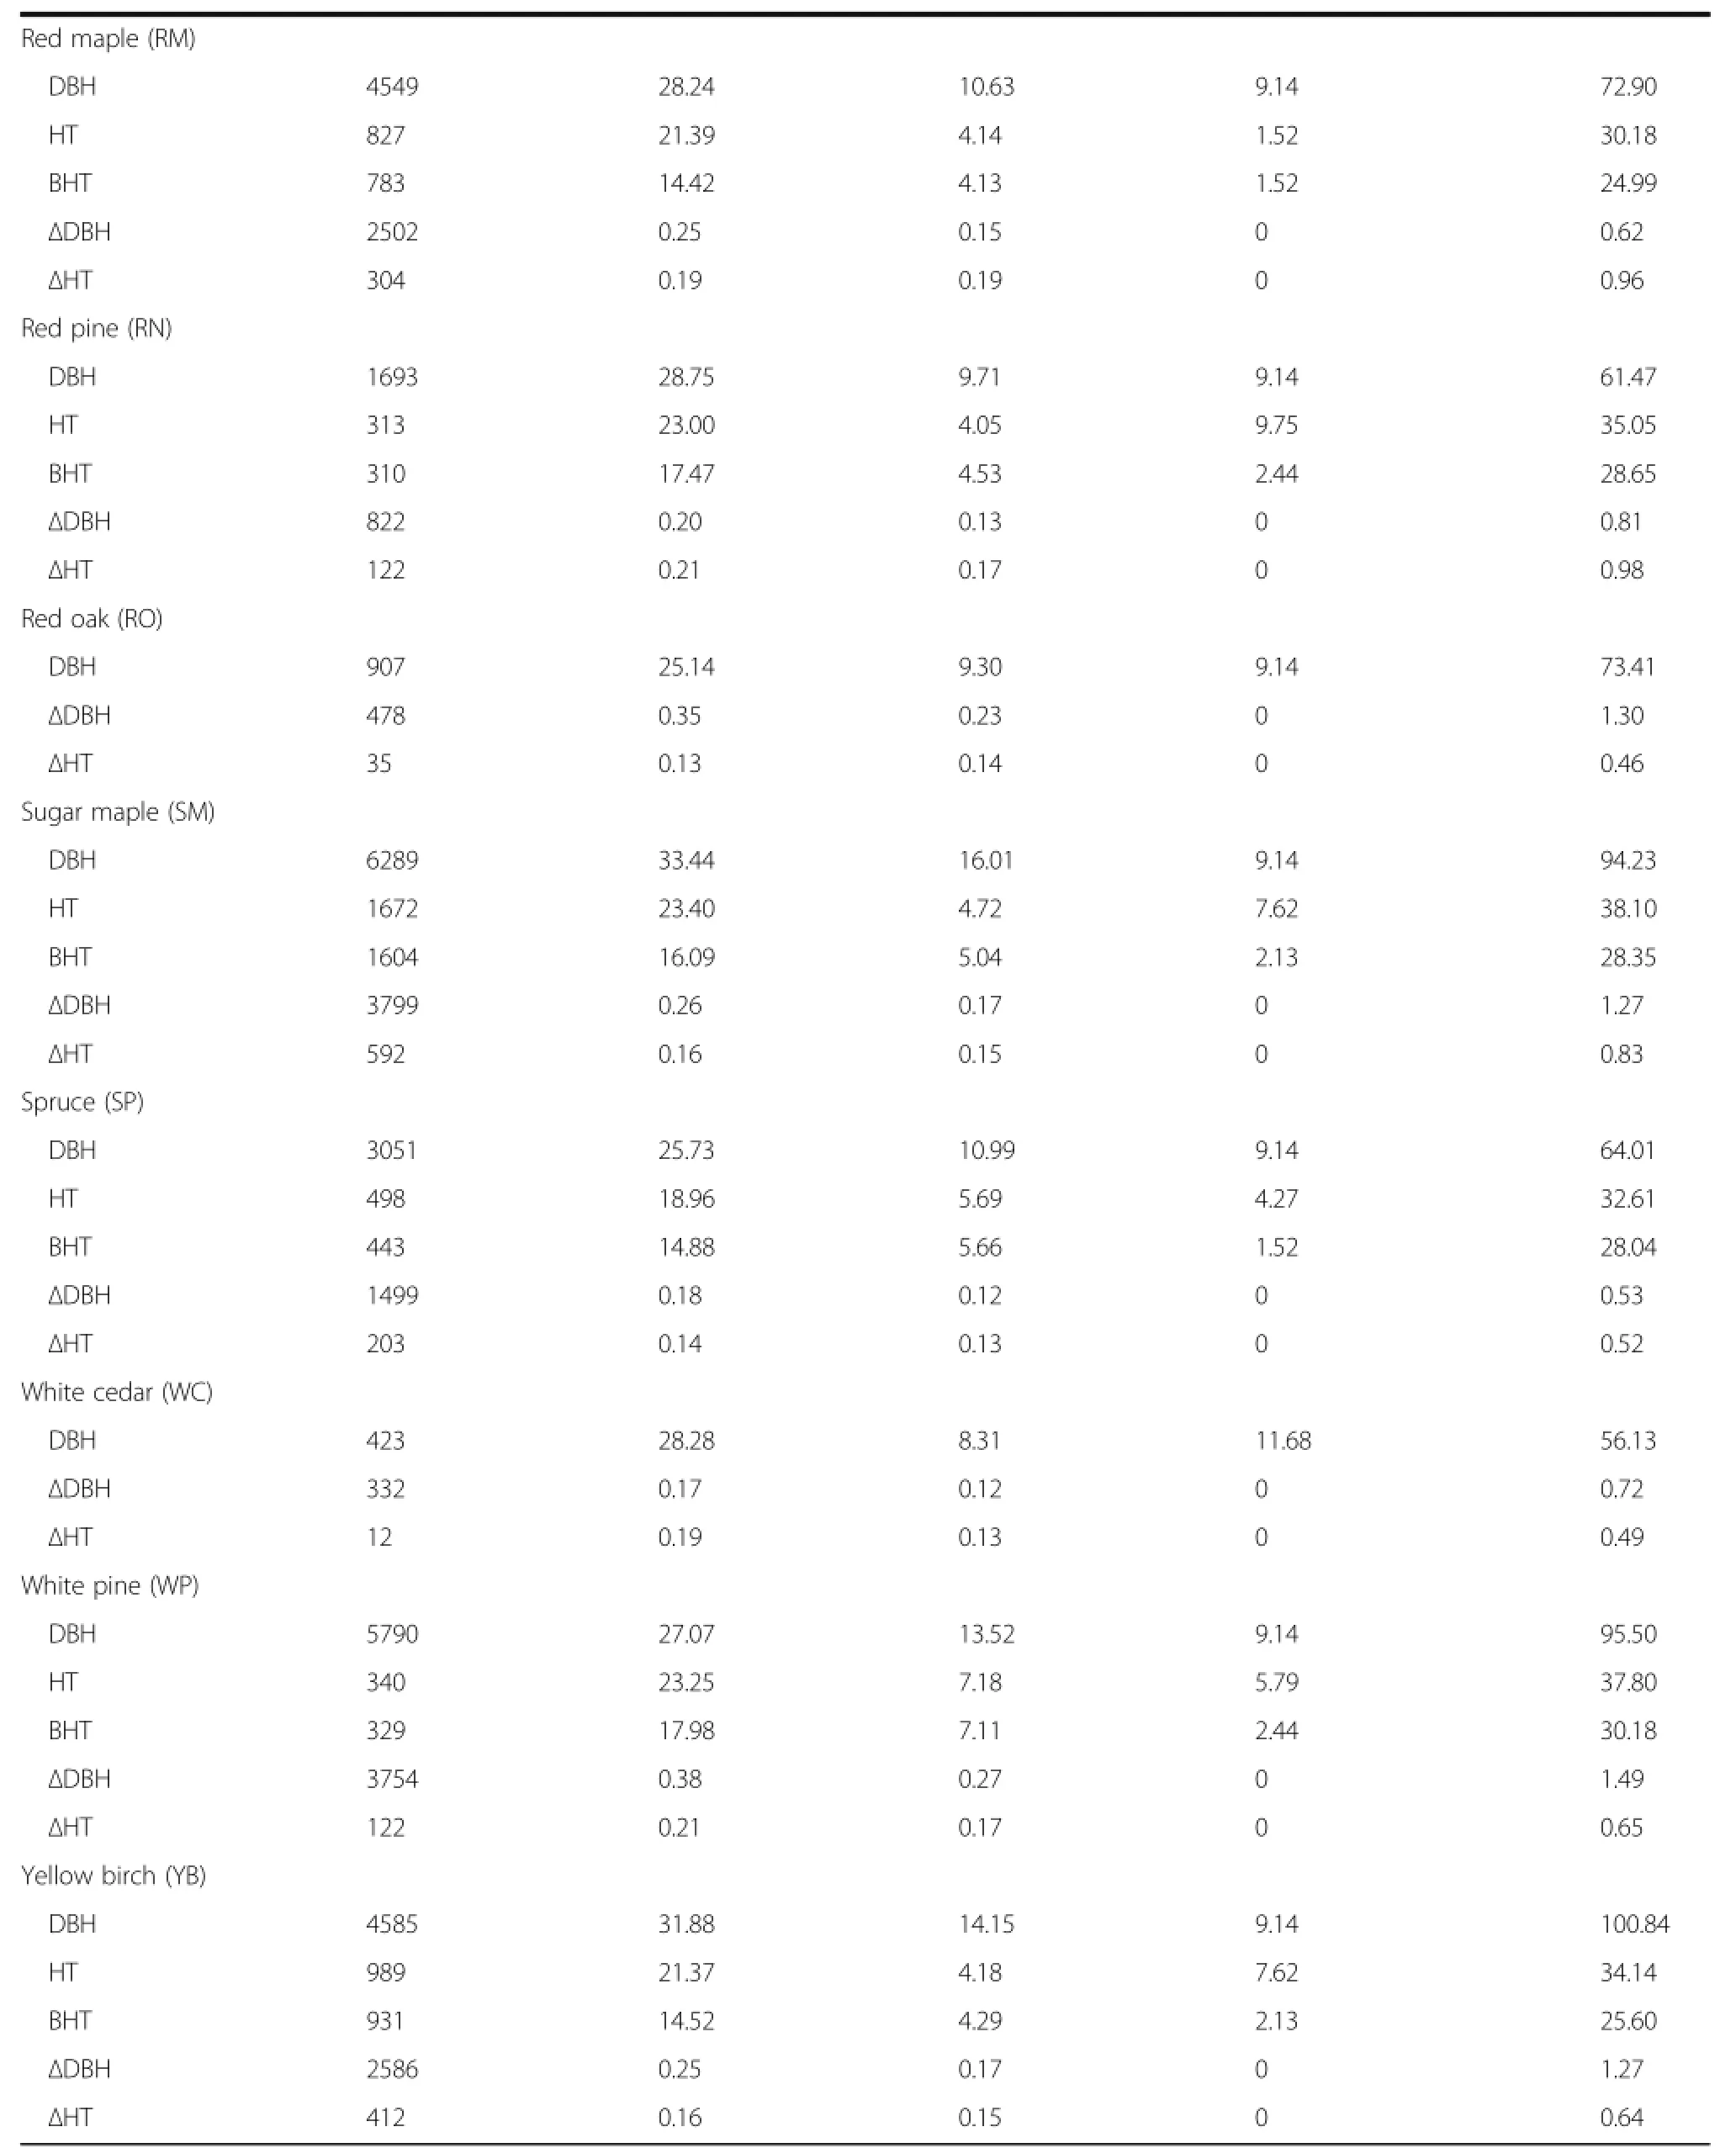
Table 2 Tree–levelattributes by species examined in this analysis(Continued)

where CSI is climate site index(m),and all other variables are defined above.
Diameter increment
A variety of model forms and potential covariates were tested for individual tree diameter increment predictions,but it was found that it was best modeled using an equation form similar to Hann et al.(2003):

where ΔDBH is the annual diameter increment(cm·yr–1) and all other variables have been defined above.Preliminary analysis indicated that neither bole nor crown ratio (CR,(HT–BHT)/HT)were effective predictors.In addition,variables expressing species composition such as PBAHW and relative density(Stout and Nyland 1986; Woodall et al.2005)were not found to be influential.
Since annual parameters were desired but the observed variables were on longer growth intervals(2–17 years)parameters were annualized using an iterative technique of Weiskittel et al.(2007).Based on Cao (2000)the right side of the equation was a function which summed the estimated annual ΔDBH estimates over the number of growing seasons during the observed growth period using the updated parameter estimates from the NLME optimization algorithms.For each growing season during the growth period,DBH was subsequently updated,while BAL and BA were linearly interpolated between their beginning values and ending values.Finalequations were fitted using initial parameter estimates derived using non–linear least square modeling and assuming SI was constant over time.Although this assumption of linear growth is likely too simplified for highly irregular and longer remeasurement intervals (>10 years),the iterative approach used in this analysis does produce model behavior similar to a more sophisticated optimization approach and is more effective than using the remeasurement interval as a covariate(e.g. Juma et al.2014).
Height increment
A variety of height increment models including the one used in FVS–NE and those presented in Russell et al. (2014)were tested.The following form was shown to perform best:

where ΔHT is the annual height increment(m·yr–1)and all other variables have been defined above.Like diameter increment,the parameters were annualized using an iterative technique of Weiskittel et al.(2007).Initially, the model was fit for each species individually.However, no or poor model convergence resulted,likely because of small sample sizes for most species and high variability(Table 2).Instead,the model was fit by treating b40and b41as random parameters that varied by species similar to the approach outlined in Russell et al.(2014). CSI and variables describing species composition were not found to be significant predictors.
Mortality
A logistic function was used to model the probability of individual tree survival:

where PS is the probability of annual survival and all other variables have been defined above.The parameters were annualized using an iterative technique of Weiskittel et al.(2007).
Evaluation
For all developed equations presented above,biological consistency with expectation,parameter significance,sign,and magnitude as well as degree of multicollinearity were evaluated.Equation fit statistics assessed were mean bias(MB;observed – predicted) and root mean square error(RMSE).MB and RMSE were computed using the fixed–effects only.For the mortality equation,a receiver operator curve(ROC)was constructed and area under the curve(AUC)computed (Hein and Weiskittel 2010).To determine the optimal cutpoint for the species–specific survival equations(Rota and Antolini2014),the function ‘coords’of the R package‘pROC’was used(Robin etal.2011).
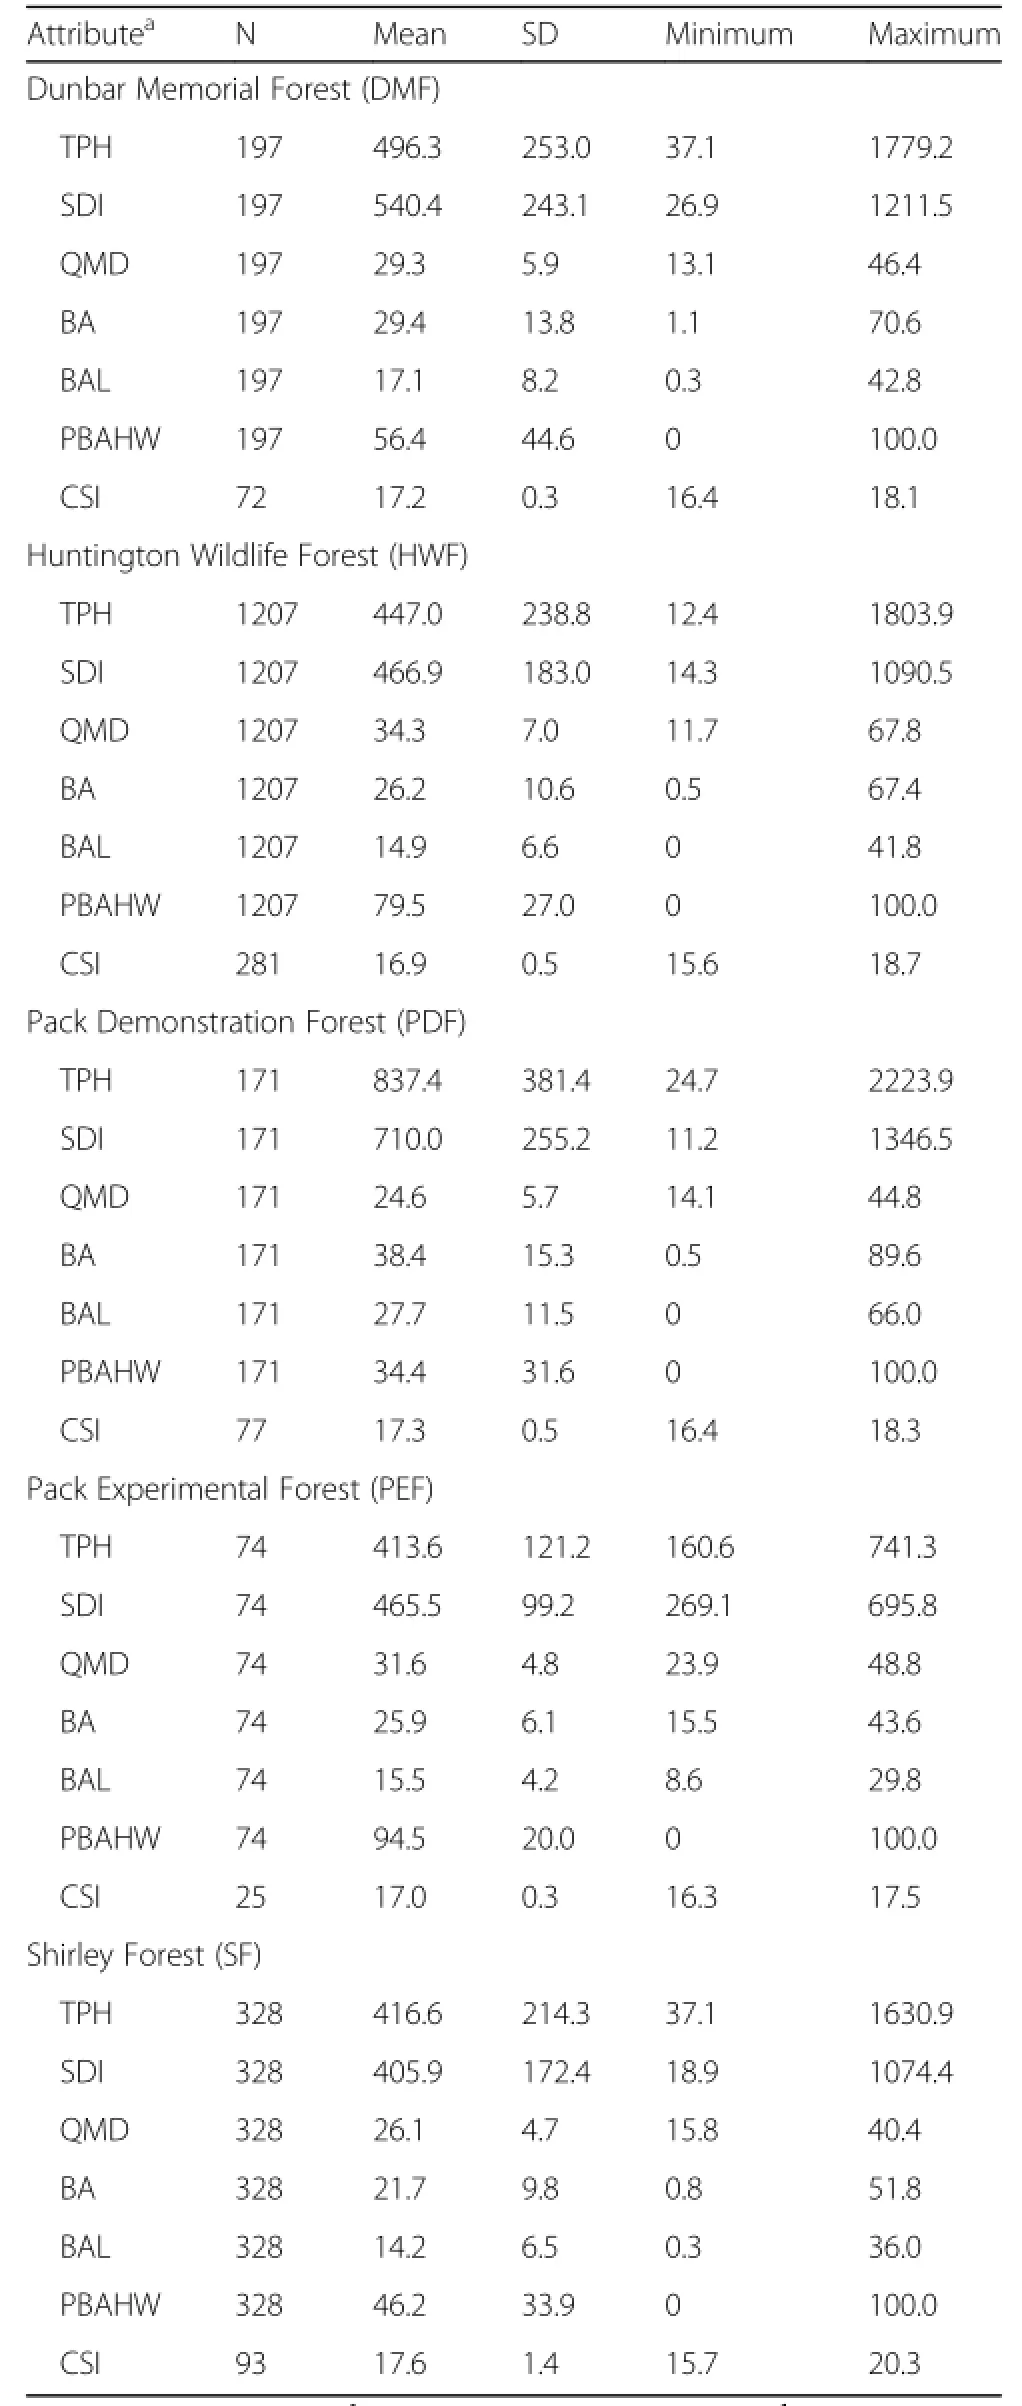
Table 3 Key plot– and tree–levelattributes by forest
Simulations
To evaluate the long–term behavior of the equations,a simulation model was constructed by linking all of the component equations and using them to project each plot from its initial to final measurement.Missing total tree heights at the start of each plot specific simulation run were predicted using Eq.[1],while subsequent height growth was predicted with Eq.[4].Due to its importance on long–term simulations,the prediction of tree mortality was handled in two ways,namely an expansion factor method and a fixed cutpoint(Weiskittel et al.2011a).In the expansion factor method,the tree’s expansion factor was annually multiplied by the probability of survival(Eq.[5]),while in the fixed cutpoint method an entire tree record was killed if the probability of survival exceeded the optimal cutpoint derived from the species specific survival equations.Plots that were harvested or showed signs of either excessive mortality (>20%of total basal area)or excessive ingrowth(≥5 trees)were included up until the occurrence of the event.MB and RMSE were computed for key stand–level attributes like stem density and basal area.Finally, some common forest types in the region were projected for 50 years assuming similar initialstarting conditions.
Results
Total height
A total of 7575 observations were available for the total height equation with most of the observations being sugar maple(22.1%),yellow birch(13.1%),American beech(12.3%),and red maple(10.9%).For most species, an equivalence test suggested that the observed values and the predicted values from FVS–NE were not statistically different at the 15%levels of allowable error (Table 4).Species–specific equations were developed and resulted in RMSE between 2.5 to 4.5 m.For a given set of covariates,sugar maple had the greatest total height,while eastern hemlock had the smallest(Fig.1).
Bole height
A total of 7150 observations were available for the bole height equation with most of the observations being sugar maple(22.4%),yellow birch(13.0%),American beech(11.7%),and red maple(11.0%).For all species,an equivalence test suggested that the observed values and those predicted by FVS–NE were statistically different at the 15%levels of allowable error(Table 5).Species–specific equations were developed and resulted in RMSE between 1.6 to 3.8 m.For a given set of covariates,sugar maple and white pine showed the highest bole height for the majority of DBH range examined,while eastern hemlock showed the lowest(Fig.1).
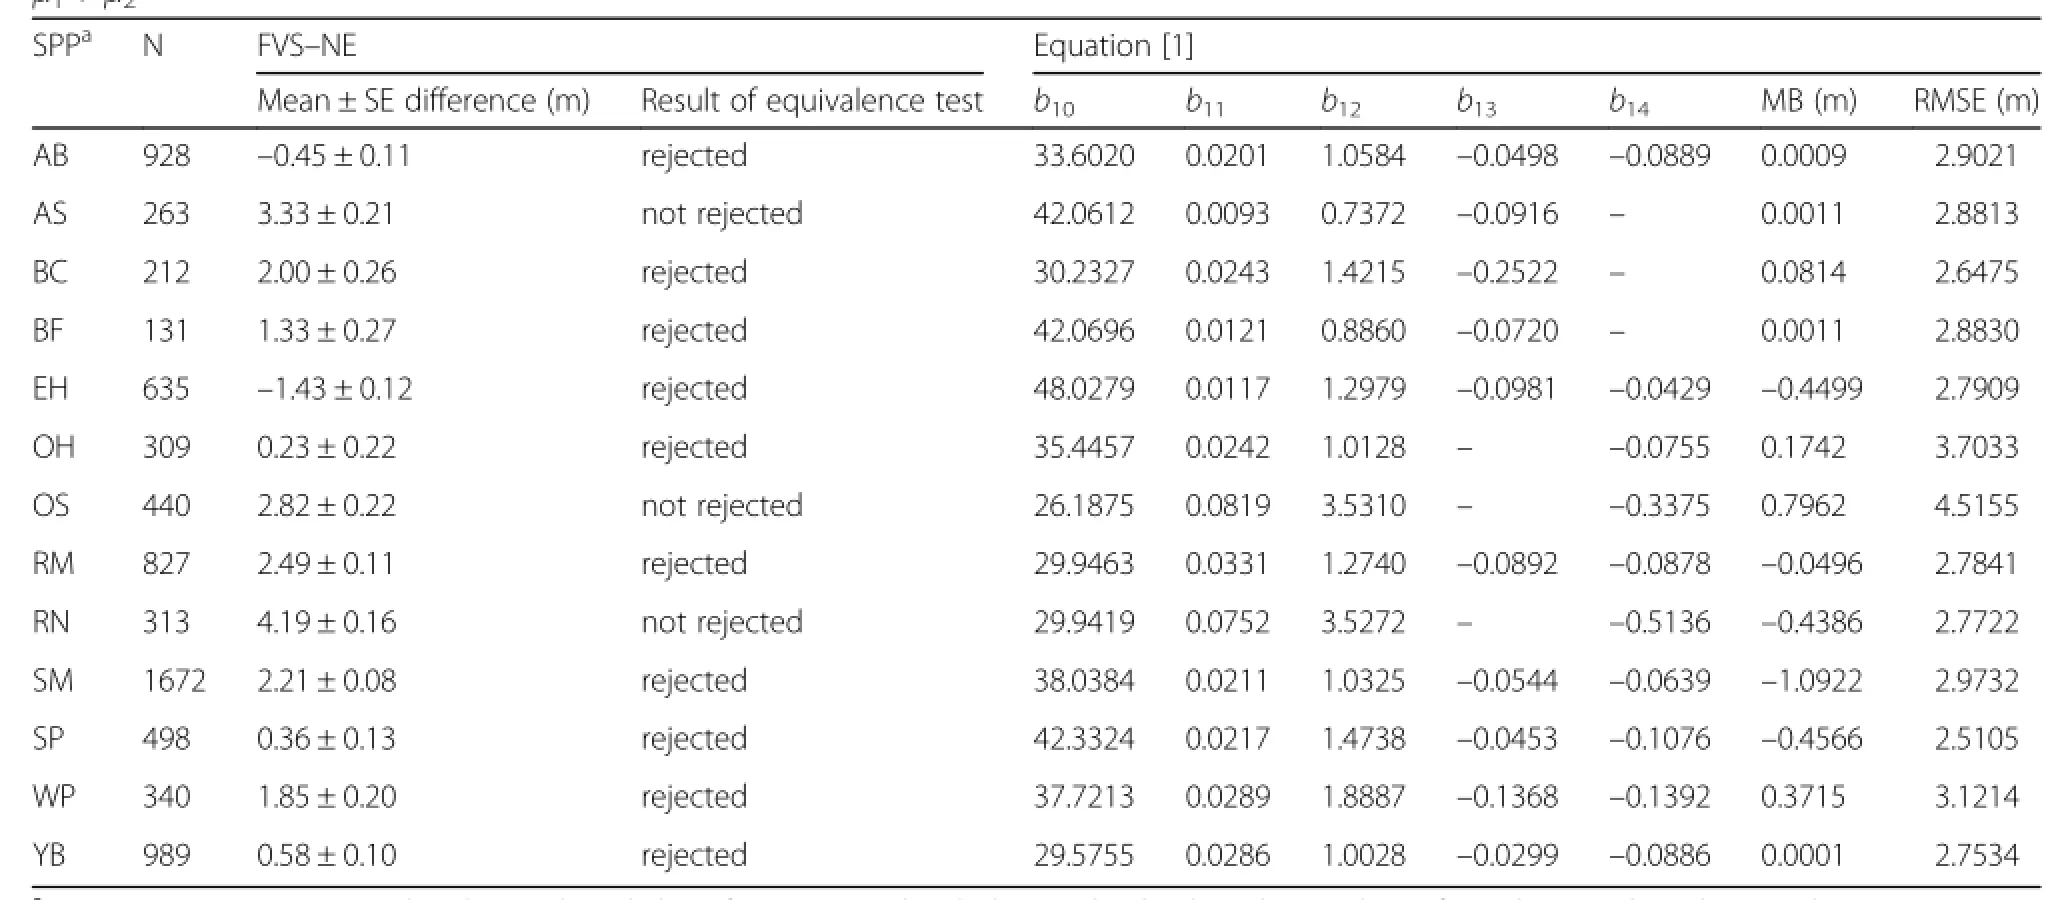
Table 4 Results ofthe equivalence test of the Northeast(NE)Variant of FVS for totalheight(m)and the parameter estimates and fit statistics for Eq.[1].Mean bias(MB;observed – predicted)and root mean square error(RMSE)were computed using the fixed effects only.Both mean difference and MB were computed as observed – predicted.The nullhypothesis for the equivalence test is thatμ1≠ μ2
Diameter increment
A total of 25,438 observations were available for the diameter increment equation with most of the observations being sugar maple(14.9%),white pine(14.8%), American beech(11.7%),and yellow birch(10.2%).An equivalence test suggested that for all species,the observed values and the predicted values from FVS–NE were statistically different at the 15%levels of allowable error(Table 6).Species–specific equations were developed and resulted in RMSE between 0.11 and 0.22 cm·yr–1.For a given set of covariates,red maple and American beech showed the greatest diameterincrement at smaller tree sizes(DBH < 25 cm),while white pine and eastern hemlock showed the greatest diameter increment for larger tree sizes(DBH > 25 cm; Fig.2).Spruces had the slowest diameter increment across a range of tree sizes.
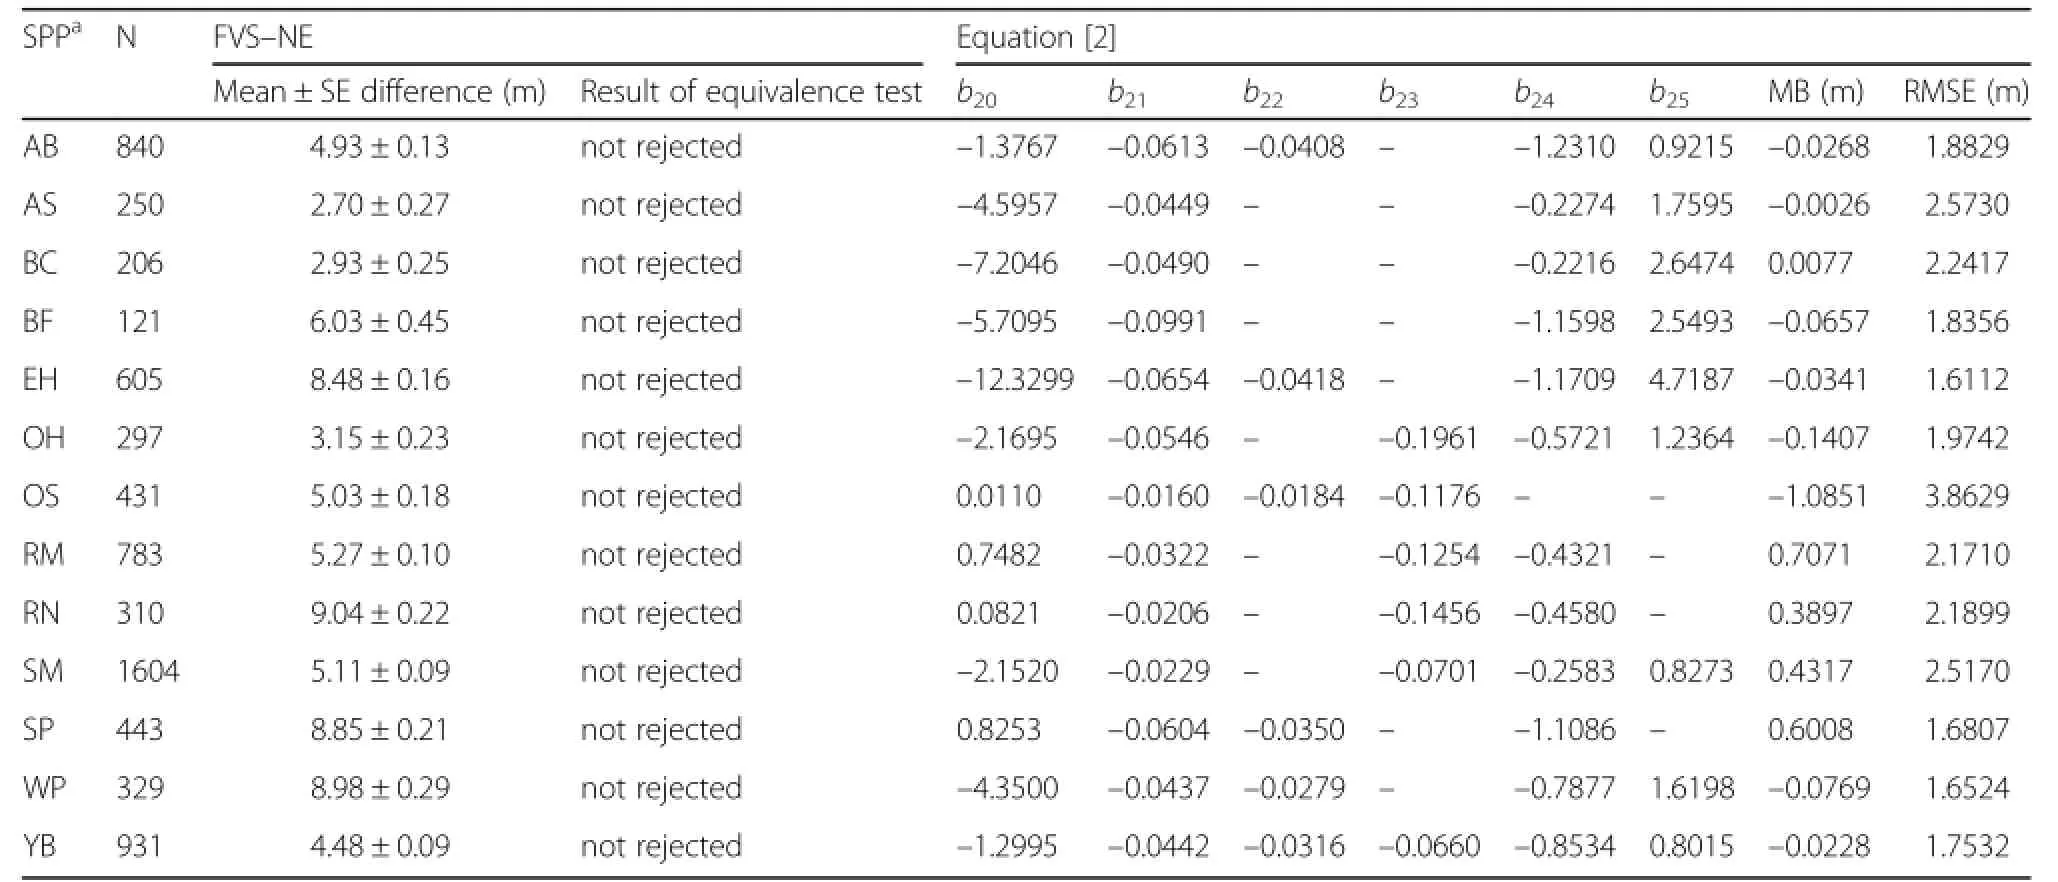
Table 5 Results ofthe equivalence test Northeast(NE)Variant of FVS for bole height(m)and the parameter estimates and fitstatistics for Eq.[2].Mean bias(MB;observed – predicted)and root mean square error(RMSE)were computed using the fixed effects only.Both mean difference and MB were computed as observed – predicted.The nullhypothesis for the equivalence test is thatμ1≠ μ2
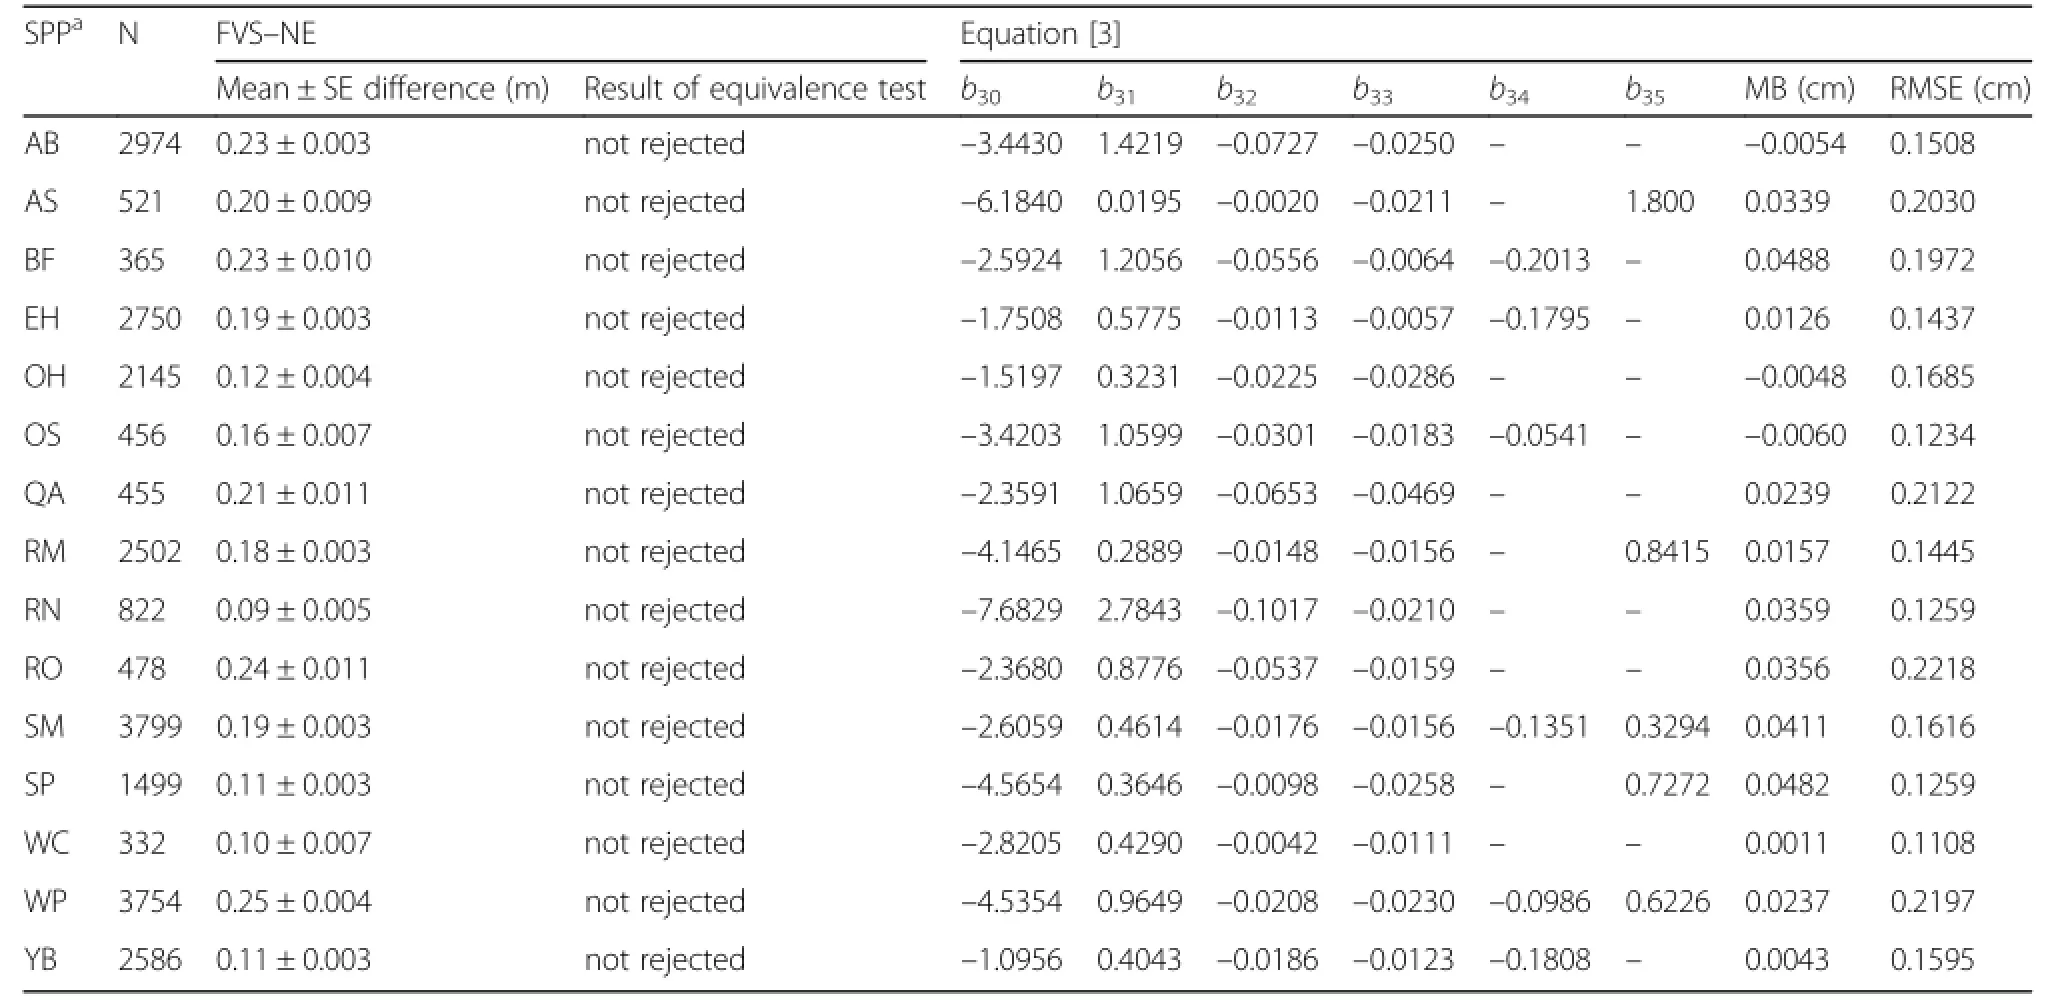
Table 6 Results of the equivalence test of Northeast Variant(NE)of FVS for diameter increment(cm yr–1)and the parameter estimates and fit statistics for Eq.[3].Mean bias(MB;observed – predicted)and root mean square error(RMSE)were computed using the fixed effects only.Both mean difference and MB were computed as observed – predicted.The nullhypothesis for the equivalence test is that μ1≠ μ2
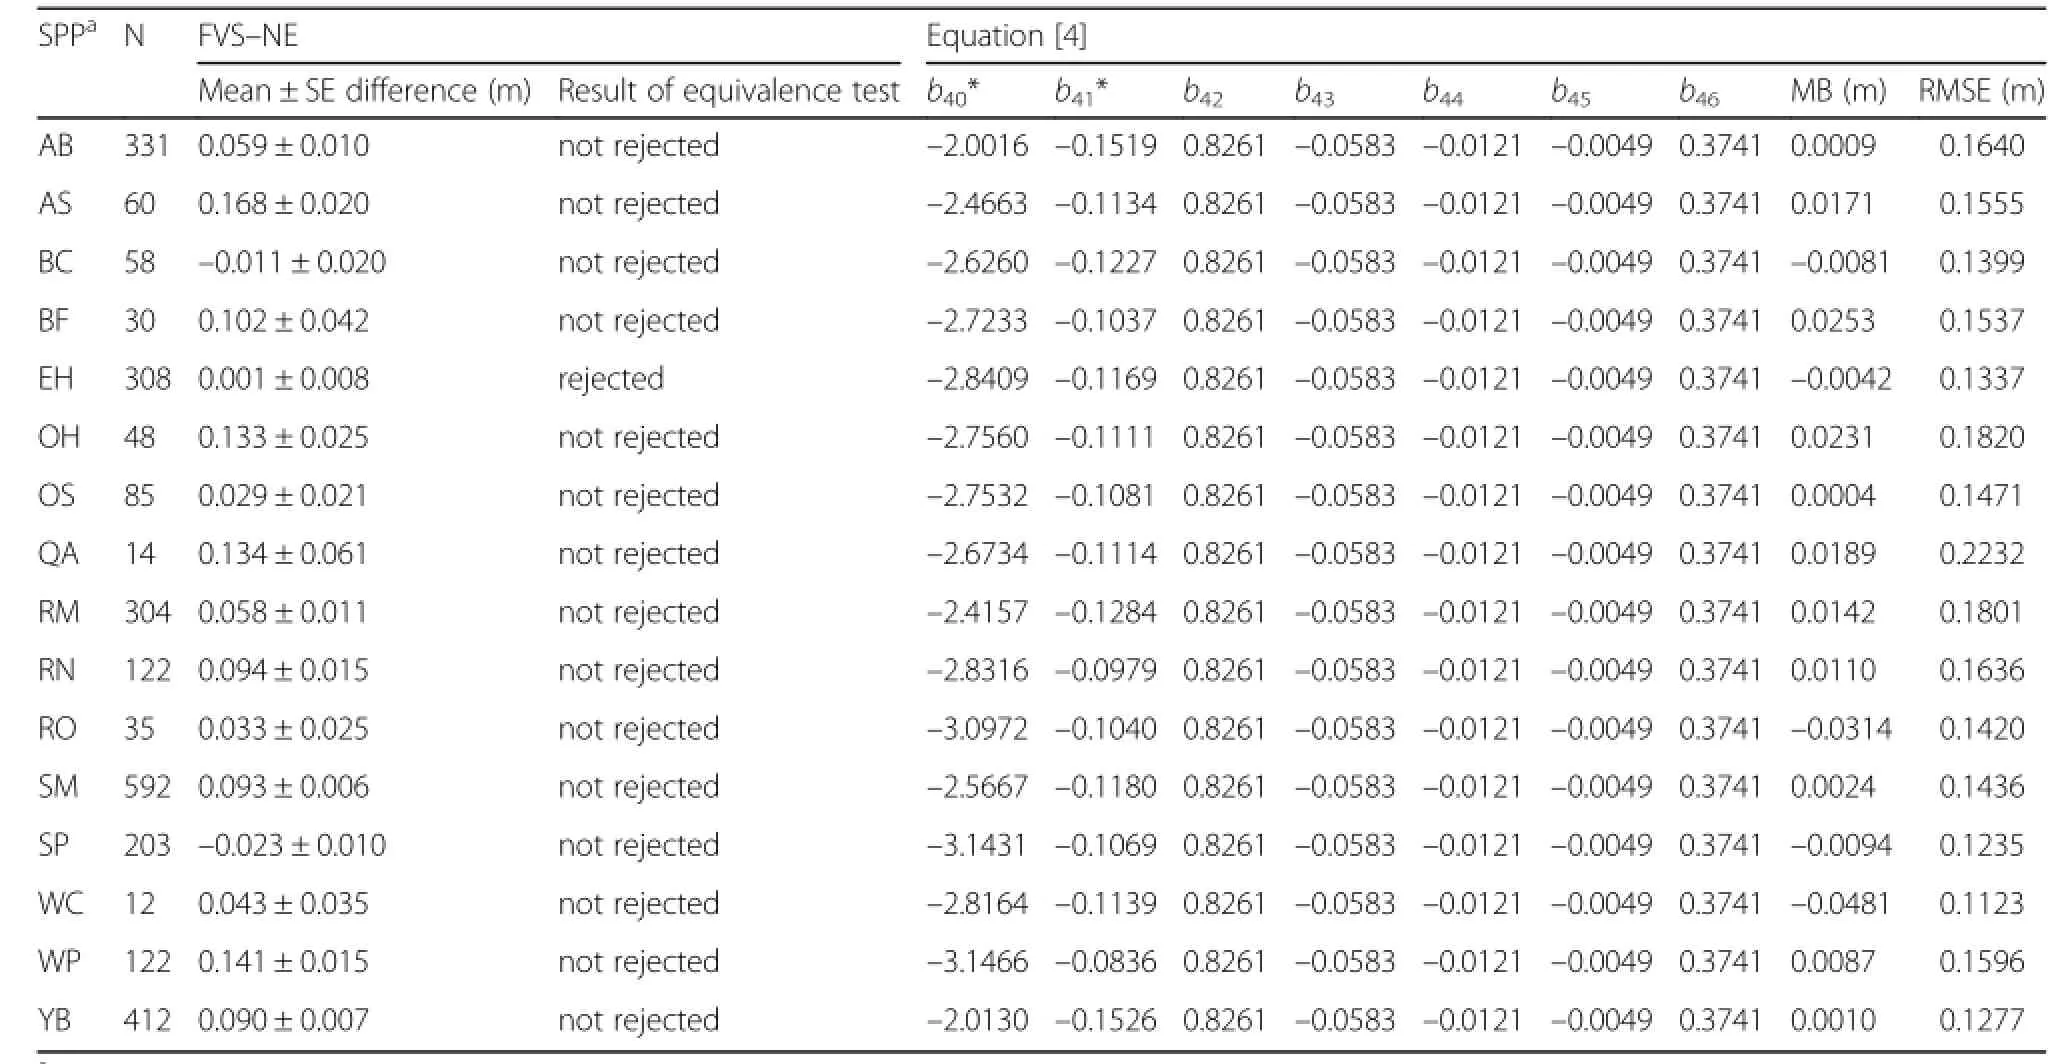
Table 7 Results of the equivalence test ofthe Northeast(NE)variants of FVS for height increment and the parameter estimates and fit statistics for Eq.[4].Mean bias(MB;observed – predicted)and root mean square error(RMSE)by species are presented.Both mean difference and MB were computed as observed – predicted.The nullhypothesis for the equivalence test is that μ1≠ μ2. Columns marked with an asterisk(*)were those that were treated as a random effect and presented as the fixed+species random effect

Table 8 Parameter estimates for individualtree survival(Eq.[5]),the area under the curve(AUC)and optimalcutpoint(OCP)for thedeveloped equation and the ones used in the Northeast Variant of FVS(FVS–NE)by species
Height increment
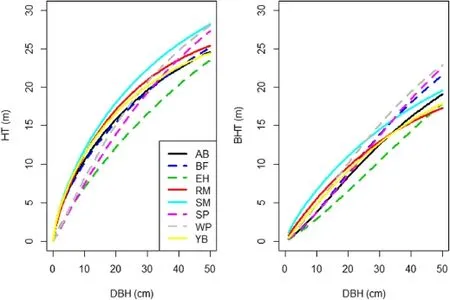
Fig.1 Predictions oftotalheight(HT,m)and bole height(BHT,m)across diameter at breast height(DBH,cm)for different species using Eqs.[1] and[2],respectively.Other equation covariates were set at mean levels,which were 10 m2 ha–1,25 m2 ha–1,and 17 m for basalarea in larger trees,totalbasalarea,and climate site index,respectively.Species are American beech(AB),balsam fir(BF),eastern hemlock(EH),red maple(RM), sugar maple(SM),spruce(SP),white pine(WP),and yellow birch(YB)

Fig.2 Predictions ofannualdiameter(ΔDBH,cm yr–1),height increment(ΔHT,m yr–1),and annualprobability ofsurvivalacross diameterat breast height(DBH,cm)for different species using Eqs.[3],[4],and[5]respectively.Forallequations,basalarea in larger trees,totalbasalarea, crown ratio,and climate site index were fixed at 10 m2 ha–1,25 m2 ha–1,0.33,and 17 m,respectively.Forheight increment,totalheight(HT, m)was varied as fixed percentage ofthe DBH(HT=DBH × 0.6).Species are American beech(AB),balsam fir(BF),eastern hemlock(EH),red maple (RM),sugar maple(SM),spruce(SP),white pine(WP),and yellow birch(YB)
A total of 2744 observations were available for the height increment equation with most of the observation being sugar maple(21.6%),yellow birch(15.3%),American beech(12.1%),and eastern hemlock(11.2%).For all species except eastern hemlock,an equivalence test suggested that the observed values and those predicted by FVS–NE were statistically different at the 15%level of allowable error(Table 7).As mentioned in the Methods section,a preliminary species–specific equation did not converge for the majority of species so an equation was fitted by using species as random effect.This resulted in an adequate fit with RMSE ranging from 0.16 to 0.25 m·yr–1.
For a given set of covariates,yellow birch and American beech had the greatest height increment for smaller tree sizes(DBH < 25 cm),while spruce had the smallest height increment(Fig.2).On larger trees(DBH >25 cm),white pine and balsam fir had the greatest height increment and American beech and yellow birch had the lowest.Since small–sized suppressed yellow birch individuals were not available for our analysis,predicted height growth thus might be too optimistic.
Survival
A total of 28,791 observations were available for the survival analysis with most of the observation being sugar maple(14.6%),white pine(13.9%),American beech (12.5%),and yellow birch(10.2%).Balsam fir(28.5%), quaking aspen(19.0%),American beech(16.6%),and other softwoods(14.4%)showed the highest percentage of dead trees.A species–specific survival equation fit to the data showed a much higher AUC(0.74 ± 0.08;0.63 –0.95)compared to FVS–NE predictions(0.57 ± 0.09;0.46– 0.69,Table 8).The determined optimalcutpoint varied by species and ranged from 0.75 to 0.98.Across the various tree sizes examined,red maple showed the highest levelof survival,while American beech and balsam fir displayed some ofthe lowest predicted survivalrates(Fig.2).
Long–term simulations
Based on the initial plot tree list,the component equations described above were used to project the plot from its first to last measurement.The simulations ranged from 7 to 41 years in length with an average of 22.1 ± 11.3 years.Tree–level mortality was estimated using either the expansion factor reduction or species–specific optimal cutpoints derived from the survival equations (Eq.[5]).At the tree–level,the equations did not show a high degree of bias with prediction of crown recession having the highest error.A minor decreasing trend in error across total tree height was apparent.Across species,the best performance was achieved for eastern hemlock and red maple,while the poorest performance was for spruce.At the stand–level,using the optimal species cutpoint for mortality was shown to be superior as the mean percent bias ranged from –2.4%to 4.6% with the error being the highest for total stem density (Table 9).Only minor trends were evident across the range of observed values or projection lengths(Fig.3).
For the different forest types tested,growth was fairly linear for the 50 year projections when using either the expansion factor method or the optimal cutpoint method(Fig.4).Overall,the hardwood dominated stand types showed greater growth when compared to thesoftwood dominated ones.The totalbasalarea values(10.5– 17.1 and 15.7 – 17.7 m2·ha–1)and basal area growth rates(0.19 – 0.32 and 0.27 – 0.33 m2·ha–1·yr–1for the expansion factor and the optimal cutpoint method,respectively)were allwithin reason of the generalexpectations for the region.
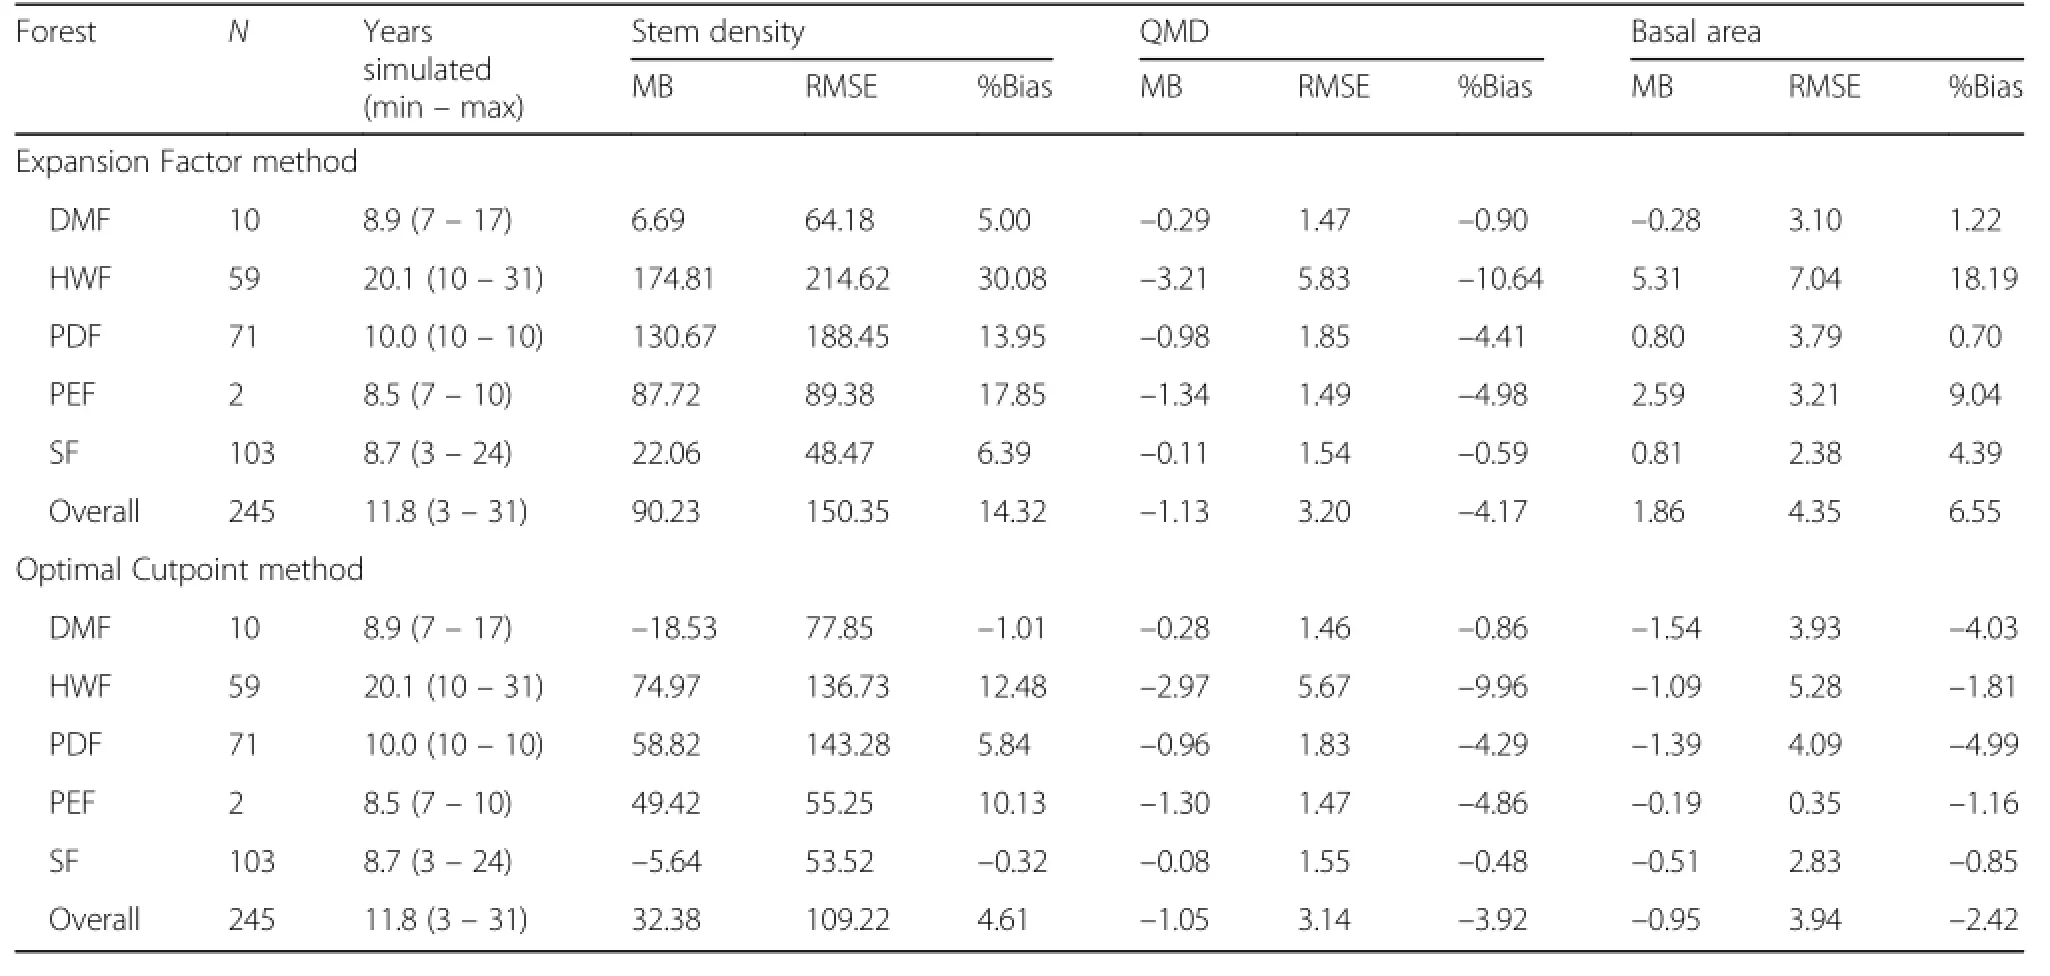
Table 9 Stand–levelprojection mean bias(MB;observed – predicted),root mean square error(RMSE),and percent bias(%Bias)for totalstem density(#ha–1),quadratic mean diameter(QMD;cm),and basalarea(m2 ha–1)by tree mortality method and forest, which are Dubuar MemorialForest(DMF),Huntington Wildlife Forest(HWF),Pack Demonstration Forest(PDF),Pack Experimental Forest(PEF),and Shirley Forest(SF)

Fig.3 Prediction bias(observed – predicted)for stem density(#ha–1),quadratic mean diameter(cm),and totalbasalarea(m2 ha–1)over observed values(left)and years in projection(right)using the different methods for simulating individualtree mortality.The expansion factor method is where the predicted probability ofsurvivalis multiplied by the tree’s current expansion factor,while the optimalcutpoint method is where an entire tree record is killed when the predicted probability ofsurvivalfalls below the species optimalcutpoint
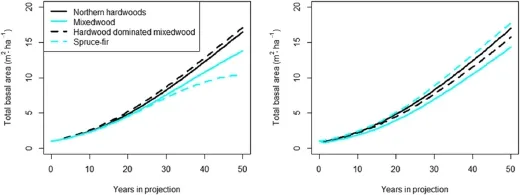
Fig.4 Fifty year projections oftotalbasalarea(m2 ha–1)ofcommon forest types using the developed equations and the expansion factor method(left)orthe optimalcutpoint method(right),respectively.Each forest type was initialized with 500 stems per ha of 5 cm diameter at breast height.Northern hardwoods was an equalmixture of American beech,black cherry,red maple,sugar maple,and yellow birch.Mixedwood was red spruce,balsam fir,eastern hemlock,and red maple with some American beech,white pine,and yellow birch.Hardwood dominated mixedwood was American beech,eastern hemlock,red spruce,sugarmaple,and yellow birch.Spruce–firwas an equalmixture ofred spruce and balsam fir
Discussion
To our knowledge,this effortrepresents the first attempt to develop an individual tree growth model specific to the range of tree species present in the Adirondacks Region of New York.Other efforts to model growth and yield in the region have only focused on plantation conifer species(Pan and Raynal1995),hardwood species under a specific set of stand conditions like sugar maple in uneven–aged selection stands(Kiernan et al.2009a,b),or pure hardwood stands (Aldridge 1982).Based on the assessment of the existing FVS–NE component equations,the Adirondacks Region appear to be a distinct ecologicalarea that is deserving ofa growth model specific to the present conditions.This is likely because the Adirondacks Region generally shows a higher potential productivity,a greater hardwood composition,and more intensive history of high–grading when compared to certain other parts of the Northeast.In particular,the Adirondacks Region has a disturbance regime predominated more by wind and ice(Lorimer and White 2003)and a history of highly selective logging in previously cutover old–growth hardwood stands(Berven et al.2013), which both create relatively complex and mixed species stands.
The Adirondacks forest data used in this analysis represents the tremendous value ofan intensive and well–maintained CFI system as it provided between 2 to 52 years of regular tree–levelremeasurement data.The plots were well maintained,relatively large(0.04 – 0.08 ha),and representative of the conditions of the studied region.Initially,US Forest Service Forest Inventory and Analysis(FIA)data in New York was also considered in this analysis,but it was deemed of limited value given the relatively small plot size used(0.016 ha),the low number of remeasurements,and the generallack oftotaltree height measurements.Overall, the data used was determined to be of a sufficient size and scope with a fullrange ofstand structure and compositions present.As common,plots in late–successional stands were not frequent and this may limit the growth model’s ability to extrapolate to those conditions.However,the lack of forest managementon the Pack ExperimentalForest has created some mature stands with dynamics controlled primarily by natural factors.However,these CFI were relatively smaller than plots used in research,which may influence the estimate of key stand– and tree–level variables used during modeling.
In general,the component equations fit well and showed adequate performance when conducting long–term simulations.Consistent with other tree–levelgrowth models,totalheight equations fit the best,while heightincrement and mortality equations were the most problematic.For total and bole height,FVS–NE tended to underpredict these values,which has important consequences for future projections.In contrast,Rijal et al. (2012a,b)found that FVS–NE generally overestimated total height in the Acadian Region,while Russell et al. (2013)indicated both under– and over–estimation across the primary species in the Northeast US.The underprediction here was likely reflective of the better growing conditions in the lower elevations of the Adirondacks Region.Given the use of bole height(defined as the first live branch or a 10.2 cm(4 in)top),prediction using height to crown base or crown ratio equations of FVS–NE were expected to be biased,which was confirmed by the data.However,the fitted bole height equation fit the data well,but utilizing it to estimate a modified form of crownratio proved not very usefulfor the other equations developed in this analysis.
In this analysis,the diameter and height increment equations proved particularly challenging due to remeasurement data only being available for trees > 10 cm in DBH and a general lack of height remeasurement data, respectively.However,relatively well–behaved and logical increment equations were constructed.In fact,to ensure proper fit and behavior of the height increment equation,it was estimated by treating species as a random effect rather than determining parameters by species like the diameter increment equation.Developing height increment equations by treating species as a random effect has been shown to be an effective technique when compared to fitting the equations by species(Russell et al.2014).This is because all of the existing data can be used and species–specific parameters still extracted,which is particularly important for minor species that may not have observations across their full range.Consistent with Russellet al.(2014),this was found to be the case in this analysis.Using binary indicators for species to fit the equation was also an alternative option, but was determined to be inefficient given the number of species being examined and notfurther explored.
For mortality,the AUC for most species was approximately 0.75,which represents an acceptable to excellent discrimination of alive and dead trees(Hosmer and Lemeshow 2000).Thus,the equation was a significant improvement over the FVS–NE individual tree mortality equations.A variety of other modelforms and implementation techniques were evaluated,but significant improvements were not achieved.Based on the observed stand–level bias,the equation appears to perform reasonably well,particularly if the whole tree approach with optimal species cutpoints was used.Like this study,a previous study has also found that using a fixed cutpoint rather than the tree expansion factor reduction method was superior(Crecente–Campo et al.2009).In contrast, Rathbun et al.(2010)found just the opposite and suggested the tree expansion factor method to be superior, which indicates that additional research on the influence of how tree mortality is implemented in growth models, especially for long–term projections,is needed.However, both Crecente–Campo et al.(2009)and Rathbun et al. (2010)examined relatively short–term trends in mortality(1 – 17 years),while this analysis included plots simulated for over 40 years.Regardless,the findings highlights the sensitivity of models projections to mortality and likely a more sophisticated approach like a linked stand–and tree–level approach(e.g.Zhang et al.2011)is warranted.However,a linked approach would require the development of a stand–level mortality equation,which can be problematic for multi–cohort,mixed–species stands(Weiskittelet al.2011a).
Despite the difficulty of fitting individual component equations,the developed growth model shows good performance across a range of stand conditions.Using some of the longest validation data available in the Northeast(>50 years),the model showed only minor signs of increasing bias with greater projection lengths.The simulations for the different common forest types in the region were logical and met expectations as the hardwood dominated stands showed the greatest growth and spruce–fir the least.In this region,northern hardwood and mixedwood stands tend to occur on the best sites with deep and well–drained soils,while spruce–fir tend to occur in more poorly–drained flats.The observed annual total basal area growth rates were also consistent with typical regional values(e.g.Solomon 1977),while differences found between expansion factor and optimal cutpoint method in the 50 year projections again reflect the significance of the mortality approach applied.
Conclusions
Given the importance and uniqueness of the Adirondacks Region,an individualtree growth and yield modelwas developed based on existing,long–term CFIdata(>50 years) for the region.The developed equations performed well despite high variability in the data and incomplete histories of past stand disturbances and harvesting practices. When the equations were combined into a growth and yield system,long–term behavior was consistent with observed trends and general expectations.Interestingly, long–term model performance was improved when using a whole–tree rather than expansion factor approach to individualtree survival.In addition,projections for the common forest types for the region indicated that mixed hardwood stands tended to outperform mixed and/or pure softwoods stands.Important next steps include evaluating the model’s behavior in stands with varying management regimes,developing equations to predict ingrowth(e.g.Li et al.2011),and assessing alternative approaches to forecasting mortality(e.g.Zhang et al.2011).
Acknowledgments
Specialthanks to State University ofNew York College ofEnvironmental Forestry,Adrironack Ecological Center,and Frank Shirley for providing access to the data.Bruce Breitmeyerprovided extensive guidance on the SUNY data and the methods used to collectit.FVS–NE code was provided by Dr.Matthew Russell.Feedback provided by Drs.MichaelSaunders,Phillip Radtke,Robert Seymour and two anonymous reviewers helped to improve a previous version ofthis manuscript.
Authors’contributions
AW wrote the manuscript and assisted with the analysis.CK completed the analysis and prepared all manuscript tables and figures.JPM and MO provided input on the manuscript text and modeling approaches used. All authors read and approved the final manuscript.
Authors’information
AW is Associate Professor of Forest Modeling and Biometrics atthe Schoolof Forest Resources atthe University of Maine.CK is a postdoctoralresearch associate in forestgrowth and yield modelling atthe Schoolof Forest Resources at the University of Maine.JPM is research scientist at Rayonier Forest Research Centerand MO is an inventory analystfor Rayonier Forest Resources.
Competing interests
The authors declare that they have no competing interests.
Author details
1University of Maine,Schoolof Forest Resources,Orono,ME 04469,USA.
2Rayonier,Forest Research Center,Yulee,FL 32041,USA.3Rayonier Forest Resources,Fernandina Beach,FL 32035,USA.4University of Maine,5755 Nutting Hall,Orono,ME 04469-5755,USA.
Received:28 September 2016 Accepted:14 November 2016
Aldridge SM(1982)An analysis ofnorthern hardwoods permanentsample plots on State Forest Lands in New York.M.S.Thesis.State University of New York, College of Environmental Science and Forestry,Syracuse,p 471
Beier CM,Stella JC,Dovčiak M,McNulty SA(2012)Localclimatic drivers of changesin phenology ata boreal–temperate ecotone in eastern North America.Clim Change 115:399–417
Berven K,Kenefic L,Weiskittel AR,Twery M,Wilson J(2013)The lost research of early northeastern spruce–fir experimentalforests:A tale oflost opportunities.In:Camp AE,Irland LC,CarrollCJW(eds)Long–term silviculturaland ecologicalstudies,Results for science and management,vol 2,Global Institute of Sustainable Forestry Research Paper 013.Yale University, New Haven,pp 103–115
Cao QV(2000)Prediction ofannualdiametergrowth and survivalforindividual trees from periodic measurements.Forest Sci46:127–131
Chen L,DriscollCT,Gbondo–Tugbawa S,MitchellMJ,Murdoch PS(2004) The application of an integrated biogeochemicalmodel(PnET–BGC)to five forested watersheds in the Adirondack and Catskillregions ofNew York. HydrolProc 18:2631–2650
Crecente–Campo F,Marshall P,Rodríguez–Soalleiro R(2009)Modeling non–catastrophic individual–tree mortality for Pinus radiata plantations in northwestern Spain.For EcolManage 257:1542–1550
Dixon GE,White R,Frank J(2007)Northeast(NE)variant overview.USDA Forest Service,Forest Management Service Center,Fort Collins
Engelman HM,Nyland RD(2006)Interference to hardwood regeneration in Northeastern North America:Assessing and countering ferns in northern hardwood forests.North J Appl For23:166–175
Germain RH,Nowak CA,Wagner JE(2016)The tree that built America – not making the grade.JFor 114:552–561
Hann DW,MarshallDD,Hanus ML(2003)Equations forpredicting height–to–crown base,5–year diameter growth rate,5–year height growth rate,5–year mortality rate,and maximum size–density trajectory for Douglas–fir and western hemlock in the coastalregion of the Pacific Northwest.Oregon State University,College ofForestry Research Laboratory,Corvallis
Hein S,Weiskittel AR(2010)Cutpoint analysis for models with binary outcomes:a case study on branch mortality.Eur J For Res 129:585–590
Hilt DE,Teck R(1989)NE–TWIGS:An individualtree growth and yield projection system forNortheastern United States.Compiler7:10–16
Hosmer DW,Lemeshow S(2000)Applied logistic regression,2nd edn.Wiley,New York
Jiang H,Radtke PJ,WeiskittelAR,Coulston JW,Guertin PJ(2015)Climate– and soil–based models ofsite productivity in eastern US tree species.Can JFor Res 45:325–342.
Juma R,Pukkala T,de–MiguelS,MuchiriM(2014)Evaluation ofdifferentapproaches to individualtree growth and survivalmodelling using data collected at irregularintervals – a case study for Pinus patula in Kenya.Forest Ecosyst1:14
Kiernan DH,Bevilacqua E,Nyland RD(2009a)Individual–tree diametergrowth modelfor sugar maple trees in uneven–aged northern hardwood stands under selection system.For Ecol Manage 256:1579 –1586
Kiernan DH,Bevilacqua E,Nyland RD,Zhang L(2009b)Modeling tree mortality in low– to medium–density uneven–aged hardwood standsundera selection system using generalized estimating equations.Forest Sci55:343–351
LiR,WeiskittelAR,Kerhsaw JA Jr(2011)Modeling annualized occurrence, frequency,and composition ofingrowth using mixed–effects zero–inflated models and permanent plots in the Acadian Forest Region of North America. Can JFor Res 41:2077–2089
Leopold DJ,Reschke C,Smith DS(1988)Old–growth forests of Adirondack Park, New York.Nat Area J8:166–189
Lorimer CG,White AS(2003)Scale and frequency of natural disturbances in the northeastern US:implications for early successionalforest habitats and regional age distributions.For Ecol Manage 185:41–64
McGee GG(2000)The contribution ofbeech bark disease–induced mortality to coarse woody debris loads in northern hardwood stands of Adirondack Park, New York,USA.Can J For Res 30:1453–1462
McMartin B(1994)The Great Forest ofthe Adirondacks.North Country Books, Utica,New York
Newton PF,Amponsah IG(2007)Comparative evaluation offive height–diameter models developed for black spruce and jack pine stand–types in terms of goodness–of–fit,lack–of–fit and predictive ability.For Eco Manage 247:149–166
Pan Y,RaynalDJ(1995)Predicting growth of plantation conifers in the Adirondack Mountains in response to climate change.Can JFor Res 25:48–56
Pandit K,Bevilacqua E,Perry JA(2012)Evaluating biasand accuracy ofForest vegetation simulator in predicting basalarea and diameter growth ofmajor forest types within New York State.16th Annual Northeastern Mensurationists Organization Meeting,State College
Pinheiro J,Bates D,DebRoy S,Sarkar D(2016)nlme:linear and nonlinear mixed effects models.R package version 3.1–128.Available at:https://cran.r-project. org/web/packages/nlme/index.html.Accessed 20 Nov 2016.
Rathbun LC,LeMay V,Smith N(2010)Modeling mortality in mixed–species standsofcoastalBritish Columbia.Can JFor Res40:1517–1528
Ray DG,Saunders MR,Seymour RS(2009)Recent changes to the Northeast Variant ofthe Forest Vegetation Simulator and some basic strategies for improving modeloutputs.North JApplFor26:31–34
R Core Team(2016)R:a language and environment for statisticalcomputing.R Foundation forStatisticalComputing,Vienna.https://www.R-project.org. Accessed 20 Nov 2016.
Rijal B,Weiskittel AR,Kershaw Jr JA(2012a)Development of heightto crown base models for thirteen tree species ofthe North American Acadian Region. Forest Chron 88:60–73
Rijal B,Weiskittel AR,Kershaw Jr JA(2012b)Development ofregionalheight to diameterequations for fifteen tree species in the North American Acadian Region.Forestry 85:379–390
Robin X,Turck N,Hainard A,TibertiN,Lisacek F,Sanchez JC,Müller M(2011) pROC:an open–source package for R and S+to analyze and compare ROC curves.BMC Bioinformatics12:1
Robinson AP,Froese RE(2004)Modelvalidation using equivalence tests.Ecol Model176:349–358
Robinson AP,Wykoff WR(2004)Inputting missing height measurements using a mixed–effects modeling strategy.Can JFor Res 34:2492–2500
Rota M,Antolini L(2014)Finding the optimalcut–pointfor Gaussian and Gamma distributed biomarkers.Comput Stat Data An 69:1–14
Russell MB,Weiskittel AR,Kershaw JA Jr(2013)Benchmarking and calibration of ForestVegetation Simulatorindividualtree attribute predictions across the Northeastern United States.North J Appl For30:75–84
RussellMB,WeiskittelAR,Kershaw JA Jr(2014)Comparing strategies for modeling individual–tree height and height–to–crown base increment in mixed–species Acadian forests ofnortheastern North America.Eur J For Res 133:1121–1135
Solomon DS(1977)The Influence of stand density and structure on growth of northern hardwoods in New England.USDA For.Serv.Res.Pap.NE–362.p 13
Stout SL,Nyland RD(1986)Role ofspecies composition in relative density measurement in Allegheny hardwoods.Can JForest Res 16:574–579
Weiskittel AR,Hann DW,Kershaw Jr JA,Vanclay JK(2011a).Forest growth and yield modeling.Wiley&Sons,Chichester
Weiskittel AR,RussellMB,Wagner RG,Seymour RS(2012)Refinement ofthe ForestVegetation Simulatornortheastern variantgrowth and yield model: Phase III.Cooperative Forestry Research Unit Annual Report.University of Maine,Schoolof Forest Resources,Orono,pp 96–104
Weiskittel AR,Garber SM,Johnson GP,Maguire DA,Monserud RA(2007) Annualized diameter and height growth equations for Pacific Northwestplantation–grown Douglas–fir,western hemlock,and red alder.For Ecol Manage 250:266–278
Weiskittel AR,Wagner RG,Seymour RS(2011b)Refinement ofthe Forest Vegetation Simulator,Northeastern Variantgrowth and yield model:Phase 2. Cooperative Forestry Research Unit Annual Report.University of Maine, Schoolof Forest Resources,Orono,pp 44–48
WoodallCW,Miles PD,Vissage JS(2005)Determining maximum stand density index in mixed speciesstands forstrategic–scale stocking assessments.For Ecol Manage 216:367–377
Zhang X,LeiY,Cao QV,Chen X,Liu X(2011)Improving tree survivalprediction with forecast combination and disaggregation.Can J For Res 41:1928–1935
Aims and Scope
Forest Ecosystems is an internaonal Open Access journal publishing scientific communications from any discipline that can provide interesng contribuons about the structure and dynamics of “natural” and “domesticated” forest ecosystems, and their services to people. We welcome innovative science as well as application oriented work that will enhance understanding of woody plant communities. Very specific studies are welcome if they are part of a themac series that provides some holisc perspecve that is of general interest.
Open access
All articles published by Fo re st Ecosystems are made freely and permanently accessible online immediately upon publicaon, without subscripon charges or registraon barriers.
Authors of articles published in Forest Ecosystems are the copyright holders of their arcles and have granted to any third party, in advance and in perpetuity, the right to use, reproduce or disseminate the arcle, according to the SpringerOpen copyright and license agreement.
Arcle-processing charges
The publicaon costs for Forest Ecosystems are covered by Beijing Forestry University, so authors do not need to pay an arcle-processing charge.
Publicaon and peer review process
Authors will be able to check the progress of their manuscript through the submission system at any me by logging into Submit a manuscript, a personalized secon of the site.
Portability of peer review
In order to support effi cient and thorough peer review, we aim to reduce the number of times a manuscript is re-reviewed after rejection from Forest Ecosyste ms, thereby speeding up the publicaon process and reducing the burden on peer reviewers. Therefore, please note that, if a manuscript is not accepted for publicaon in Forest Ecosystems and the authors choose to submit a revised version to another SpringerOpen journal, we will pass the reviews on to the other journal's editors at the authors' request. We will reveal the reviewers' names to the handling editor for editorial purposes unless reviewers let us know when they return their report that they do not wish us to share their report with another SpringerOpen journal.
Editorial policies
Any manuscript, or substanal parts of it, submied to the journal must not be under consideraon by any other journal. In general, the manuscript should not have already been published in any journal or other citable form, although it may have been deposited on a preprint server. Authors are required to ensure that no material submied as part of a manuscript infringes exisng copyrights, or the rights of a third party.
Plagiarism detecon
Forest Ecosystems's publisher, SpringerOpen, is a member of the CrossCheck plagiarism detecon iniave. In cases of suspected plagiarism CrossCheck is available to the editors of Forest Ecosystems to detect instances of overlapping and similar text in submitted manuscripts by using the plagiarism detecon tool iThencate. Cross-Check is a mul-publisher iniave allowing screening of published and submied content for originality.
Cing arcles in Forest Ecosystems
Arcles in Forest Ecosystems should be cited in the same way as arcles in a tradional journal. Because arcles are not printed, they do not have page numbers; instead, they are given a unique arcle number.
Arcle citaons follow this format:
Auth ors: Title. Fo re st E co sy ste ms [yea r] [volume number]:[arcle number].
e.g. Corral-Rivas e t al.: Local and generalized heightdiameter models with random parameters for mixed, uneven-aged forests in Northwestern Durango, Mexico. Forest Ecosystems 2014 1:6.
refers to arcle 6 from Volume 1 of the journal.
For details of how to prepare and submit a manuscript through the online submission system, please see the instrucons for authors.
*Correspondence:christian.kuehne@maine.edu
1University of Maine,SchoolofForest Resources,Orono,ME 04469,USA
4University of Maine,5755 Nutting Hall,Orono,ME 04469-5755,USA
Fulllist ofauthor information is available at the end ofthe article
- Forest Ecosystems的其它文章
- Romanian legalmanagement rules limit wood production in Norway spruce and beech forests
- Life cycle cost and economic assessment of biochar-based bioenergy production and biochar land application in Northwestern Ontario,Canada
- Adaptation of forest management to climate change as perceived by forest owners and managers in Belgium
- Patterns offorest composition and their long term environmentaldrivers in the tropicaldry forest transition zone of southern Africa
- Drought sensitivity ofbeech on a shallow chalk soilin northeastern Germany – a comparative study
- Structure and dendroecology of Thuja occidentalis in disjunct stands south ofits contiguous range in the central Appalachian Mountains,USA

