
海拔对表居土壤动物不同取食功能群多度分布的影响*
2017-02-23 05:50:54徐国瑞张育新张霜马克明
土壤学报 2017年1期
徐国瑞张育新张 霜马克明†
(1 中国科学院生态环境研究中心,城市与区域生态国家重点实验室,北京 100085)
(2 中国科学院大学,北京 100049)
海拔对表居土壤动物不同取食功能群多度分布的影响*
徐国瑞1,2张育新1张 霜1马克明1†
(1 中国科学院生态环境研究中心,城市与区域生态国家重点实验室,北京 100085)
(2 中国科学院大学,北京 100049)
物种多度分布格局是群落生态学研究的前沿领域之一。海拔梯度下开展土壤动物多度分布研究有利于认识分解者群落的构建过程如何响应环境变化。选用5种常见的生态位分配模型(断棍模型、生态位优先占领模型、生态位重叠模型、随机分配模型和优势优先模型),分别采用个体数量与生物量作为多度表征指标,对分布于北京东灵山辽东栎林下不同海拔范围的表居土壤动物群落整体与不同取食功能群(杂食者、植食者、捕食者、腐食者)的相对多度分布进行研究。结果表明,拟合表居土壤动物群落整体的最优生态位分配模型不受海拔影响,均为断棍模型。但表居土壤动物各功能群多度分布受海拔影响,杂食者随海拔升高,最优模型由断棍模型转变为生态位优先占领模型,而植食者与之相反。多度表征指标选择影响拟合表居土壤动物不同功能群(捕食者和腐食者)多度分布的最优模型。总体而言,海拔和多度指标选择并未影响表居土壤动物整体的多度分布,但对表居土壤动物中不同取食功能群的多度分布有影响。
土壤动物群落;食性;生态位分配模型;群落构建;海拔
物种多度分布是群落生态学研究的根本和核心问题之一。多度格局是群落中各物种建立平衡最重要的体现,是资源竞争以及种群动态过程的结果。为从生物学机制上解释群落多度分布,阐明其背后的群落构建过程,生态学家们相继提出了众多生态位分配模型,如Macarthur的断棍模型[1]、Sugihara的生态位等级[2]以及Tokeshi的幂分形模型[3]等。这些机制模型假定生态位分化是物种共存的先决条件,多度与其分配的生态位大小存在直接关系[1-3],物种在单维或多维空间逐级破碎有限资源库最终形成了群落中各物种间的多度分布格局[2]。生态位分配模型在不同生物群落中相继应用,但在土壤动物中的研究较少,尤其是表居土壤动物。
土壤动物是生态系统中重要的生物组分,通过分解[4]、扰动[5]、生物级联[6]以及直接取食微生物和植物等,在生态系统功能过程[7]和生物地球化学循环中起着重要作用[8]。以往的研究主要集中描述环境或干扰梯度下土壤动物群落的多样性与结构变化[9],少有研究关注土壤动物群落多度分布格局及其可能的群落构建过程。考虑到表居土壤动物极高的多样性以及其在凋落物分解过程中的巨大作用(有研究表明表居土壤动物在全球尺度上将凋落物分解率提高了37%[10]),开展表居土壤动物相对多度分布研究对于认识多样化的土壤动物群落构建过程具有重要意义。生态位分配模型本质而言是物种具有相似的分类地位占据类似的资源,因此运用模型拟合的时候应该尽量考虑某一功能类群群落,而不仅仅是多样化的混合群落[11]。国内学者根据个体大小划分功能群分别研究了大型和中小型土壤动物相对多度分布,做出了有益尝试[12-13]。取食与营养循环、能量流动直接相关,根据食性划分土壤动物功能群更接近生态位分配模型的应用假设。比较表居土壤动物群落整体与不同取食功能群的相对多度分布,有利于从不同生物学作用尺度上认识土壤动物可能的群落构建过程。
环境变化也可能影响生物群落构建过程。海拔梯度为验证生物群落如何响应环境变化提供了理想的自然研究平台。作为一项重要的综合性环境因素,温度等环境因素以及生物类群会沿着海拔表现出某些变化规律,而这种变化势必会给群落内物种之间的相互作用带来影响[14],进而影响到生物群落的构建过程。海拔梯度上开展土壤动物群落的相对多度分布研究有利于进一步认识环境变化是如何影响整个分解者群落构建的。
多度表征指标可能会影响生态位分配模型拟合结果。多度表征指标主要包括物种的个体数量、生物量和能量利用等,但多数研究只采用个体数量,而个体数量能否反映群落内物种间的生物量或是能量分布存在争议[15]。对于多数生物类群而言,生物量分布较个体数量分布更不均匀。个体数量呈现出来的变异较生物量小,因此用个体数量作为生态位分配的替代参数可能会高估群落的均匀程度[15]。如果生态位等同于资源分配,生物量较个体数量更有意义,因为生物量与资源分形更为相关。考虑到表居土壤动物种群个体数量分布与生物量分布的巨大差异,有必要比较不同多度表征指标对于其多度分布生态位分配模型拟合结果的影响。
本研究选取研究区地带性植被辽东栎(wutaishansea Quercus)为主要林型,在其分布的海拔样带上,分别以土壤动物个体数量和生物量作为多度表征指标,研究表居土壤动物整体及不同功能群的相对多度分布,以期回答如下问题:(1)海拔是否影响表居土壤动物群落整体以及不同取食功能群的构建过程?(2)多度表征指标是否影响表居土壤动物群落整体以及不同取食功能群相对多度分布的生态位分配模型拟合结果?
1 材料与方法
1.1 研究区概况
北京森林生态系统定位研究站(40°00″~40°02″N,115°26″~115°30″E)位于北京市西郊门头沟区的东灵山,距离北京市约100 km。东灵山属太行山系,是小五台山向东延伸的支脉,与百花山山体相连,最高海拔2 303 m。该区属于暖温带半湿润大陆季风气候,年均温度5~10℃,无霜期长,年均降雨500~650 mm,多集中在夏季。土壤类型主要包括粗骨褐土(海拔1 000 m以下,本区地带性土类褐色土)、山地棕壤(海拔1 000~1 800 m的中山地带)和亚高山草甸土(1 800~2 300 m的山地顶部)。植被类型主要以暖温带落叶阔叶林为主。栎属(Quercus spp.)是本区域的地带性植被。
1.2 样带调查法
本研究采取样带调查法,在西坡沿着海拔梯度选择有辽东栎林分布的若干山体进行调查。共调查了10条样带,样带宽度为10 m,长度依据具体山体和坡位不同80~180 m不等。10条样带主要分布在以下三个区域:一一二区域(海拔范围1 020~1 240 m,总长350 m,后续分析以D1表示该区域)、南沟区域(海拔范围1 250~1 480 m,总长380 m,D2)和下马威区域(海拔范围1 490~1 770 m,总长460 m,D3),各区域的植被以及环境因素的变化情况详见在海拔样带上的已发表研究[16]。
1.3 土壤动物取样法
在辽东栎林样带内连续设置10 m×10 m样方作为基本调查单位(D1区域调查样方35个,D2区域38个,D3区域46个),在每个样方中随机选取3个0.5 m×0.5 m的小样方,将所有凋落物层装入布袋,转移至实验室,通过Tullgren干漏斗法获得表居土壤动物(干生),此法可以迅速获得除线虫等湿生动物外的多数干生土壤动物类群。鉴定并测量个体体长,根据体长—质量转化方程计算土壤动物质量[17]。相对多度由计算各区域内土壤动物各种群个体数量和生物量占该区域内各种群内部最大的个体数量和生物量的比例获得。根据土壤动物取食特性,将其划分为四大取食功能群:杂食性(Omnivores,缩写为O),植食性(Phytophage,Ph),捕食性(Predators,Pr),腐食性(Saprozoic,S)。
1.4 数据处理
本文以区域为分析单位,分别研究各海拔梯度下土壤动物群落总体以及不同土壤动物功能群的相对多度分布。所有图均在SigmaPlot12.0中绘制完成。
运用R3.0.2[18]的“vegan”包进行重抽样,获得不同抽样点的物种累计数。
物种相对多度排序(rank-abundance)图,又称为Whittaker图,可以同时解释群落多样性的两个方面,即群落所含物种的丰富程度和均匀程度。物种的丰富程度由曲线在横轴上的长度来反映,曲线越宽,表示物种的组成越丰富;物种组成的均匀程度由曲线的形状来反映,曲线越平坦,表示物种组成的均匀程度越高。本文分别选取个体数量和生物量作为多度表征指标。
选择了5个常用且容易计算的生态位分配模型[19-20]:断棍模型(broken stick model,BSM),生态位优先占领模型(niche preemption model,NPM),生态位重叠模型(overlapping niche model,ONM),随机分配模型(random assortment model,RAM),优势优先模型(dominance preemption model,DPM)。除随机分配模型外,其余4类模型均假定个体多度与其占据的生态位大小存在一定的关系,但是强弱程度有别[21]。
运用卡方分布(Chi-square test,χ2)检验与比较各生态位模型的适合性。χ2越小,模型的拟合效果就越好。总体检验时χ2大于1 000、分功能群检验时χ2大于100时均未通过检验。
2 结 果
2.1 表居土壤动物群落整体的生态位拟合模型
以个体数量为多度表征的多度秩(图1a)表明在高海拔地区(D3),土壤动物群落多度分布最不均匀,而低海拔(D1)与中海拔地区(D2)相对均匀。以生物量为多度表征的多度秩(图1b)表明在优势类群中,各海拔的生物量分布相对均匀,但是稀有类群(不足总体多度1%的类群)的生物量分布以低海拔(D1)最不均匀,其次为高海拔(D3),中海拔(D2)最均匀。
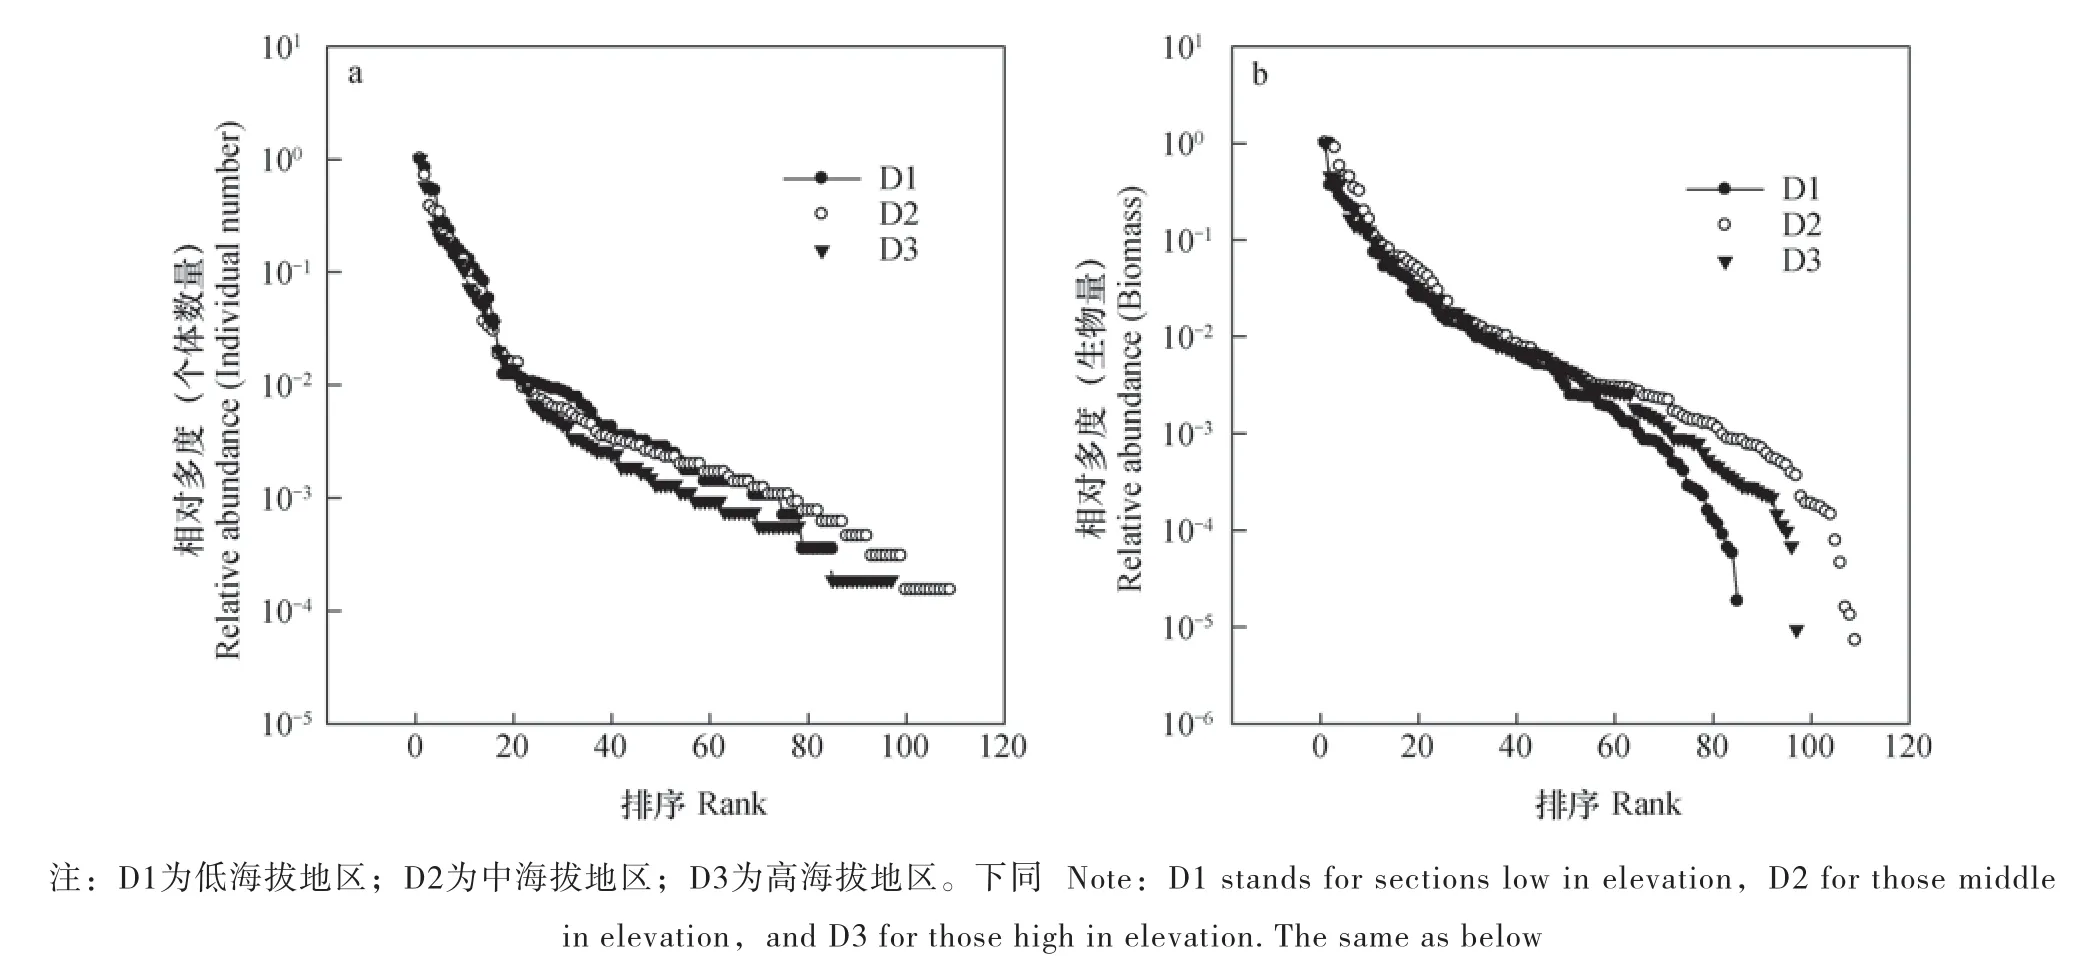
图1 土壤动物群落总体多度秩Fig. 1 Rank abundance of soil fauna as a whole
从图2中可以看出,海拔以及不同多度表征指标对于拟合表居土壤动物群落总体多度分布的最优模型无影响,均为BSM模型。但通过χ2适合性检验的次优模型受二者影响,以个体数量衡量(图2a),各海拔点的次优模型为ONM模型,在低海拔地区,NPM模型的拟合效果也较好。以生物量衡量(图2b),低海拔地区与高海拔地区的次优模型也为ONM模型,但中海拔地区的次优模型为NPM模型。各海拔段无论以何种指标表征多度,DPM和RAM未通过χ2适合性检验。
2.2 不同表居土壤动物功能群的生态位拟合模型
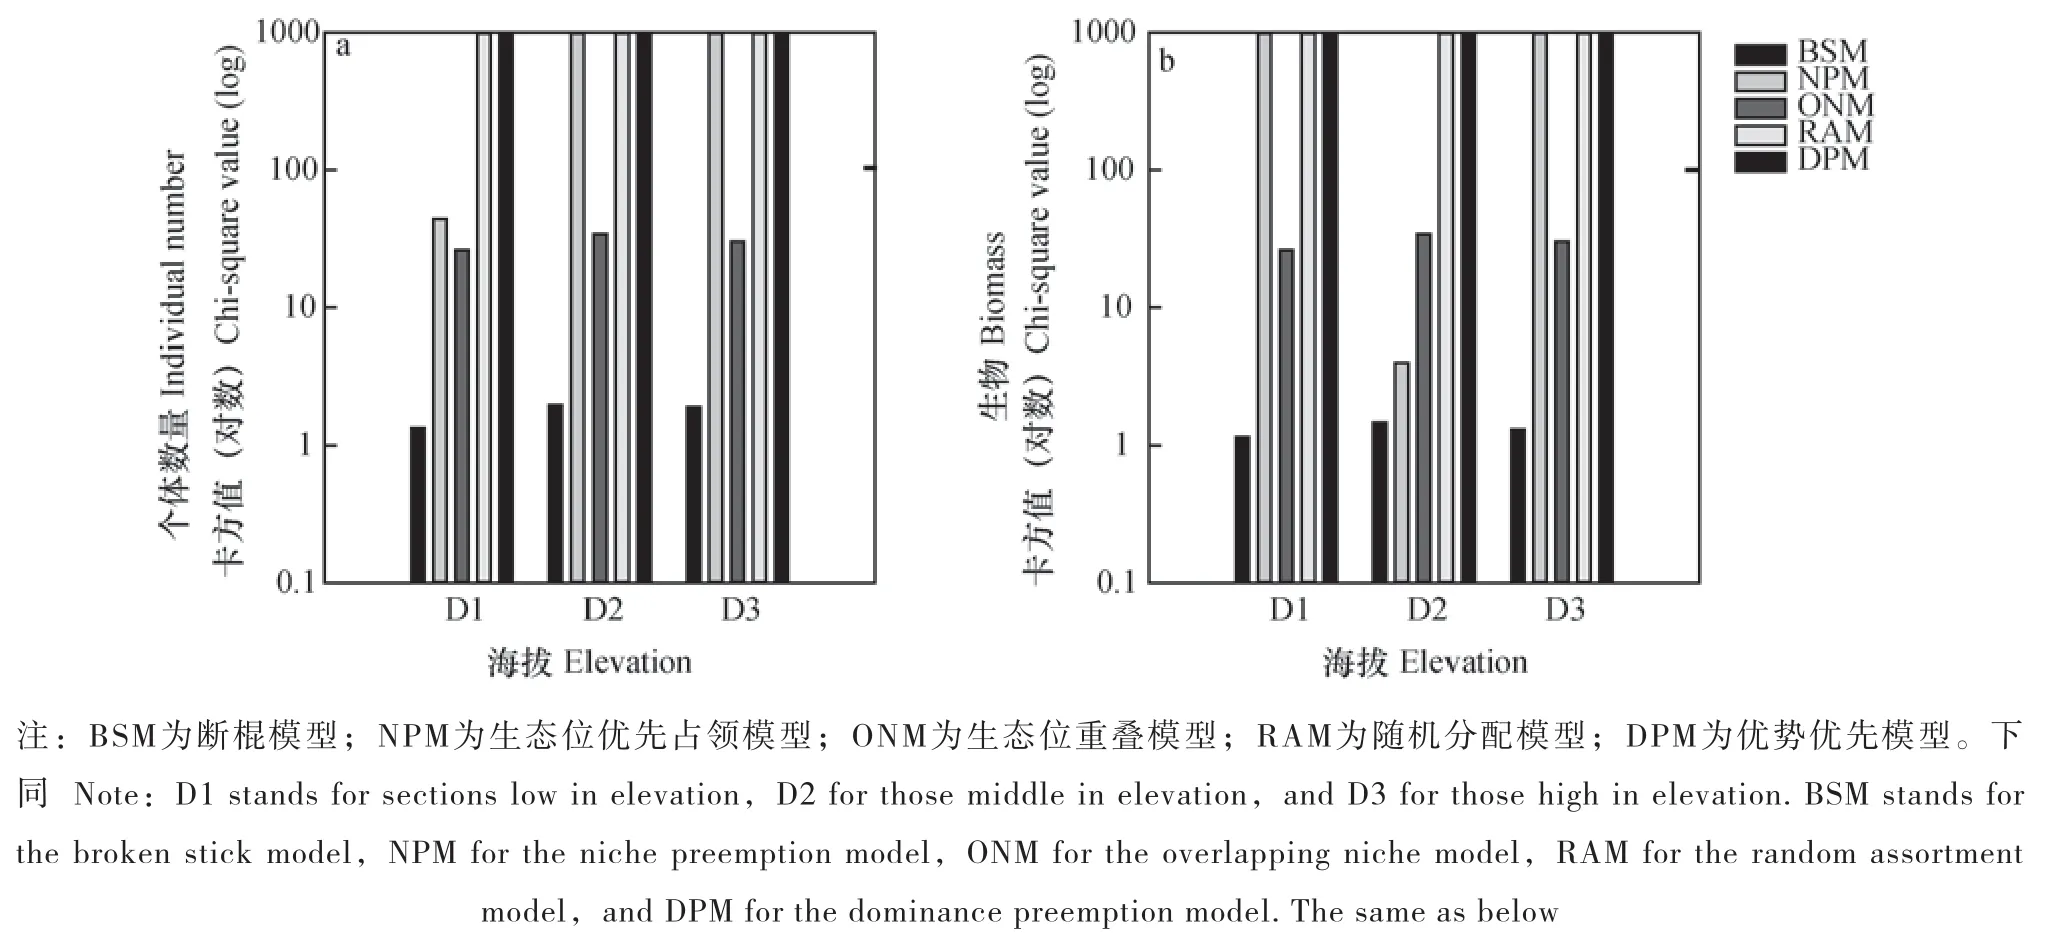
图2 沿海拔土壤动物群落生态位模型χ2适合性检验Fig. 2 Chi-square(χ2)fitting test on different niche models of soil fauna along elevation
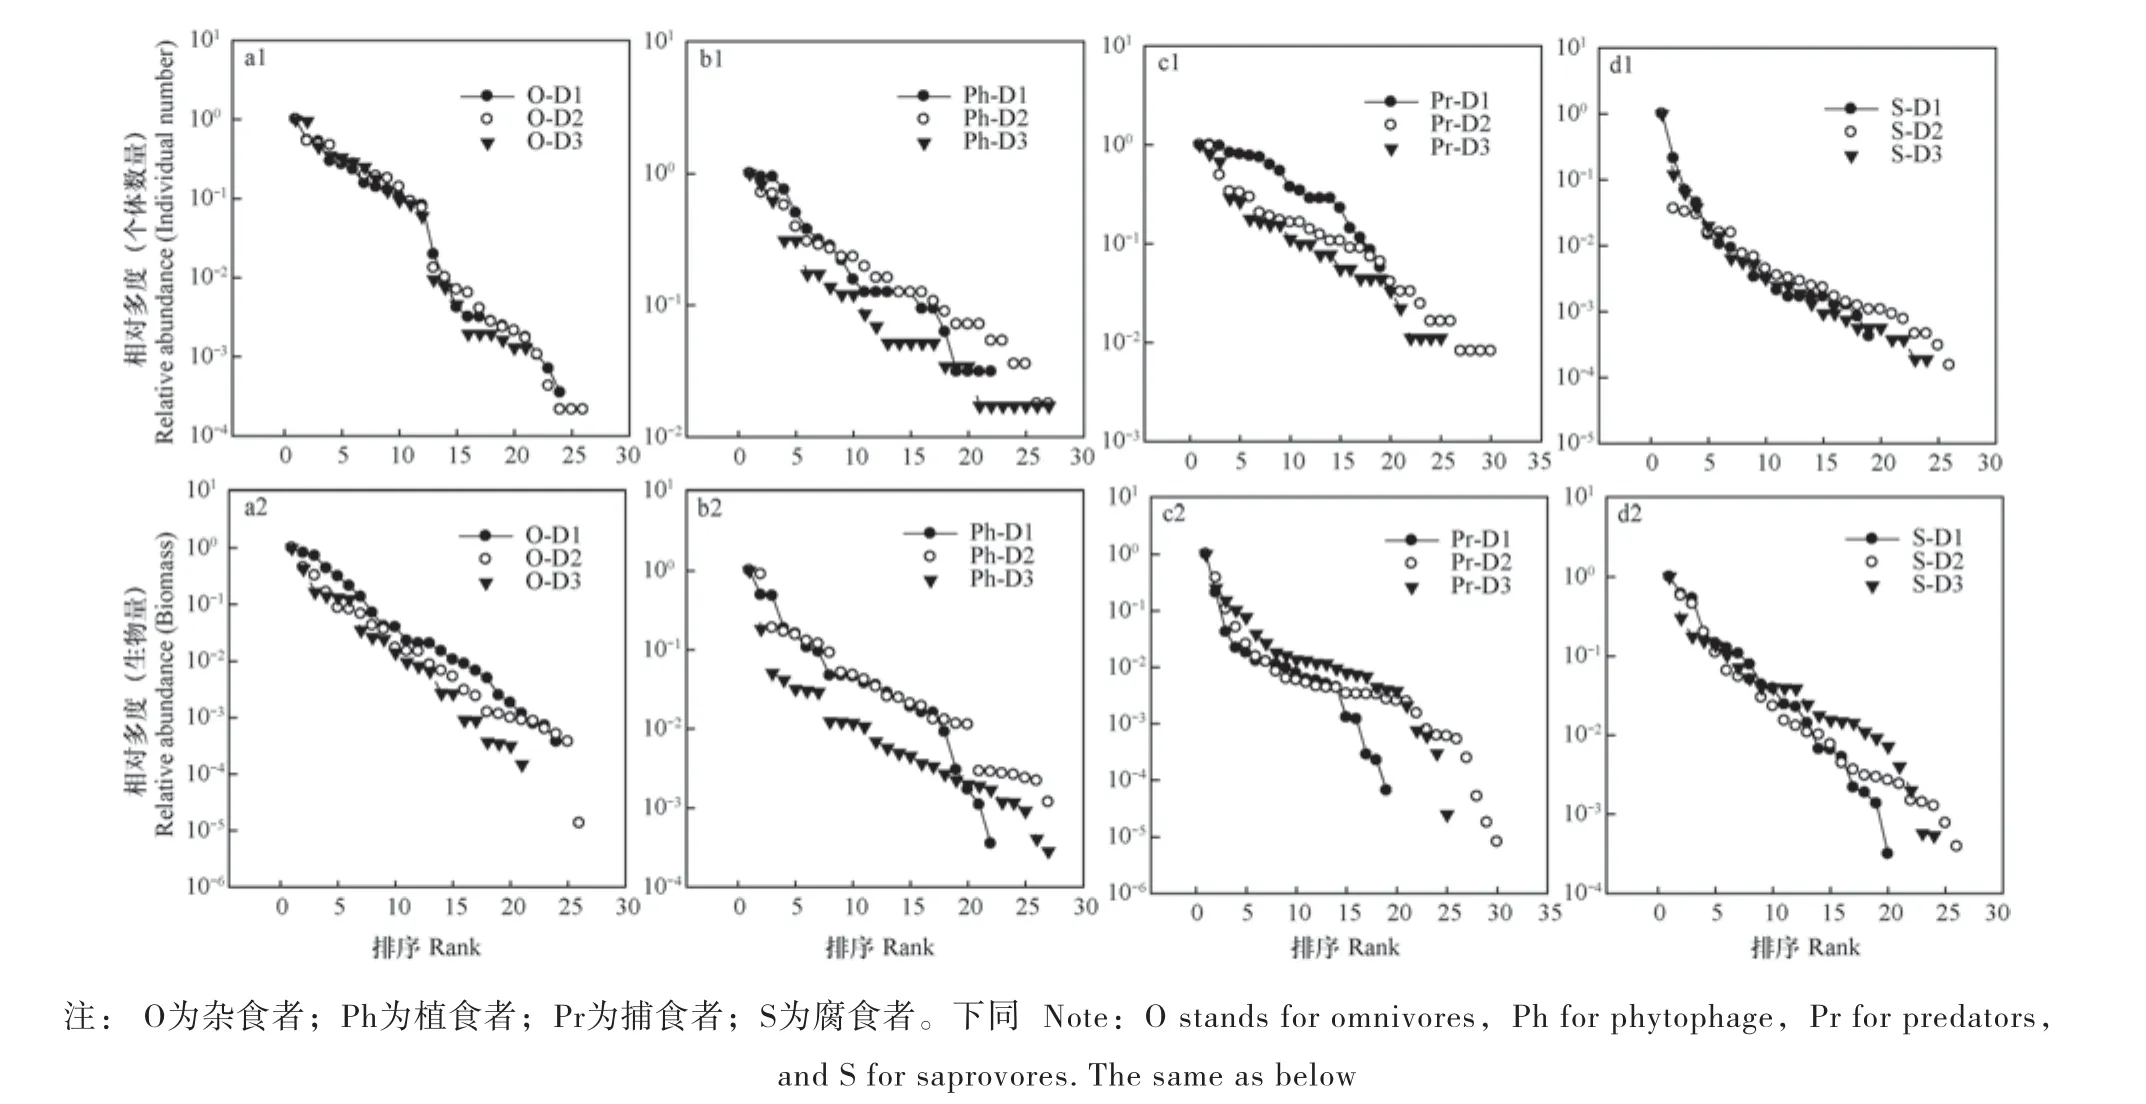
图3 不同功能群多度秩Fig. 3 Rank abundance of various feeding groups of the soil fauna
由个体数量表征的多度秩可以看出,对于植食者(图3b1)和捕食者(图3c1)而言,海拔越高,土壤动物群落越不均匀;杂食者(图3a1)和腐食者(图3d1)变化不大。而以生物量秩为表征的多度秩表明对于植食者(图3b2)而言,海拔越高,土壤动物群落越不均匀;而杂食者(图3a2)、捕食者(图3c2)和腐食者(图3d2)变化不大。
海拔对表居土壤动物各取食功能群的相对多度分布影响不同,随海拔升高,杂食者(图4a1,图4a2)最优模型由BSM转变为NPM;植食者(图4b1,图4b2)与其相反。多度表征指标影响拟合捕食者和腐食者相对多度分布的最优生态位分配模型,以个体数量为表征的相对多度分布拟合结果表明,捕食者(图4c1)随海拔升高最优模型由NPM转为NPM和BSM共优;腐食者(图4d1)群落在中海拔的最优模型为BSM,而在两端模型中以RAM最优。以生物量为表征的相对多度分布拟合结果表明,捕食者(图4c2)由RAM转变为BSM拟合最优;腐食者群落(图4d2)由NPM转变为BSM拟合最优。
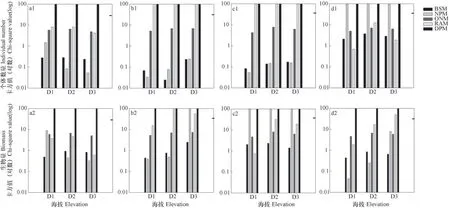
图4 沿海拔不同功能群土壤动物生态位模型适合性检验Fig. 4 Chi-square(χ2)fitting test on niche models of soil fauna in different feeding groups along elevation
无论以何种指标表征多度,DPM均未通过χ2适合性检验,适合拟合各功能群相对多度分布的生态位分配模型有差异。以个体数量衡量,海拔并未改变各功能群自身χ2适合度检验结果。以生物量衡量,杂食者和捕食者χ2适合性检验结果未受海拔影响,但植食者和腐食者通过χ2适合性检验结果受海拔影响。
3 讨 论
研究发现,海拔对于表居土壤动物群落整体相对多度分布无影响,但对不同功能类群相对多度分布有影响。拟合表居土壤动物群落整体的最优生态位模型均为BSM模型。一种可能原因是本研究选择的研究系统是同一林型,表居土壤动物群落的最终食物来源相同,导致其群落构建过程趋同。也可能由于土壤动物群落的营养级结构复杂[22],虽然各功能类群在海拔梯度上的构建过程不同,但将其作为总体分析,会偏向于反映某些优势功能群的构建过程。BSM适合描述竞争能力相近,相对均匀程度相近的群落[23],各海拔的土壤动物群落整体的均匀程度相差不大,是导致BSM模型拟合最优的原因。ONM模型尽管不是拟合的最优模型,但无论按何种多度指标拟合以及其后的分功能群分析中,均可通过模型的适合性检验,说明土壤动物群落的生态位重叠现象普遍,这与之前的研究结果土壤动物的高度杂食性,以及冗余种的存在等一致[24]。DPM均未通过模型适合度检验,这与同区域之前对于乔木层植物(优势植物均为辽东栎)的研究结果不同[19]。可能原因是优先占领模型适合描述高度不均匀、多样性低的群落[25],而绝对优势的物种占据绝大部分资源的群落构建模式与土壤动物群落不符。另外一个可能原因是相较于植物群落,土壤动物群落存在多种营养级,其高度的杂食性[22]以及同级捕食行为使得土壤动物种群互作更为复杂,因此在土壤动物群落构建过程中很难形成对于群落资源绝对主导的种群。考虑到同一功能群的物种在生态学上更为相似,更易产生生态位分化[21],因此分功能群检验土壤动物群落的生态位分配模型十分重要。与对整个群落的拟合结果不同,土壤动物群落不同功能群的构建策略随着海拔上升呈现出不同的变化。拟合杂食者群落的最优模型随海拔升高由BSM转变为NPM,说明在植物向顶级群落演替的过程中[19],杂食者群落内部逐步确立了相对优势的物种,群落向不均匀化发展。而植食者随海拔升高表现出相反的趋势,最优模型由NPM转变为BSM模型,可能是因为受植物群落演替的影响,食物资源变得丰富,因此直接取食植物的优势类群逐步减少,植食者功能群向均匀化发展。未来的研究中,有必要在更多典型的森林生态系统类型中验证海拔对于土壤动物群落构建过程的影响。
不同多度表征指标对于表居土壤动物群落总体多度分布的最优生态位分配模型拟合结果无影响,但对于不同功能类群相对多度分布有影响。无论以个体数量还是生物量表征多度,表居土壤动物总体生态位分配模型拟合结果均以BSM模型最优,但对于不同功能群而言,多度表征指标不同时筛选出的最优生态位分配模型不同。本研究中,捕食者群落的个体数量分布随着海拔升高由NPM转变为与BSM共优,而生物量分布则由RAM转变为BSM最优,可推知捕食者群落在低海拔地区的某些类群尽管占据个体数目的优势,但并未形成生物量上的优势。捕食者群落随植物演替由不均匀或是随机分布转变为相对均匀分布。以个体数量为衡量指标,腐食者群落只在中海拔地区产生了生态位分化(BSM模型最优),而在两极均为随机构建,其可能原因是捕食者群落在低海拔和高海拔并未发展到竞争互作的阶段;但以生物量为衡量指标,腐食者群落在各海拔梯度上均产生了生态位分化,随着地上群落的演替[19],腐食者群落由最初不均匀的群落向均匀化发展。综合考虑个体数量和生物量作为多度表征指标,有利于从不同侧面反映群落的构建过程。
基于生态位分化的群落构建理论在近年来受到现代物种共存理论以及中性理论的挑战[26]。现代物种共存理论认为物种在稳定或非稳定状态下共存,主要通过2种机制实现:(1)均等化,将物种间的平均适合度差异减至最小;(2)稳定化,通过增加种内负关系超过种间负关系实现物种共存[27]。基于稳定化机制,研究者们发展了多种假说,如资源比率假说、微生物介导假说、竞争—拓殖权衡等。除生境中的可利用资源外,环境因子等其他因素也影响群落构建,如:(1)时间变化,即时间生态位的分化;(2)空间变化,当空间本身被看作一种资源时,物种对空间的利用存在权衡;(3)干扰和环境波动,通过阻碍竞争促进物种共存;(4)环境及以上各因素之间的交互作用使得多物种共存[26]。均等化机制通过降低稳定化导致的较大种间适合度差异有利于群落物种实现稳定共存,但只考虑均等化机制的模型尝试会导致群落的不稳定共存,如中性理论。中性理论假设“物种在生态功能上完全等价”,认为随机过程和扩散机制对于群落构建起决定性作用[28]。虽然土壤动物群落总体检验时,RAM未通过适合度检验,但分功能群(尤其是以生物量为衡量指标)进行检验时,RAM可以通过多数功能类群的模型适合度检验,说明了中性过程(随机分配)在土壤动物功能群内部构建过程中可能发挥重要作用。未来,在土壤动物群落构建理论的验证中,应整合现代物种共存理论以及中性理论,整体检验稳定化机制和均等化机制在群落构建过程中的相对重要性。
4 结 论
本研究发现,海拔和多度指标选择并未影响表居土壤动物整体的群落构建过程,但影响表居土壤动物的不同取食功能群的多度分布。表居土壤动物群落整体的最优生态位分配模型均为断棍模型(BSM)。土壤动物各功能群受海拔的影响不同,杂食者随海拔升高,最优模型由断棍模型(BSM)转变为生态位优先占领模型(NPM),而植食者与之相反。需要特别指出的是,拟合物种相对多度分布的生态位分配模型,本质上是从格局推导过程,是由后向前推绎的。理论分布的适合度检验作为检验模型有效性的第一步是有帮助的,但是通常不是群落构建过程充分必要条件。未来的研究需要结合谱系距离、生活史特性与功能特征,整合更多的土壤动物类群(如湿生以及土居土壤动物群落),更深层次地理解物种的共存机制以及群落构建的功能过程。
[1]MacArthur R H. On the relative abundance of bird species. Proceedings of the National Academy of Sciences of the United States of America,1957,43 (3):293—295
[2]Sugihara G. Minimal community structure:An explanation of species abundance patterns. The American Naturalist,1980,116(6):770—787
[3]Tokeshi M. Power fraction:A new explanation of relative abundance patterns in species-rich assemblages. Oikos,1996,75(3):543—550
[4]Handa I T,Aerts R,Berendse F,et al. Consequences of biodiversity loss for litter decomposition acrossbiomes. Nature,2014,509(7499):218—221
[5]Bender S F,Wagg C,van der Heijden M G. An underground revolution:Biodiversity and soil ecological engineering for agricultural sustainability. Trends in Ecology & Evolution,2016,31(6):DOI:10.1016/ j.tree.2016.02.016
[6]Eldridge D J,Bowker M A,Maestre F T,et al. Interactive effects of three ecosystem engineers on infiltration in a semi-arid mediterranean grassland. Ecosystems,2010,13(4):499—510
[7]董炜华,李晓强,宋扬. 土壤动物在土壤有机质形成中的作用. 土壤,2016,48(2):211—218
Dong W H,Li X Q,Song Y. Role of soil fauna on soil organic matter formation(In Chinese). Soils,2016,48(2):211—218
[8]Bardgett R D,van der Putten W H. Belowground biodiversity and ecosystem functioning. Nature,2014,515(7528):505—511
[9]任圆圆,张学雷. 土壤多样性研究趋势与未来挑战. 土壤学报,2015,52(1):9—18
Ren Y Y,Zhang X L. Study on pedodiversity:Status quo and future challenges(In Chinese). Acta Pedologica Sinica,2015,52(1):9—18
[10]Garcia-Palacios P,Maestre F T,Kattge J,et al. Climate and litter quality differently modulate the effects of soil fauna on litter decomposition across biomes. Ecology Letters,2013,16(8):1045—1053
[11]Higgins C L,Strauss R E. Modeling stream fish assemblages with niche apportionment models:Patterns,processes,and scale dependence. Transactions of the American Fisheries Society,2008,137(3):696—706
[12]朱新玉,王玉玲,高宝嘉,等. 森林-草原交错带土壤节肢动物物种相对多度模型拟合研究. 干旱区资源与环境,2012,26(6):79—84
Zhu X Y,Wang Y L,Gao B J,et al. Application of various models to the study on relative abundance of soil arthro- pod animal species in the ecotone of foreststeppe region(In Chinese). Journal of Arid Land Resources and Environment,2012,26(6):79—84
[13]邱丽丽,殷秀琴. 左家自然保护区坡地土壤动物物种-多度分布格局研究. 土壤学报,2006,43(4):629—634
Qiu L L,Yin X Q. Soil fauna abundance pattern in a sloping field of Zuojia Nature Reserve,Jilin Province,China.(In Chinese)Acta Pedologica Sinica,2006,43(4):629—634
[14]Sundqvist M K,Sanders N J,Wardle D A. Community and ecosystem responses to elevational gradients: Processes,mechanisms,and insights for global change. Annual Review of Ecology,Evolution,and Systematics,2013,44(1):261—280
[15]Taper M L,Marquet P A. How do species really divide resources? The American Naturalist,1996,147 (6):1072—1086
[16]张育新,马克明,祁建,等. 北京东灵山海拔梯度上辽东栎种群结构和空间分布. 生态学报,2009,29 (6):2789—2796
Zhang Y X,Ma K M,Qi J,et al. Size structure and spatial pattern of Quercus liaotungensis population along elevation gradient in Dongling Mountain,Beijing (In Chinese). Acta Ecologica Sinica,2009,29 (6):2789—2796
[17]Xu G,Zhang S,Lin Y,et al. Context dependency of the density-body mass relationship in litter invertebrates along an elevational gradient. Soil Biology & Biochemistry,2015,88:323—332
[18]R Development Core Team. R:A language and environment for statistical computing. R Foundation for Statistical Computing,Vienna,Austria,2014:URL http://www.R-project.org/
[19]冯云,马克明,张育新,等. 北京东灵山辽东栎(Quercus liaotungensis)林沿海拔梯度的物种多度分布. 生态学报,2007,27(11):4743—4750
Feng Y,Ma K M,Zhang Y X,et al. Species abundance distribution of Quercus liaotungensis forest along altitudinal gradient in Dongling Mountain,Beijing(In Chinese). Acta Ecologica Sinica,2007,27(11):4743—4750
[20]冯云,马克明,张育新,等. 坡位对北京东灵山辽东栎林物种多度分布的影响. 生态学杂志,2011,30 (10):2137—2144
Feng Y,Ma K M,Zhang Y X,et al. Effects of slope position on species abundance distribution of Quercus wutaishanica community in Dongling Mountain of Beijing(In Chinese). Chinese Journal of Ecology,2011,30(10):2137—2144
[21]Ferreira F. Comments about some species abundance patterns:Classic,neutral,and niche partitioning models. Brazilian Journal of Biology,2008,68(4):1003—1012
[22]Brose U,Scheu S. Into darkness:Unravelling the structure of soil food webs. Oikos,2014,123(10):1153—1156
[23]King C E. Relative abundance of species and macarthur’s model. Ecology,1964,45(4):716—727
[24]Digel C,Curtsdotter A,Riede J,et al. Unravellingthe complex structure of forest soil food webs:Higher omnivory and more trophic levels. Oikos,2014,123 (10):1157—1172
[25]He F,Tang D. Estimating the niche preemption parameter of the geometric series. Acta Oecologica,2008,33(1):105—107
[26]牛克昌,刘怿宁,沈泽昊,等. 群落构建的中性理论和生态位理论. 生物多样性,2009,17(6):579—593
Niu K C,Liu Y N,Shen Z H,et al. Community assembly:The relative importance of neutral theory and niche theory(In Chinese). Biodiversity Science,2009,17(6):579—593
[27]Chesson P. Mechanisms of maintenance of species diversity. Annual Review of Ecology and Systematics,2000,31:343—366
[28]Hubbell S P. The unified neutral theory of biodiversity and biogeography. Princeton:Princeton University Press,2001
Effect of Elevation on Abundance Distribution of Different Feeding Groups in Litter-dwelling Soil Fauna
XU Guorui1,2ZHANG Yuxin1ZHANG Shuang1MA Keming1†
(1 State Key Laboratory of Urban and Regional Ecology,Research Center for Eco-Environmental Sciences,Chinese Academy of Sciences,Beijing 100085,China)
(2 University of Chinese Academy of Sciences,Beijing 100049,China)
【Objective】Species abundance distribution is a classic cutting-edge research field in the study on community ecology. Niche apportionment models are commonly used to simulate relative abundance distribution of species,but quite rarely applied to the study of soil fauna. Moreover,little has been reported in the past on how soil fauna responds to environmental changes in community construction relative to feeding guild. A field investigation was carried out of relative species abundance(individuals and biomass)distribution of the litter-dwelling fauna as a whole as well as each feeding guild(including omnivores,phytophage,predators,and saprovores)in a Quercus wutaishansea forest with an elevational gradient in the Dongling Mountain,Beijing. 【Method】Five commonly used niche apportionment models,that is the broken stick model(BSM),niche preemption model(NPM),niche overlapping model(ONM),random assortment model(RAM),and dominance preemption model(DPM),were used separately to simulate abundance distribution of the fauna. Adequacy of sampling is the prerequisite for the models to simulate species relative abundance distribution and judged by species accumulation curves. Rank-abundance plots were used to show richness and evenness of the species contained in the litter-dwelling soil fauna and each feeding guild. 【Result】 Results show that sampling in this study was adequate for fitting of the soil fauna community and feeding guilds. The distribution of the soil fauna in individual number disagreed with that in biomass. The dominance preemption model was not fit for either the whole litter-dwelling fauna community or each feeding guild based on chi-square test. The broken stick model was the optimal one for fitting the whole litter-dwelling fauna community,free of any impact of changes in elevation. The overlapping model and the niche preemption model were also good enough in fitting. When individual number was used as the index for abundance,elevation did not affect much fitting of the models for each feeding guild of the litter-dwelling soil fauna according to the chi-square test,but the chi-square test did vary from guild to guild. For omnivores,only the dominance preemption model failed the chi-square test,but for phytophage and predators,the random assortment model and for saprovores,the niche preemption model did,too. When biomass was used as the index for abundance,elevation did not have any impact on the chi-square test of the models fitting omnivores and predators,but did on that of the dominance preemption model fitting omnivores,and of thedominance preemption model and the niche preemption model fitting predators. The chi-square test of the models fitting saprovores and phytophage varied with the elevation. For saprovores,the dominance preemption model was good in the section low or moderate in elevation,while in the seciton high in elevation,the dominance preemption model and the random assortment model were. For phytophage,the dominance preemption model was good in the section low in elevation,the dominance preemption model and the random assortment model were in the section moderate in elevation,but the dominance preemption model,the niche preemption model and the random assortment model all failed the chi-square test in the section high in elevation. Abundance distribution of the various feeding guilds of the fauna was very sensitive to changes in elevation. For omnivores,the optimal model changed from the niche preemption model to the broken stick model with rising elevation,while for phytophage,it did reversely. Fitting with individual number as the index of abundance indicates that the optimal model for predators changed from the niche preemption model to the broken stick model and the niche preemption with rising elevation. For saprovores,the optimal model was the random assortment model in the sections low and high in elevation,while it was the broken stick model in the section moderate in elevation. When biomass was used as the index of abundance,the broken stick model replaced the random assortment model as the optimal one for predators,and the niche preemption model for saprovores. The use of biomass was better than that of individual number as index for the models to fit abundances of various feeding guilds of soil fauna. 【Conclusion】To sum up,elevation and selection of index does not affect much the models in fitting abundance distribution of the soil fauna as a whole,but does in fitting abundance distribution of the various feeding groups of the soil fauna. Future studies should consider modern theory of species coexistence and the neutral theory to examine the relative importance of stabilizing mechanism and equalizing mechanism in community assembly.
Soil fauna community;Feeding habits;Niche apportionment models;Community assembly;Elevation
Q958.1
A
10.11766/trxb201603270047
(责任编辑:檀满枝)
* 国家自然科学基金项目(31470481)资助 Supported by the National Natural Science Foundation of China(No. 31470481)
† 通讯作者 Corresponding author,E-mail:mkm@rcees.ac.cn
徐国瑞(1986—),男,河北邢台人,博士研究生,主要从事土壤动物群落生态学研究。E-mail:grxu_st@ rcees.ac.cn & xuguorui@xtbg.ac.cn
2016-03-27;
2016-07-12;优先数字出版日期(www.cnki.net):2016-08-23
猜你喜欢
昆明医科大学学报(2022年2期)2022-03-29 00:51:58
散文诗(2021年22期)2022-01-12 06:14:04
食品安全导刊(2021年20期)2021-08-30 06:40:50
今日农业(2020年19期)2020-12-14 14:16:52
环球时报(2019-05-23)2019-05-23 06:17:36
少儿美术(快乐历史地理)(2018年7期)2018-11-16 05:31:12
中国科技信息(2015年2期)2015-11-16 08:18:32
水生生物学报(2015年1期)2015-02-28 16:01:05
河北遥感(2014年4期)2014-07-10 13:54:58
植物营养与肥料学报(2014年1期)2014-03-11 20:24:38
