Improvements of Vis-NIRS Model in The Prediction of Soil Organic Matter Content Using Wavelength Optimization
2016-12-15 05:04:59LINZhidanWANGYubingWANGRujingWANGLiusanLUCuipingZHANGZhengyongSONGLiangtuLIUYang
发光学报 2016年11期
LIN Zhi-dan, WANG Yu-bing, WANG Ru-jing, WANG Liu-san,LU Cui-ping, ZHANG Zheng-yong, SONG Liang-tu, LIU Yang
(1. Institute of Intelligent Machines, Chinese Academy of Sciences, Hefei 230031, China;2. Department of Automation, University of Science and Technology of China, Hefei 230026, China;3. Electronic Engineering Institute, Hefei 230037, China)
Improvements of Vis-NIRS Model in The Prediction of Soil Organic Matter Content Using Wavelength Optimization
LIN Zhi-dan1,2,3, WANG Yu-bing1*, WANG Ru-jing1*, WANG Liu-san1,LU Cui-ping1, ZHANG Zheng-yong1, SONG Liang-tu1, LIU Yang1
(1.InstituteofIntelligentMachines,ChineseAcademyofSciences,Hefei230031,China;2.DepartmentofAutomation,UniversityofScienceandTechnologyofChina,Hefei230026,China;3.ElectronicEngineeringInstitute,Hefei230037,China)
Visible-near infrared spectroscopy (Vis/NIRS) is proved to be an effective tool in the prediction of soil properties. Wavelength optimization plays an important role in the construction of Vis-NIRS prediction model. In this article, a total of 130 topsoil samples collected from Guoyang County, Anhui Province, China, were used to establish a Vis-NIRS model for the prediction of organic matter content (OMC) in line concretion black soils. Through comparison, the combined spectral pretreatments of smooth and multiplicative scatter correlation (MSC) were applied to minimize the irrelevant and useless information of the spectra and increase the correlation between spectra and the measured values, and subsequently, SPXY methods were used to select the representative training set. Successive projection algorithm (SPA) and genetic algorithm (GA) were then conducted for wavelength optimization. Finally, the principal component regression (PCR) model was constructed, in which the optimal number of principal components was determined using leave-one-out cross validation technique. Results show that: both SPA and GA can significantly reduce the wavelength and favorably increase the accuracy, especially, GA can greatly improve the prediction accuracy of soil OMC, withRcc, RMSEP and RPD up to 0.931 6, 0.214 2, 2.319 5, respectively. Conclusively, using appropriate wavelength optimization methods, not only the computational load can be significantly reduced but also the prediction precision can be improved.
visible-near infrared spectroscopy(Vis-NIRS); organic matter content (OMC); spectral pretreatments; sample selection; wavelength optimization
1 Introduction
The application of precision agriculture needs vast amounts of accurate, real-time and low-cost soil data over a large area, which sets high requirements for soil detection methods. The detection method should be more efficient in both detection time and cost. Visible and near infrared reflectance spectroscopy (Vis-NIRS) is a non-destructive, rapid and repeatable method that can serve as an effective substitute technology for traditional laboratory chemical detection methods[1-4]. When a sample is illuminated by light, certain bonds in the molecules vibrate with the varying electric field, which will absorb optical energy and cause less light to be reflected off the sample. Three of the most pronounced vibrations observable in near-infrared band are the groups involving C—H, N—H and O—H bonds, which thus makes it possible to measure soil properties such as moisture, organic C and N using Vis-NIRS technique[5-6]. Each soil property has distinct spectral fingerprints in Vis-NIR region. Owing to the significant developments in equipment, optical components, computer and chemometrics, Vis-NIRS now is extensively applied in many fields for qualitative and quantitative analyses[7].
Soil organic matter content (OMC) plays a major role in soil’s many chemical and physical processes and significantly affects the pattern of a soil reflectance spectrum. As to the prediction of OMC using Vis-NIRS technique, many researchers have conducted a great number of studies and achieved many favorable results. Based on the collected Vis-NIR data, Vasquesetal.[8-9], Mouazenetal.[10], Stevensetal.[11], and Rossel and Behrens[12]used different multivariate regression methods and systematically compared their capabilities in soil OMC contents. Principle component regression (PCR) is a common model in multiple linear regression. Changetal. evaluated the ability of near infrared spectroscopy to predict soil OMC with PCR, with the determination coefficient up to 0.87 and the residual prediction deviation (RPD) of 2.79[13]. Vasquesetal. identified the best combination to predict soil OMC with five multivariate techniques including PCR[8].Wangetal. analyzed the potential of Vis-NIRS to predict soil OMC using two spectrometers, and the results showed that both two spectrometers can achieve favorable results in the prediction of soil OMC[14]. All of those proved the feasibility of PCR-based NIRS model in the prediction of OMC. However, the noise and some irrelevant or collinear information concluded in Vis-NIRS can affect the accuracy of the PCR method, which should be eliminated with some measures before the establishment of model.
In this paper, PCR was used to relate the Vis/NIR spectra with soil OMC, while spectral pretreatments, sample selection and wavelength optimization were conducted for improving the prediction accuracy of the constructed model. By comparing the prediction results using different methods, the application of spectral pretreatment, sample selection and wavelength optimization on the improvement of soil OMC prediction capacities were evaluated.
2 Materials and Methods
2.1 Collection of Soil Samples
The experimental field in Tongfeng Seed Industry was selected in the present study, which is located in the Guoyang County, Bozhou City, Anhui Province, China (33°27′-33°47′N; 115°53′-116°33′E). The mean annual temperature is about 14.6 ℃, and the mean annual precipitation is about 830 mm. The overall flat fields in Guoyang County can be classified as the lime concretion black soil. As one type of ancient cultivated soils, lime concretion black soil presents a highly localized distribution in Huaibei Plain, China. According to China Soil Scientific Database (http://www.soil.csdb.cn/), it is composed of two layers from top to bottom, namely, black-soil layer and lime-concretion layer, respectively. Generally, the lime concretion black soils are abundant in K content but relatively poor in OM, N and P contents, which can also be reflected by the data in Tab.1[15-16].
A total of 130 topsoil samples were collected using S-type sampling. Soil samples were collected from the surface layer at the bottom of a 20 cm deep trench, with the use of a special soil sampler. Each sample was about 2 000 g and was placed into a tightly sealed plastic bag to avoid external contamination. After the rejection of weeds and small pieces of rocks, the soils were then naturally air-dried and sieved less than 2 mm[17]. The soil samples after preprocessing were divided into two portions by four-way division method: A and B. The samples in Group A were placed in properly closed bags and taken to the chemical laboratory for the analysis of OMC. The soil OMC was determined by the potassium dichromate volumetric method coupling with a watering heating technique[18]. The statistical data of measured results are listed in Tab.1. The samples in Group B were taken to spectral measurements, which are described in depth in the next section.
Tab.1 Statistical data of all samples measured results
2.2 Spectral Data Acquisition
The experimental instrument employed in the present work, was Vis/NIR soil sensor by Veris Technology Incorporation. As a tractor-mounted sensor that can collect real-time soil information, the spectrophotometers and the optical system of Veris Vis/NIR soil sensor were built into a shank, mounted on a toolbar and then pulled by a tractor during field investigations. In present work, the spectrophotometers (Ocean Optics USB4000 and Hamamatsu C9914GB) and the optical system (a tungsten halogen bulb and fibers) in Veris Soil Sensor were dismounted from the tractor-mounted mobile platform and performed measurements in laboratory. The total spectra range from 342 to 2 222 nm, which were automatically stitched by the software at the absorption terminal. All the data processing procedures in present work were compiled with Matlab. A total of 130 samples was adopted for measurements, which were put in a petri dish and the surface was smoothed beforehand. During the measurements, the sample surface was pressed against the sapphire window of Veris soil sensor. To make a tradeoff between the minimization of the measured errors and time consumptions, each sample was detected three times, which was rotated by 120° for the next scan. After each measurement, the collected three spectra was averaged. The averaged absorbance soil spectra was given in Fig.1, in which they-axis absorbance spectra (A) were converted from reflectance spectra (R) byA=log10(1/R) and thex-axis wavelength was reciprocal to wave number. It can be found that the first two large absorption peaks are located at around 1 420 and 1 930 nm, respectively, both of which are coincident with the characteristic absorption peaks of H2O[18].
Fig.1 Vis-NIR spectra of 130 samples measured by the Veris soil sensor
2.3 Spectral Pretreatments
The measured spectra were easily influenced by individual differences (the particle size of samples, the intensity of light, the condition of measurement,etc.), baseline variations and substantial noises. Therefore, the pretreatment should be applied to minimize the irrelevant and useless information of the spectra and increase the correlation between the spectra and the measured values. The frequently-adopted pretreatment methods include normalization, first and second derivatives, multiplicative scatter correlation (MSC), standard normal variate (SNV), detrending or any combination thereof[19-20]. In the present study, the pretreatment and the subsequent processing programs were compiled with MATLAB 2012b.
SNV and MSC transformations can remove the baseline drift from spectra caused by the scattering and the variation of particle sizes. To remove high frequency noise, Savitzky-Golay polynomial smoothing filter can digitally smooth a given spectrum by approximating it within a specified data window using a polynomial with a specified order. Accordingly, the data can be best matched in the window on a least-square basis. In the present work, the filter with a polynomial of order 3 and the window with the width of 7 data points were used[14]. By comparing the results using 17 different pretreatment methods, the best pretreatment method employed in present work was the combination of S-G filter for smoothing and MSC.
2.4 Sample Selection
The selection of a representative training set plays a determinative role in the construction of prediction models, since the models established with the representative-characteristics samples can lead to the acceleration of regressions, the improvement of the prediction accuracy and the reduction of storage space and costs. Moreover, the application range of the established models can be expanded by adding a small amount of representative samples, being beneficial to the update and improvement of the models.
Kennard-Stone (KS) method and the sample set partitioning based on jointx-ydistance (SPXY) method Kennard-Stone (K-S) algorithm aim at covering the multidimensional space in a uniform manner by maximizing the Euclidean distances between the instrumental response vectors (x) of the selected samples[21]. SPXY method extends the K-S algorithm by encompassing bothx- andy- differences in the calculation of inter-sample distances[22].
2.5 Wavelength Optimization
Wavelength optimization on the full spectrum with the aim of enhancing accuracy is still a challenging task, especially when the collected spectra display strong overlapping and imperceptible distinctive features. The spectra in Vis-NIR range are mainly composed of the overtones and combination bands of hydrogen groups, and the absorption peaks are of weak intensity, relatively low sensitivity, wide absorption band width, serious overlaps and multiple correlations in spectral information. If the full spectrum was involved in the model, it would not only increase the complexity of the model and calculation load, but also reduce the prediction accuracy of the model owing to the irrelevant variables and collinearity between variables.
Successive projections algorithm (SPA) selects the wavelengths according to the contribution value sequence of the test samples and looks for the original spectral data with minimum redundant information. Accordingly, the overlapping information can be avoided and the redundant information can be eliminated in the selected wavelength data. This method can greatly reduce the amount of calculation model and improve the stability and accuracy of the model[23].
Genetic algorithm (GA) is a kind of random search optimization algorithm by reference to the rule of biological evolution. Owing to the invisible parallelism, adaptive and global optimization ability, GA has become a common method for the optimization of wavelength in the construction of NIR prediction models. In combination with GA algorithm, the constructed NIR prediction models exhibit relatively high predictive abilities[24].
2.6 Calibration and Validation
Among the training set after selection with 130 samples, the calibration and validation sets were selected in the present work, with the aim of prediction an unknown sample scientifically and exactly. The selected 100 samples were divided as calibration data set, and the rest 30 samples were used as the validation set. In calibration stage, the spectra were compressed using principal components analysis (PCA), and the optimum number of principal components (PCs) was determined using leave-one-out cross validation (LOOCV) technique, in which each sample was omitted and predicted using the calibration model established by the remaining samples[25]. With the pre-processed spectra, the prediction residual error sum of squares (PRESS) in leave-one-out cross validation for different number of PCs and soil contents was calculated. A suitable number of PCs is an efficient way of taking full advantage of spectral information and noise-filtering, while some useless information, such as the measured errors, can be over-included for more number of PCs, also known as ‘over-fitting’. Subsequently, the models were constructed using PCR method, in which multiple linear regressions were performed using the obtained optimum numbers of PCs. In validation stage, the above-described calibration model developed from training set (100 samples) was used to predict the contents of soil samples in validation set (30 samples), and the predicted values were compared with measured values. The statistic parameters for evaluating the predictive capability of the models include correlation coefficient (Rcc), root means square error of prediction (RMSEP) and the ratio of standard deviation of the validation set to standard error of prediction (RPD)[26].
3 Results and Discussion
The spectra after the combined pretreatments of S-G filter for smoothing are displayed in Fig.2. One
can observe that, compared with the original spectra, the pretreated spectra can smooth the spectra, reduce the effect of noise and then enhance the spectral characteristics.
Fig.2 Vis-NIR spectra of 130 samples after the combined pretreatment of S-G filter for smoothing and MSC
After the pretreatments, SPXY and KS method were used for the selection of training set and PCR-based prediction models for OMC were then developed. Tab.2 and Fig.3 show the results of OMC prediction using different training set selection methods. It can be observed that, using random selection (RS), the prediction results are considerably poor; the prediction results using KS sample selection are much better than the results using RS, asRccincreases from 0.329 0 to 0.719 8, RMSEP decreases from 0.453 7 to 0.437 9, and RPD increases from 1.078 0 to 1.282 6. The prediction results using SPXY results are best, withRcc, RMSEP and RPD up to 0.829 8, 0.273 8, 1.721 6, respectively. As stated above, SPXY method selects the training set by calculating the inter-sample distances based on overall considerations of the NIR spectral and target variables, so the selected training set is more representative than that selected using KS method and the established model is best in prediction accuracy. Consequently, SPXY method was picked out for further in-depth discussions in calibration and validation.
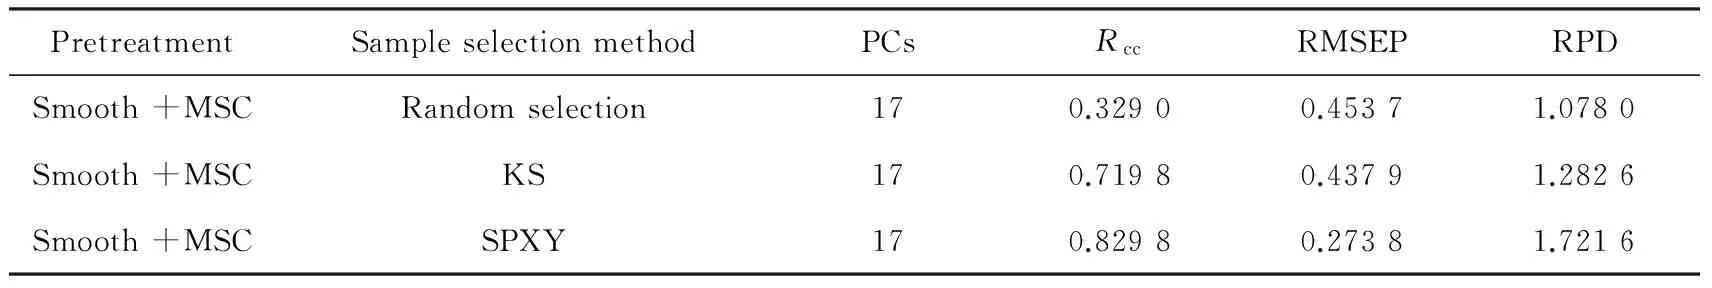
Tab.2 OMC prediction results of PCR models with smooth+MSC and different sample selection methods
Fig.3 Correlation between the predicted and the measured values of OMC with different sample selection methods. (a) RS. (b) KS. (c) SPXY.
Tab.3 lists the results of PCR models with the use of different wavelength optimization methods (as the modeling detains illustrated in Section 2.6), and Fig.4 shows the comparison between the predicted results and the measured values. As shown in Tab.3, SPA and GA can both increase the accuracy of PCR model and greatly decrease the predicting errors. Both two methods can contribute to the optimization of wavelengths so as to remove the effects of noise and enhance the predictive capability. This can be reflected by the increased correlation coefficientRccand RPD as well as the decreased RMSEP.
Fig.5 displays the characteristic wavelengths selected by SPA and GA, respectively. SPA and GA employ simple operations in a vector space to obtain the subsets of variables with small collinearity, which can effectively eliminate the redundant information of the wavelength variables and thus improve

Tab.3 Prediction results of PCR models with different wavelength optimization methods
Fig.4 Correlation between the predicted and the measured values of OMC with different wavelength selection methods. (a) NULL. (b) SPA. (c) GA.
the prediction precision. In the present study, using SPA method, the optimal wavelength combination was selected based on the calculated RMSEP.While using GA method, the number of iterations, the population size, the genetic probability and mutation probability were set as 250, 30, 0.7 and 0.3, respectively. Specifically, SPA requires a less computational work load than GA, however, GA-based prediction model has a better prediction precision. Since GA is an adaptive global search algorithm and takes the serial correlation characteristics of the spectral data into account in the optimization of wavelength, more useful spectral information was included while some irrelevant or nonlinear variables were rejected. Thus, the GA-PCR model is superior to SPA-PCR model in the prediction of soil OMC.
4 Conclusion
In order to establish an accurate and robust prediction model for soil OMC, different pretreatment methods, sample selection methods and wavelength optimization methods were applied in the process of Vis-NIRS model establishment. Results show that the combination of S-G filter for smooth and MSC can effectively eliminate the effects of noise and baseline drift better. Both KS and SPXY can select the representative samples, but SPXY method overall considers bothx-andy-differences in the calculation of inter-sample distances, and can select the more representative samples and gain more accurate results. SPA and GA can decrease the number of jointed wavelengths enormously, simplify the model and increase the accuracy remarkably. SPA requires a less computational work load but GA is preferable in prediction accuracy. In conclusion, after spectral processing and the selection of training set, the GA-PCR model can accurately predict soil OMC while occupies fewer computational resources. The proposed method,i.e., the adoption of wavelength optimization before regression, can provide a new thought for the practical application of Vis-NIRS in the prediction of soil properties.
[1] BEN-DOR E, BANIN A. Near infrared analysis as a rapid method to simultaneously evaluate several soil properties [J].SoilSci.Soc.Am.J., 1995, 59:364-372.
[2] REEVES J B, MCCARTY G W, Meisinger J J. Near infrared reflectance spectroscopy for the determination of biological activity in agricultural soils [J].JNIRS, 2000, 8(3):161-170.
[3] REEVES J B, MCCARTY G W, REEVES V B,etal.. Mid-versusnear-infrared diffuse reflectance spectroscopy for the quantitative analysis of organic matter in soils and other biological materials [J].AbstractofPapersofAmericanChemicalSociety, 2002, 223:U141-U142.
[4] DUNN B W, BEECHER H G, BATTEN G D,etal.. The potential of near-infrared reflectance spectroscopy for soil analysis—a case study from the Riverine Plain of south-eastern Australia [J].Aust.J.Exp.Agr., 2002, 42(5):607-614.
[5] SHEPHERD K D, WALSH M G. Development of reflectance spectral libraries for characterization of soil properties [J].SSSA, 2002, 66(3):988-998.
[6] ISLAM K, SINGH B, MCBRATNEY A B. Simultaneous estimation of various soil properties by ultra-violet, visible and near-infrared reflectance spectroscopy [J].Aust.J.SoilRes., 2003, 41:1101-1114.
[7] BEN-DOR E, IRONS J, EPEMA G F.SoilReflectance:RemoteSensingforTheEarthScience[M]. New York: John Wiley & Sons Inc., In: RENCZ A N. (Ed.), 3rd. Manual of Remote Sensing, 1999.
[8] VASQUES G M, GRUNWALD S, SICKMAN J O. Comparison of multivariate methods for inferential modeling of soil carbon using visible/near-infrared spectra [J].Geoderma, 2008, 146:14-25.
[9] VASQUES G M, GRUNWALD S, SICKMAN J O. Modeling of soil organic carbon fractions using visible?near-infrared spectroscopy [J].SoilSci.Soc.Am.J., 2009, 73:176-184.
[10] MOUAZEN A M, KUANG B, DE BAERDEMAEKER J,etal.. Comparison among principal component, partial least squares and back propagation neural network analyses for accuracy of measurement of selected soil properties with visible and near infrared spectroscopy [J].Geoderma, 2010, 158:23-31.
[11] STEVENS A, UDELHOVEN T, DENIS A,etal.. Measuring soil organic carbon in crop land satregional scale using airborne imaging spectroscopy [J].Geoderma, 2010, 158:32-45.
[12] VISCARRA ROSSEL R A, BEHRENS T. Using data mining to model and interpret soil diffuse reflectance spectra [J].Geoderma, 2010, 158:46-54.
[13] CHANG C W, DAVID A L, MAURICE J M,etal.. Near-infrared reflectance spectroscopy—principal components regression analyses of soil properties [J].SoilSci.Soc.Am.J., 2001, 65:480-490.
[14] WANG Y B, HUANG T Y, LIU J,etal.. Soil pH value, organic matter and macronutrients contents prediction using optical diffuse reflectance spectroscopy [J].Comput.Electron.Agr., 2015, 111:69-77.
[15] LIU L W. Formation and evolution of vertisols in the Huaibei Plain [J].Pedosphere, 1991, 1:3-15.
[16] 李录久,郭熙盛,王道中,等. 淮北平原砂姜黑土养分状况及其空间变异 [J]. 安徽农业科学, 2006, 34 (4):722-723. LI L J, GUO X S, WANG D Z,etal.. State and spatial variability of nutrient of lime concretion black soil in Huaibei Plain [J].J.AnhuiAgric.Sci., 2006,34 (4):722-723. (in Chinese)
[17] NATHAN M, GELDERMAN R.RecommendedChemicalSoilTestProceduresforTheNorthCentralRegion[M]. USA:North Central Regional Research Publication No. 221, 2012.
[18] 鲁如坤. 土壤农业的化学分析方法 [M]. 北京:中国农业科学出版社, 2000:106-107. LU R K.ChemicalAnalysisMethodofAgriculturalSoil[M]. Beijing: China Agricultural Science Press, 2000:106-107. (in Chinese)
[19] RINAN A, VAN DEN BERG F W J, ENGELSEN S B. Review of the most common preprocessing techniques for near-infrared spectra [J].TrendsAnal.Chem., 2009, 28(10):1201-1222.
[20] SAVITZKY A, GOLAY M J E. Smoothing and differentiation of data by simplified least squares procedures [J].Anal.Chem.,1964, 36(8):1627-1639.
[21] WU W, WALCZAK B, MASSART D L,etal.. Artificial neural networks in classification of NIR spectra data: design of training set [J].Chemometr.Intell.Lab.Syst., 1996, 33(1):35-46.
[23] 章海亮,刘雪梅,何勇. LS-SVM检测土壤有机质和速效钾研究 [J]. 光谱学与光谱分析, 2014, 34(5):1348-1351. ZHANG H L, LIU X M, HE Y. Measurement of soil organic matter and available K based on SPA-LS-SVM [J].Spectrosc.Spect.Anal., 2014, 34(5):1348-1351. (in Chinese)
[24] 陆婉珍. 现代近红外光谱分析技术 [M]. 北京:中国石化出版社, 2001:56-67. LU W Z.ModelNIRSpectroscopy[M]. Beijing, China Petro-chemical Press, 2001:56-67. (in Chinese)
[25] ABDI H, WILLIAMS L J. Principal component analysis [J].WileyInterdisciplinaryReviews:Comput.Stat., 2010, 2(4):433-459.
[26] MOUAZEN A M, BAERDEMAEKER J D, RAMON H. Effect of wavelength range on the measurement accuracy of some selected soil constituents using visual-near infrared spectroscopy [J].JNIRS, 2006, 14(1):189-199.
林志丹(1981-),男,山东栖霞人,博士研究生,讲师,2009年于合肥电子工程学院获得硕士学位,主要从事光谱分析与建模等方面的研究。
E-mail: linzd@mail.ustc.edu.cn王儒敬(1964-),男,安徽亳州人,博士,研究员,2004年于中科院合肥物质科学研究院获得博士学位,主要从事农业智能系统的理论、方法与技术的研究。
E-mail: rjwang@iim.ac.cn汪玉冰(1985-),女,安徽六安人,博士,副研究员,2010年于中科院合肥物质科学研究院获得博士学位,主要从事分子光谱分析及化学计量学在精准农业中的应用等方面的研究。
E-mail: ybwang@iim.ac.cn
2015-05-30;
2016-06-25
中科院科技服务网络计划(KFJ-EW-STS-069)资助项目
波长优选对土壤有机质含量可见光/近红外光谱模型的优化
林志丹1,2,3, 汪玉冰1*, 王儒敬1*,汪六三1, 鲁翠萍1, 张正勇1, 宋良图1, 刘 洋1
(1. 中国科学院 合肥智能机械研究所, 安徽 合肥 230031;2. 中国科技大学 自动化系, 安徽 合肥 230026; 3. 合肥电子工程学院, 安徽 合肥 230037)
可见光/近红外光谱模型是土壤属性预测的有效工具。波长优选在光谱建模过程中起着重要作用。文中首先利用从安徽省涡阳县采集的130个砂姜黑土土壤样本获得可见光/近红外光谱,然后利用平滑与多重散射校正联合的光谱预处理方式消除光谱中的无关变量和冗余信息以提高模型预测结果的相关性,再利用SPXY方法挑选建模集样本,分别利用连续投影算法和遗传算法进行波长优选,最后利用留一法进行交互验证建立有机质含量的主成分回归模型。研究结果显示:连续投影算法和遗传算法都可以有效地减少参与建模的波长数并提高模型的准确度,尤其是遗传算法能够更好地提高土壤有机质含量预测精度,其相关系数、预测均方根误差和相对分析误差分别达到0.931 6,0.214 2和2.319 5。通过合适的特征波长选取,不仅计算量可以大大减少,预测精度也会有效提高。
可见光/近红外光谱; 有机质含量; 光谱预处理; 样本选择; 波长优化
1000-7032(2016)11-1428-08
O235 Document code: A
10.3788/fgxb20163711.1428
*CorrespondingAuthors,E-mail:ybwang@iim.ac.cn;rjwang@iim.ac.cn
猜你喜欢
特产研究(2022年6期)2023-01-17 05:06:16
疯狂英语·初中天地(2022年2期)2022-07-07 08:50:46
疯狂英语·初中版(2022年2期)2022-05-04 13:54:49
科技传播(2019年23期)2020-01-18 07:57:10
新农业(2018年3期)2018-07-08 13:26:56
实用口腔医学杂志(2017年6期)2017-09-19 02:51:28
发明与创新(2016年33期)2016-08-21 13:22:22
中国照明(2016年4期)2016-05-17 06:16:15
物理实验(2015年9期)2015-02-28 17:36:46
发明与创新(2015年25期)2015-02-27 10:39:15