Three-dimensional unstructured modelling of wave-induced circulation over a plane and irregular beach*
Qiu-shun WANG (汪求顺),Hai-gui KANG (康海贵),Ke WANG (王科)
1.Zhejiang Institute of Hydraulics and Estuary,Hangzhou 310020,China
2.State Key Laboratory of Coastal and Offshore Engineering,Dalian University of Technology,Dalian 116024,China,E-mail:wangqiushun57@163.com
3.State Key Laboratory of Structural Analysis for Industrial Equipment,Dalian University of Technology,Dalian 116024,China
Three-dimensional unstructured modelling of wave-induced circulation over a plane and irregular beach*
Qiu-shun WANG (汪求顺)1,2,Hai-gui KANG (康海贵)2,Ke WANG (王科)3
1.Zhejiang Institute of Hydraulics and Estuary,Hangzhou 310020,China
2.State Key Laboratory of Coastal and Offshore Engineering,Dalian University of Technology,Dalian 116024,China,E-mail:wangqiushun57@163.com
3.State Key Laboratory of Structural Analysis for Industrial Equipment,Dalian University of Technology,Dalian 116024,China
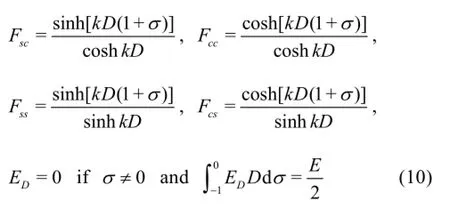
Nearshore currents have a complicated circulation structure over a beach due to the mutual interaction between waves and currents.To investigate the wave-induced circulation over a beach,a three-dimensional unstructured model accounting for the combined actions of waves and currents is established.The wave distribution over the beach is computed by a wave model and the depth-dependent wave radiation stresses with the surface roller are employed in the hydrodynamic model.The present model takes the mixing coefficients and the bottom shear stress under waves and currents into account.To evaluate the three-dimensional unstructured model,the laboratory experiments over a plane and irregular beach are used to test the performance of the model.The undertow over a plane beach is well reproduced and the vertical variability is captured.The performance of the model over an irregular beach is well displayed in the reproduction of pairs of counter-rotating primary circulations at the embayment troughs.Meanwhile,the secondary circulations are observed in the swash zone.The model captures the circulation systems over a beach and the circulation structures of the wave-induced currents are well exhibited.
unstructured model,wave-induced currents,depth-dependent wave stress,circulation structures
Introduction
The wave-induced current is commonly seen in the coastal zone where the mutual interaction between the waves and currents is involved.In the formation of the wave-induced current,the undertow and the rip current would occur as the waves propagate over a beach.The undertow is the pronounced bottom current and moves seaward in the lower half of the water column while the rip current is narrow and has the relatively depth-uniform profile with a high offshore velocity.Their respective horizontal extents are the most distinguished difference between the rip current andthe undertow.Due to the complicated flow pattern,there is a vertical circulation in the undertow and a horizontal circulation in the rip current.These circulations represent a mechanism for maintaining the mass balance and will affect the sediment transport in the nearshore zone.Consequently,the circulation structures of the wave-induced currents is an important issue for a beach.
In recent years,many laboratory experiments and numerical models were proposed for the study of wave-induced currents,especially the wave-induced rip currents[1-8].Haller et al.[5]measured the horizontal velocity distribution of the rip currents on a barred beach.Drønen et al.[2]conducted an experiment to investigate the vertical characteristics of the rip currents,but the measurement of the velocity was limited to the surf zone with the swash zone largely ignored.In the previous experiment over the irregular beach,it was noticed that there were the secondary circulations around the swash zone[1,4,5].But few numerical models can provide useful information about the secondarycirculation.As the mechanism of the wave-induced nearshore currents is in a three-dimensional pattern,it is important to investigate the circulation system by a three-dimensional model.
In the three-dimensional models,the depth-dependent wave stress concept was proposed by some authors.Xia et al.[9]deduced a vertical variation wave stress by invoking the small amplitude approximation and applied it to the wave-current model,but it generates a reverse undertow in the surf zone,which is not consistent with the experimental results.Xie[7]established a three-dimensional structured grid model to investigate the wave-induced rip currents based on the depth-dependent wave stress concept proposed by Zhang[10].With regards to the three-dimensional wave stresses,the formulation of Mellor[11]was widely used to study the wave-induced currents through various models[12,13].Sheng and Liu[12]assessed the performance of the Mellor approach under realistic conditions,which improved the results of wave-induced currents.Kumar et al.[14]presented an implementation of the Mellor formulation into the structured grid model,including the changes in the vertical distribution of the wave radiation stress.Although the structured grid models play a pioneering role in studying the wave-induced currents,the unstructured models have an advantage in the irregular zone[13,15].In view of the applications for the coastal waters,developing a three-dimensional unstructured model is desirable to study the wave-induced circulation over a beach.
This study aims to develop a three-dimensional wave-current model to resolve the circulation dynamics over a beach.Based on the three-dimensional circulation model finite volume coastal and ocean model(FVCOM),a wave-current model takes the mutual effect into account.
1.Model description
1.1 Hydrodynamic model
The three-dimensional equations involving the effect of waves are based on the circulation model FVCOM in the sigma(σ)coordinates[15],where the baroclinic terms are neglected and the horizontal diffusion terms are replaced with those in the present forms,and the wave radiation stress terms are added.The model is written as follows:

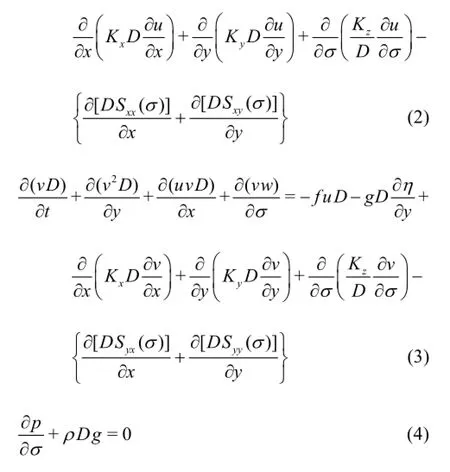
whereu,vand ware the velocities in thex,y and σ directions,respectively,the vertical coordinate σ ranges from σ=0at the free surface to σ=-1at the bottom,t is the time,η is the free surface elevation,D is the total water depth,f is the Coriolis parameter,p is the pressure,ρ is the water density,g is the gravitational acceleration,Kx,Ky,Kzare the mixing coefficients under waves and currents in the x,y and σ directions,respectively.In the present study,the mixing coefficients depend on the bed shear velocities under waves and currents,which are relevant to the wave-current bottom shear stress.Hence,the horizontal mixing coefficients[16]are adopted as follows

where αx=5.93,u∗is the bed frictional shear velocity due to the combined actions of waves and curre-is the bottom shear stress in the wave-current and is calculated according to a non-linear formula[17]as follows


where τcis the current bottom shear stress,τwis the wave bottom shear stress,τcx,τcyare the current bottom shear stress components in the x,ydirections,respectively,kis the Von Karman constant andk=0.4,z0is a bottom roughness parameter,z1is the elevation above the bottom,uc,vcare the current velocity components in thex,ydirections,respectively.It is assumed that the vertical mixing coefficientKzhas a parabolic-constant distribution[18]and is expressed as follows:
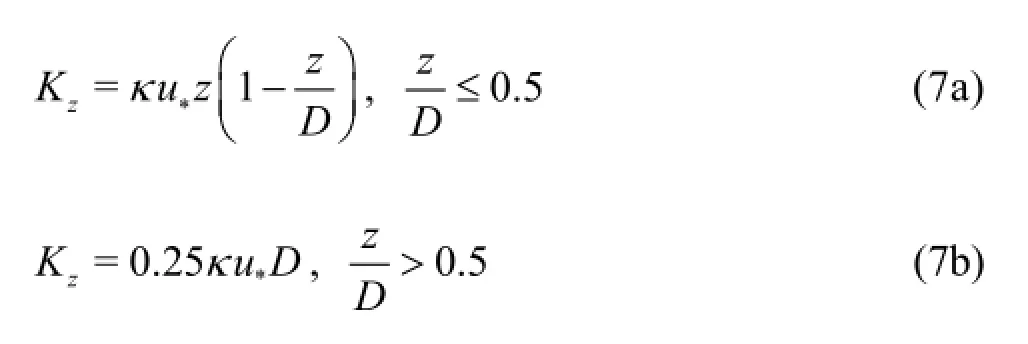
wherez is the position in the water depth direction.
Sxx,Sxy,Syx,Syyare the depth-dependent radiation stress tensor components,as expressed in Eq.(8),where the last terms are added due to the surface roller[19]and the rest terms are the momentum flux due to the non-breaking waves[11].
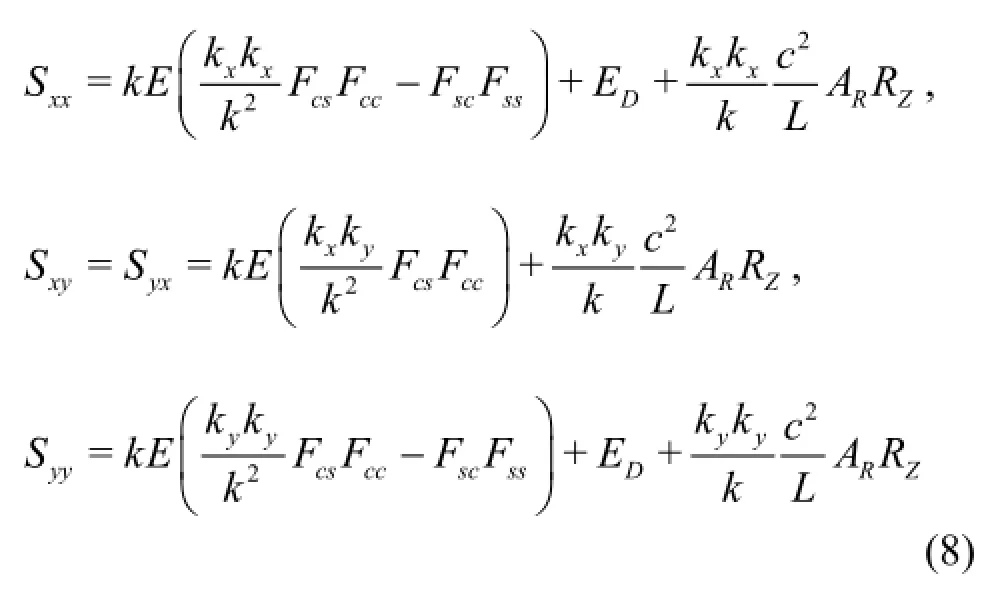
wherek is the wave number,kxand kyare the wave number components in the x and y directions,respectively,E is the wave energy,ARis the roller area computed by a formula of Svendsen[20],Fs c,Fcc,Fssand Fcsare the vertical structure functions,EDis the modified Dirac delta function.c is the wavepropagation speed,L is the wave length,the vertical distribution RZis an exponential function decaying with the depth so as to account for the depth-dependent radiation stress divergence associated with the surface roller,and it is derived from the expression[19]as follows:

Hsis the significant wave height.
1.2 Wave model
The wave propagating over the beach is computed by the wave model,i.e.the simulating waves in the nearshore (SWAN),which is based on the phaseaveraged equation including the source terms,to be solved to obtain the wave action density.The model represents the effects of the spatial propagation,the refraction,the shoaling and the wave breaking.More details may be found in Holthuijsen et al.[21].The mutual interaction between the waves and the currents is taken into account.As the currents reach a stable state after five minutes of simulation to avoid the start-up effects,the velocities in the x,y directions feed back to the wave model and the new wave parameters are computed,and then these parameters are employed by the hydrodynamic model in the next time step.The coupling time step is identical with the wave model time step of 2 s in the present study.
1.3 Boundary conditions
A monochromatic wave perpendicular to the direction of the beach is imposed at the offshore edge as the open boundary forcing for the wave model.The open boundary is provided by the incident wave height and wave period as the wave-maker boundary condition to compute the wave distribution,which will be employed by the hydrodynamic model.
The normal velocity along the shoreline boundary is zero.
At the free surface,i.e.,when σ=0,the velocity expressions are as follows:

At the bottom,i.e.,when σ=-1,the velocity expressions are as follows

where τcwx,τcwyare the bottom shear stresses under waves and currents in the x,ydirections,respectively.The bottom shear stress components are calculated by

2.Model verification and application
To evaluate the three-dimensional unstructured model,laboratory experiments over a plane and irregular beach are used to test the performance of the model.
In the present model,the Lagrangian velocity is adopted,while the measured velocities in the laboratory experiments are under the Eulerian frame.Therefore,in the simulated velocities,the Stokes drift is removed when compared to the experiment data.Besides,the root-mean squares error (RMS) and the correlation coefficient (CC) are applied to estimate the errors.The two parameters reflect the deviation and the linear correlation between the measured and simulated values,respectively.
2.1 The undertow over the plane beach
The laboratory experiment conducted by Ting and Kirby[22]provides comprehensive data of the undertow for the verification of the present model over the plane beach.The experiment flume is 40 m in length and 0.6 m in width.Waves are generated by a wave maker at a water depth of 0.4 m and a plane beach with 1:35 slope is located at the origin of the coordinate as shown in Fig.1.The incident wave height is 0.125 m and the wave period is 2.0 s.Several locations along the beach are arranged to measure the velocity profiles.

Fig.1 The sketch of the experiment flume
The numerical domain is discretized with a resolution of about 0.01 m in the horizontal domain and there are 20 sigma levels in the vertical profile.The time step in the hydrodynamic model is 0.002 s.
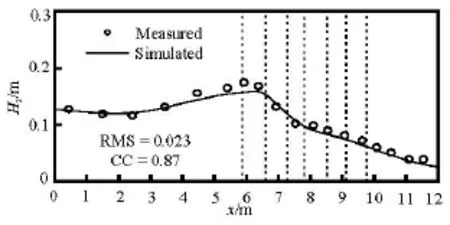
Fig.2 Comparison between the measured and simulated wave heights
The measured and simulated wave heights over the plane beach are shown in Fig.2,where the dotted lines are the locations of the measured velocities.The simulated results are present by line,and the measured data is represented by cricle.As the wave propagates on the beach,the wave height grows and reaches the highest at the location x=6.4 m.Due to the strong nonlinearity in the surf zone,the wave model could not describe the breakers precisely and underestimate the breaker height[13].The RMS is 0.023 m and the CC is 0.87 between the simulated and measured wave heights,as in a satisfactory agreement.
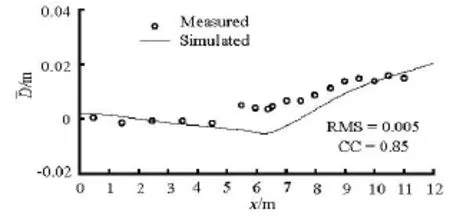
Fig.3 Comparison between the measured and simulated wave set-up and down
Figure 3 gives comparisons between the simulated and measured wave set-up and down.It is shown that the time-averaged water level decreases gradually when the wave height increases before breaking.The maximum set-down happens at the breaking point x=6.4 m.In the surf zone,the mean water level rises above the still water depth as the wave height diminishes towards the shoreline,and the maximum set-up occurs at the shoreline.As the level of the wave set-up and down is so small,the measurement of the water levels involves errors and the measured data are not perfect for showing the process of the wave set-down due to wave reflections in the laboratory flume,slight derivations are seen in Fig.3,where the RMS is
0.005 m between the simulated and measured water levels.However,the CC is 0.85 and it reflects a favorable linear correlation of the two datasets.
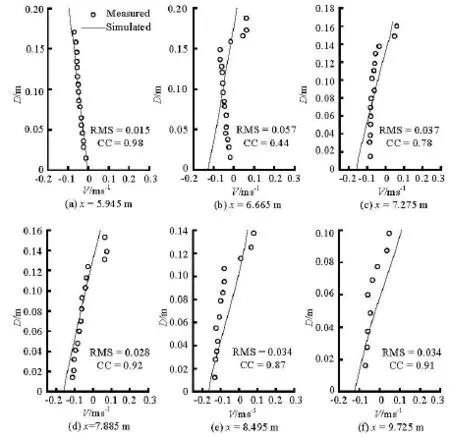
Fig.4 Comparison between the measured and simulated velocities
Figure 4 displays the comparison of the velocities at different locations over the plane beach.The RMS errors are in the range of 0.015 m/s-0.057 m/s,and the CC ranges from 0.44 to 0.98.The simulated profiles of the velocity roughly agree with the measured profiles in magnitudes.A large difference between the measured and simulated results is found near the wave breaking point,i.e.,x=6.665 m.It could be due to the fact that the wave model is linear and the formulation of the wave radiation stress is based on the linear wave theory whereas the wave nonlinearity plays an important role in the surf zone.The simulated velocities at other profiles have a satisfactory agreement with the measured data in both magnitudes and shapes.
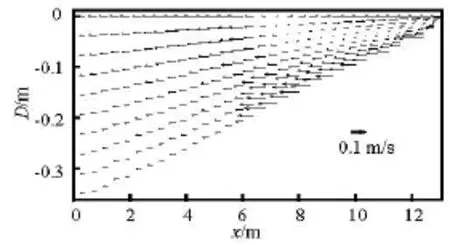
Fig.5 Cross-shore distribution of the velocity over the plane beach
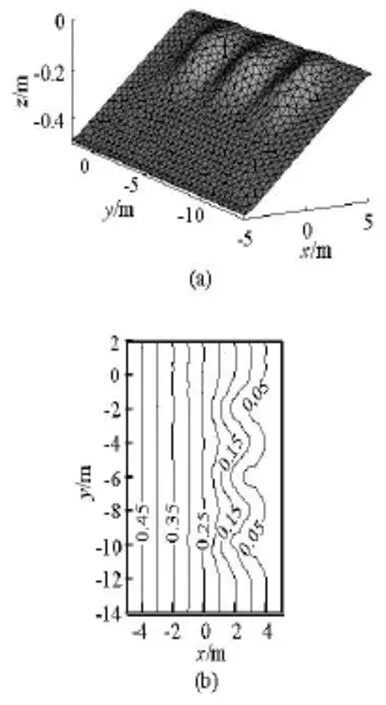
Fig.6 Unstructured mesh on the three-dimensional beach and the water depth contours (m)

Fig.7 Comparison between the measured and simulated velocities
The cross-shore distribution of the velocity over the plane beach is shown in Fig.5.Outside the surf zone,the Lagrangian mass transport is balanced by a return flow to maintain the mass conservation in the wave flume.The magnitude of this return flow decreases along the water depth and approaches zero near the bottom.Inside the surf zone,the velocity is onshore near the surface and offshore near the bottom.However,the magnitude of the return flow velocity in the surf zone increases with a pronounced seaward current near the bottom.The water carried shoreward by the breaking waves is returned by the undertow in the lower part of the water column.These results are consistent with previous studies based on the measurement of the water particle velocity.In general,it can be seen that the water flows shoreward near the surface and seaward near the bottom after the wave breaking and the undertow is well predicted in the surf zone.Besides,it is noted that the maximum return flow velocities occur in the lower part of the water column after the wave breaking,and the large return flow velocities are observed close to the water surface outside the surf zone.The flow that characterizes the undertow is reproduced over the plane beach and the vertical variation in the surf zone is also well captured by the model.It shows that the present model makes a good prediction of the undertow over the plane beach.
2.2 Rip currents over the irregular beach
The laboratory experiment of Borthwick and Foote[1]gives a test of the present model for the waveinduced rip currents over the irregular beach.The wave tank has a cross-shore width of 27 m and an alongshore length of 36 m,and the still water depth at the bottom is 0.5 m.The tri-cuspate beach is situated on a 1:20 plane beach,and the three cusps are located in the region of 0 m<x<5 mand -12 m<y<0 m.Figure 6 illustrates the unstructured mesh on the three-dimensional beach and the water depth contours of the tri-cuspate beach.The computational domain is 10 m in length and 16 m in width.In this study,the normal incident wave has the wave height of 0.125 m and the wave period of 1.2 s.
Several different grid resolutions (0.1 m,0.2 m and 0.5 m) in the horizontal domain are tested and 0.5 m is found to be the largest size without changing the basic results.The two vertical arrangements of 10 and 20 sigma layers are tested and the simulated results show no noticeable improvement for the arrangement of 20 sigma layers against that of 10 sigma layers.Therefore,the arrangement of 10 sigma layers is chosen for the vertical structure of the wave-induced rip currents.In order to reduce the instabilities of the generated rip currents,the models are run for 15 min and the simulated velocities are averaged over the last 4 min.
Figure 7 presents the comparison between the measured and simulated velocities.The RMS is within the range of 0.021 m/s-0.054 m/s,and the CC ranges from 0.35 to 0.81.The lowest CC is 0.35.The corre-lation between the two datasets seems weak.It might be due to the unstable nature of the rip currents,which makes the measured values scattered so that the depth-dependent variations are not smooth enough to exhibit the distribution characteristics clearly as compared to the simulated results[4,7].The comparisons show that the simulated velocity profile of the rip currents reflects the main distribution,which has a relatively uniform velocity in the water depth.
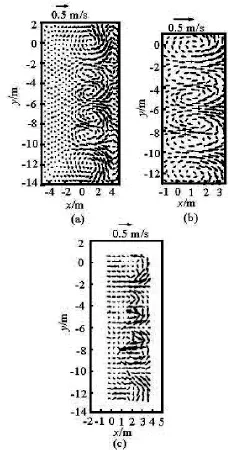
Fig.8 Distribution of the depth-averaged Lagrangian velocities
In the horizontal wave-induced current observations,the flow field is measured by the movement of neutrally-buoyant markers recorded by the video camera.The velocity vectors of the water particles are determined by the digital image analysis of the video film with the Lagrangian method.The spatial distribution of the velocity vectors corresponding to the depth-averaged particle currents proposed by Borthwick and Foote[1]is thus obtained.The Lagrangian flow field of the depth-averaged rip currents is illustrated in Fig.8,where it is compared to the experimental velocity from the digital image analysis.It is shown that there are pairs of counter-rotating circulations in each embayment and shoreward flows at the cusp horns.The shoreward flow fans out and divides,then feeds into the longshore currents that meet to form the rip currents at the embayment troughs.The rip currents are relatively narrow,and then flow offshore with a large velocity.The strong currents depart from the embayment troughs and reach the offshore zone,and then the flow patterns die away.Meanwhile,the secondary circulation is generated around the swash zone.The dye traces give the information of the secondary circulation in the shallowest waters where the current meter could not be utilized[1],but the present model captures the secondary circulation.The comparison shows that the distribution of the simulated primary circulation agrees well with the experimental results from the digital image analysis.
As the waves propagate towards the beach,the mean water level in the shoreline zone slightly increases.It provides a pressure gradient to drive a seaward flow.The offshore flow has various kinds of vertical structures,depending on the conditions of waves and beaches.When the waves propagate over the plane beach,the wave-induced currents are strongly concentrated near the seabed,in the form of the undertow.A vertical circulation is formed between the shoreward wave-induced mass drift and the seaward current.However,as the waves propagate over an irregular beach,the alongshore variation of the wave height will be seen and the water level displays also no alongshore uniformity.The mean water level is lower at the embayment troughs,which produces a longshore pressure gradient from the cusp horns to the embayment troughs.This pressure gradient drives the currents towards embayment troughs.As a result,the horizontal circulations will be formed with offshore currents concentrated at the embayment troughs and shoreward flows at the cusp horns.In addition,the pressure gradient near the shoreline drives the currents away from the embayment troughs,and the secondary circulation is generated.
3.Conclusion
In this study,we develop a three-dimensional wave-current model to investigate the wave-induced circulation over the plane and irregular beach.The model takes the wave-current interactions into account and the three-dimensional wave radiation stress concept with the surface roller is implemented for the wave-induced currents in the surf zone.The vertical variability over a plane beach is successfully simulated,accurate results of the wave set-up and down,the velocities at the profiles are obtained and the undertow is reproduced.Moreover,the model is applied to study the horizontal circulation over an irregular beach,where the vertical structure of the wave-induced rip currents is relatively uniform.The primary and secondary circulations are captured,as is consistent with the experimental results.The different circulation systems over the plane and irregular beach are clearly resolved by the present model.The circulation dynamics will provide useful hydrodynamic information for the sediment transport in coastal waters.
Acknowledgement
The authors would like to thank FVCOM developer for the open access of the source code.
[1]BORTHWICK A.,FOOTE Y.Wave-induced nearshore currents at a tri-cuspate beach in the UKCRF[C].Proceedings of the ICE -Water and Maritime Engineering.London,UK,2002,251-263.
[2]DRØNEN N.,KARUNARATHNA H.and FREDSOE J.et al.An experimental study of rip channel flow[J].Coastal Engineering,2002,45(3-4):223-238.
[3]FANG Ke-zhao,ZOU Zhi-li and LIU Zhong-bo.Numerical simulation of rip current generated on a barred beach[J].Chinese Journal of Hydrodynamics,2011,26(4):479-486(in Chinese).
[4]HAAS K.A.,SVENDSEN I.A.Laboratory measurements of the vertical structure of rip currents[J].Journal of Geophysical Research-Oceans,2002,107(C5):1-21.
[5]HALLER M.C.,DALRYMPLE R.A.and SVENDESEN I.A.Experimental study of nearshore dynamics on a barred beach with rip channels[J].Journal of Geophysical Research-Oceans,2002,107(C6):1-19.
[6]WANG Yan,ZOU Zhi-li.Experimental study of rip currents by intersecting wave on barred beach[J].Advances in Water Science,2015,26(1):123-129(in Chinese).
[7]XIE Ming-xiao.Three-dimensional numerical modelling of the wave-induced rip currents under irregular bathymetry[J].Journal of Hydrodynamics,2012,24(6):864-872.
[8]FANG Ke-zhao,YIN Ji-wei and ZOU Zhi-li.Experiment study on rip current of barred beach with a single channel[J].Chinese Journal of Hydrodynamics,2013,28(3):363-369(in Chinese).
[9]XIA H.Y.,XIA Z.W.and ZHU L.S.Vertical variation in radiation stress and wave-induced current[J].Coastal Engineering,2004,51(4):309-321.
[10]ZHANG D.Numerical simulation of large-scale wave and currents[D].Doctoral Thesis,Singapore:National University of Singapore,2004.
[11]MELLOR G.L.The depth-dependent current and wave interaction equations:A revision[J].Journal of Physical Oceanography,2008,38(11):2587-2596.
[12]SHENG Y.P.,LIU T.Y.Three-dimensional simulation of wave-induced circulation:Comparison of three radiation stress formulations[J].Journal of Geophysical Research-Oceans,2011,116(C5):1-17.
[13]WANG JIN-hua,SHEN Yong-ming.Development and validation of a three-dimensional,wave-current coupled model on unstructured meshes[J].Science China-Physics Mechanics and Astronomy,2011,54(1):42-58.
[14]KUMAR N.,VOULGARIS G.and WARNER J.C.Implementation and modification of a three-dimensional radiation stress formulation for surf zone and rip-current applications[J].Coastal Engineering,2011,58(12):1097-1117.
[15]CHEN C.S.,LIU H.D.and ROBERT C.B.An unstructured grid,finite-volume,three-dimensional,primitive equations ocean model:Application to coastal ocean and estuaries[J].Journal of Atmospheric Oceanic Technology,2003,20(1):159-186.
[16]PHAM T.N.,LARSON M.and HANSON H.et al.A numerical model of nearshore waves,currents,and sediment transport[J].Coastal Engineering.2009,56(11-12):1084-1096
[17]WANG Q.,KANG H.A three-dimensional modeling of the morphological change in the Liaodong Bay[J].Frontiers of Earth Science,2015,9(3):509-520.
[18]ZHANG Chi,WANG Yi-gang and ZHENG Jin-hai.Review of the vertical structure of wave-induced currents[J].Advances in Water Science,2009,20(5):739-746(in Chinese).
[19]WARNER J.C.,SHERWOOD C.R.and SIGNELL R.P.et al.Development of a three-dimensional,regional,coupled wave,current,and sediment-transport model[J].Computers and Geosciences,2008,34(10):1284-1306.
[20]SVENDSEN I.A.Wave heights and set-up in a surf zone[J].Coastal Engineering,1984,8(4):303-329.
[21]HOLTHUIJSEN L.H.,HERMAN A.and BOOIJ N.Phase-decoupled refraction-diffraction for spectral wave models[J].Coastal Engineering.2003,49(4):291-305.
[22]TING F.,KIRBY J.T.Observation of undertow and turbulence in a laboratory surf zone[J].Coastal Engineering,1994,24(1-2):51-80.
10.1016/S1001-6058(16)60623-6
(Received July 15,2014,Revised January 23,2015)
* Project supported by the National Key Basic Research Development Program of China (973 Program,Grant No.2013CB036101),the National Natural Science Foundation of China (Grant No.51379037).
Biography:Qiu-shun WANG (1984-),Male,Ph.D.,Engineer
2016,28(2):219-226
- 水动力学研究与进展 B辑的其它文章
- Manoeuvring prediction based on CFD generated derivatives*
- Effects of water flow on the uptake of phosphorus by sediments:An experimental investigation*
- Improved formulas for thermal behavior of oscillating nanobubbles*
- Lattice Boltzmann method for Casimir invariant of two-dimensional turbulence*
- The experiment and analysis of transitional flow in pipe*
- Numerical simulation of 3-D free surface flows by overlapping MPS*

