An axisymmetric model for draft tube flow at partial load*
Hosein FOROUTAN,Savas YAVUZKURT
Department of Mechanical and Nuclear Engineering,The Pennsylvania State University,University Park,PA 16802,USA,E-mail:foroutan.hosein@epa.gov
An axisymmetric model for draft tube flow at partial load*
Hosein FOROUTAN,Savas YAVUZKURT
Department of Mechanical and Nuclear Engineering,The Pennsylvania State University,University Park,PA 16802,USA,E-mail:foroutan.hosein@epa.gov
A new Reynolds-averaged Navier-Stokes (RANS) turbulence model is developed in order to correctly predict the mean flow field in a draft tube operating under partial load using 2-D axisymmetric simulations.It is shown that although 2-D axisymmetric simulations cannot model the 3-D unsteady features of the vortex rope,they can give the average location of the vortex rope in the draft tube.Nevertheless,RANS simulations underpredict the turbulent kinetic energy (TKE) production and diffusion near the center of the draft tube where the vortex rope forms,resulting in incorrect calculation of TKE profiles and,hence,poor prediction of the axial velocity.Based on this observation,a new k-εturbulence RANS model taking into account the extra production and diffusion of TKE due to coherent structures associated with the vortex rope formation is developed.The new model can successfully predict the mean flow velocity with significant improvements in comparison with the realizable k-εmodel.This is attributed to better prediction of TKE production and diffusion by the new model in the draft tube under partial load.Specifically,the new model calculates 31% more production and 46% more diffusion right at the shear layer when compared to the k-εmodel.
hydropower,draft tube,turbulence model,computational fluid dynamics,vortex rope
Introduction
Flow in the draft tube of a hydraulic turbine operating under off-design condition is very complex.The instability of the decelerated swirling flow in the draft tube may lead to efficiency reduction and severe pressure fluctuations.These pressure fluctuations become more dangerous if their corresponding frequency approaches the natural frequency of the power plant structures,leading to the vibration of the whole installation[1].In general,vibration and pounding noise,periodic variations in power output (power swing),vertical movement of the runner,and penstock vibrations are all attributed to the draft tube flow instabilities[2].
At partial load conditions,for which the flow rate is lower than the one at the best efficiency point(BEP),a helical precessing vortex called the vortex rope may develop in the draft tube with the frequencyof precession of about 0.2-0.4 of the runner's rotation frequency[1].Vortex rope is a complicated hydrodynamic phenomenon consisting of various length and time scales and,therefore,correctly predicting its behavior using numerical simulations is a challenging task.These simulations have been traditionally based on the Reynolds-averaged Navier-Stokes (RANS)equations together with two-equation turbulence models[3-6]due to ease of use and lower computational expenses.However,the application of the traditional,two-equation RANS turbulence models for the simulation of unsteady flows,such as those in the draft tube at partial load,is questionable.The conventional closure models have been derived for and calibrated by reference to simple,steady flows near walls and then used in unsteady free shear layer flows.Therefore,the likelihood of traditional closure models being an adequate framework decreases with increasing the complexity of the flow and the frequency of the coherent structures.As a result,more attention has been paid recently to the application of more complex models,such as large eddy simulation (LES) and hybrid RANS/LES models in draft tube flow simulations.The first attempt to numerically simulate the unsteady flow in a draft tube using LES was done bySkotak[7].In spite of a quite coarse grid,a vortex rope was simulated that agrees qualitatively with the rotating rope observed in experiment.Ruprecht et al.[8]developed an extended k-εmodel based on the very LES approach and applied it to the unsteady simulation of flow in a draft tube.They showed that unsteady features of the flow (e.g.,pressure amplitudes and vortex rope size) are better predicted with this model compared to using the standard k-εmodel in which the flow becomes stationary due to too much damping.The frequency of pressure fluctuations is well predicted in their simulations but amplitudes are underestimated.Various hybrid RANS/LES models have been used for unsteady swirling flow with vortex rope formation and breakdown and draft tube simulations including the detached eddy simulation (DES)[9,10],the filtered SST k-ωmodel[11],the scale-adaptive simulation (SAS)[12,13],and the partially-averaged Navier-Stokes model[14].Most of these models have shown relative improvement over the RANS models.
While agreeing with the fact that 3-D unsteady simulations using more sophisticated turbulence models are necessary in predicting the behavior of the vortex rope in a draft tube operating under partial load,it should be noted that such computations are expensive in terms of both time and computing resources.As a result,more computationally tractable techniques are required for performance evaluation and design optimization purposes.These techniques would be useful,for example,in optimization of the shape of the runner blades in order to reduce the stagnant region extent,thus mitigating the vortex rope.
One such method is to analyze the draft tube flow at partial load by using an axisymmetric swirling flow model and steady simulations[15].Obviously,the axisymmetric hypothesis is a major simplification having the main benefit of dramatically reducing the computational cost.On the other hand,it introduces important limitations as far as the three-dimensionality and unsteadiness are concerned.The inherent flow instability in the draft tube leads to a fully 3-D unsteady flow field with precessing vortex rope when the turbine is operated at partial discharge.As a result,the axisymmetry assumption is obviously violated.However,one can conjecture that an axisymmetric flow model can represent the circumferentially averaged 3-D unsteady flow.In other words,instead of circumferentially averaging the 3-D unsteady computational results one can perform averaging on the governing equations in cylindrical coordinates,thus solving a 2-D axisymmetric problem in a meridian half- plane[15,16].
Nevertheless,one important issue to be addressed is the effect of neglecting the actual precessing vortex rope when computing directly the circumferentially averaged flow.As shown in the previous studies[15,17-19],steady RANS turbulence models underpredict axial mean velocity and turbulent kinetic energy (TKE)near the center of the draft tube.This is attributed mainly to the incapability of these models in predicting the mixing in the shear layer associated with the vortex rope.This strong shear layer forms at the interface between a stagnant region at the center of the draft tube and the outer flow.The stagnant region can be understood as the extent of the wake of the crown cone which is the average of the highly fluctuating flow field where the vortex rope wraps around.Susan-Resiga et al.[15]introduced a stagnant region model(SRM) which essentially enforces a unidirectional circumferentially averaged flow,by switching the axial and radial velocity directions and letting the swirl velocity equal to zero,whenever a negative (i.e.,upstream oriented) axial velocity is detected.Although this model improved results in comparison to the original 2-D simulations,it seems to be nonphysical and yet shows considerable deviations from the experimental data.
In this research study,a new approach is considered,which is to develop a new RANS turbulence model in order to correctly predict the mean flow field in a draft tube operating under partial load using a 2-D axisymmetric model.For the development of the present model results of the previous numerical simulations by authors,i.e.,Refs.[14]and [19]are extensively used.
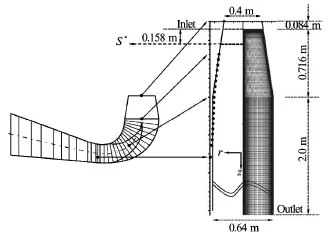
Fig.1 Simplified 2-D axisymmetric draft tube geometry

Table 1 Characteristics of investigated operating conditions
1.The simplified 2-D axisymmetric draft tube
A simplified draft tube generated based on the hydraulic diameter of the FLINDT draft tube[20]isconsidered in this study.In generating this test case,which has been used by Foroutan and Yavuzkurt[19],Rudolf and Štefan[21],and Susan-Resiga et al.[17],the effect of cross section increase is discriminated from the changes in cross section shape and bending the mean flow path.In doing so,one practically focuses on the decelerated swirling flow and vortex rope formation in the draft tube cone which is indeed axisymmetric and hence is represented exactly using this model.The resulting geometry consists of a straight diffuser with a total divergence angle of 17o(equal to the angle of the actual cone),followed by a long cylindrical section,as shown in Fig.1.

Table 2 Boundary conditions for axisymmetric simulations
Two partial load operating points corresponding to Case A and Case B in Table 1 are selected for simulations in this study.The points of interest are selected for the same head (energy) coefficient of ψ=2gH/(ω2R2)=1.18and different flow rate coefficients of j=Q/(πωR3)=0.34and 0.26 corresponding to about 91% and 70% of the flow rate at the BEP.In the definitions of head and flow rate coefficients,His the turbine head,Qis the turbine flow rate,ωis the runner angular velocity,and Ris the runner radius.
The computational setup including boundary conditions and computational grid is the same as in Foroutan and Yavuzkurt[19].Specifically,the computational grid consists of 120 000 quadrilateral structured grids,and is refined near the wall as well as near the center of the draft tube as shown in Fig.1.It is worth mentioning that the number of grids in the present 2-D axisymmetric simulation is at least one order of magnitude smaller than that required for an LES or DES simulation,resulting in considerably lower computational costs.Table 2 summarizes the boundary conditions used for the numerical simulations.The inlet profiles of axial and circumferential velocity and turbulent kinetic energy are obtained from experimental data,while a linear profile is used for the radial velocity component[17].The inlet profiles for the dissipation rate are computed from the turbulent kinetic energy profiles.Radial pressure equilibrium condition is used at outlet,and no-slip condition is applied at wall boundaries.The governing equations including continuity,momentum,and turbulence closure are numerically solved using finite volume method,where diffusion and advection terms are discretized using the second-order central-differencing scheme and the second-order upwind scheme,respectively.More details on the computational setup can be found in Ref.[19].
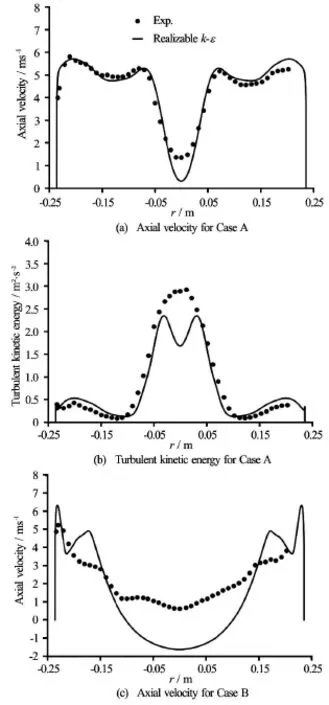
Fig.2 Profiles on Section S*(see Fig.1) of the simplified draft tube from numerical simulations of Foroutan and Yavuzkurt[19]
2.Investigations of RANS turbulence models
Steady RANS simulations of flow in the simplified draft tube performed by Foroutan and Yavuzkurt[19]showed underprediction of the axial velocity and turbulent kinetic energy near the center of the draft tube as shown in Fig.2.The deviation from the experimental data increases considerably,moving farther from the best efficiency condition (see Fig.2(c)).Since no considerable improvement in predictions was seen applying different turbulence models[19],the two equation k-εturbulence model with two-layer zonal model for near wall treatment is chosen for development of the axisymmetric model in this study.
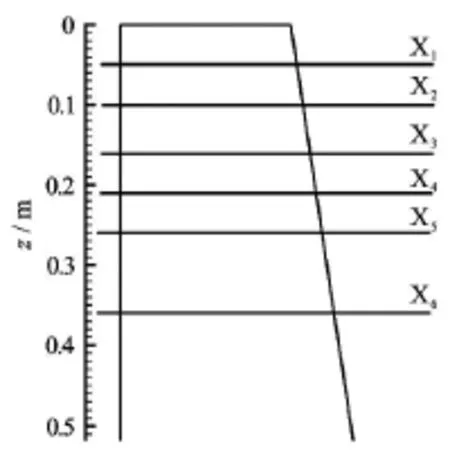
Fig.3 Investigated sections in the simplified draft tube
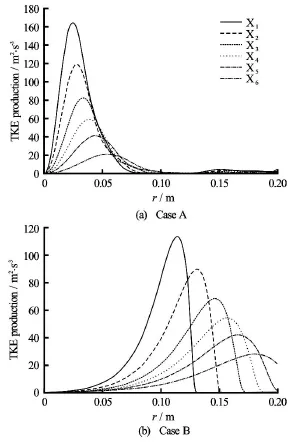
Fig.4 Radial distributions of the turbulent kinetic energy production at several stream wise sections in the simplified draft tube.Results are obtained using the k-εturbulence model
In order to further investigate the flow field inside the draft tube,six cross sections (X1to X6) are chosen as shown in Fig.3.The stream wise(z)value associated with these cross sections are given in Fig.3.Figure 4 shows the distributions of the turbulent kinetic energy production on these six sections.Production of TKE can be written as


Fig.5 Locations of the peaks in TKE production P in the simplified draft tube (also see Fig.4).A line can be fit through these points with very good precision
Results are shown for two partial load cases,i.e.,for Case A and Case B.Note that the near-wall region(r > 0.2 m) is not shown in Fig.4 in order to better present the results near the centerline (r = 0) .Nevertheless,one can infer that P has a considerable peak near the wall due to high velocity gradients resulting in high TKE generation.It can be seen that in both cases P has another peak near the center of the draft tube which moves farther from the centerline as the flow moves downstream.This maximum in TKE production shows the generation of TKE near the centerline which can be attributed to the formation of a strong shear layer between stagnant region and the outer flow.Therefore,the location of the peak in TKEproduction may provide information about the location of the shear layer,i.e.,the location of the boundary between stagnant region and outer flow.This is investigated in this study by locating the point of the maximum Pvalue for each section and by plotting the radial distance of these points from centerline,as shown in Fig.5.
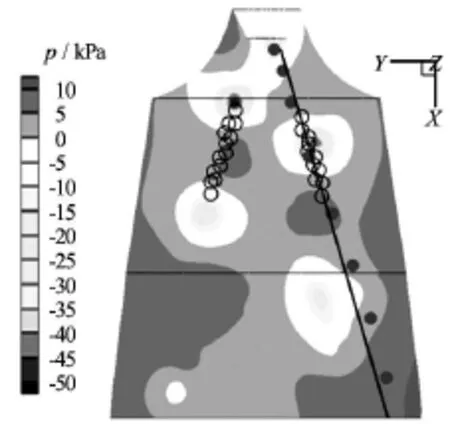
Fig.6 Locations of the vortex core in the draft tube,comparison between (o) PIV measurements of Ciocan and Iliescu[22],(·) 2-D axisymmetric (k -ε) predictions and a line fitted through them,and contours of the instantaneous pressure (Pa) field in the background obtained from 3-D unsteady simulations[14]
It is seen in Fig.5 that a line can be fit through these data with very good precision.This line represents the location of the maximum TKE production due to the formation of the shear layer in the draft tube.It was shown by Foroutan and Yavuzkurt[19]that the vortex rope is formed due to the rolling up of this shear layer and wraps around a stagnant region in the draft tube.Therefore,the average location of the shear layer shown by the line in Fig.5 represents the average location of the vortex core in the rope.This is validated by comparing with the experimental data of Ciocan and Iliescu[22]who used particle image velocimetry to investigate the flow field in the draft tube cone and to locate the vortex core.They showed that the vortex rope wraps around a conical surface,and found the angle of inclination of this cone to be 17o,twice the cone's inclination.The slope of the line fitted through maximumPpoints for Case B (see Fig.5(b)) is found to be16.5owhich is in very good agreement with measurements of Ciocan and Iliescu[22].This is better presented in Fig.6 where the line of maximum TKE production obtained from steady axi-symmetric simulations,PIV data of Ciocan and Iliescu[22],and 3-D unsteady simulation results of Foroutan and Yavuzkurt[14]are shown together.It can be seen that there is a very good agreement between all three methods in locating the vortex core.Therefore,it is concluded that the line of the maximum TKE production obtained from steady axisymmetric simulations represents the surface of the cone (in 3-D)where the vortex rope wraps around.
This is an important and original finding,since it shows that although 2-D axisymmetric simulations cannot model the vortex rope,they can give the average location of the boundary between the stagnant region and the outer swirling flow,i.e.,the average location of the vortex rope in the conical part of the draft tube.Nevertheless,the level of the TKE production may not be predicted correctly resulting in underprediction of TKE and axial velocity at the center of the draft tube as shown in Fig.2.This is investigated by comparing the production obtained by the axisymmetric k-εRANS simulations (Eq.(1)) with the one obtained by the 3-D unsteady DES simulations of Foroutan and Yavuzkurt[19].In the DES simulations,the production of TKE can be obtained by

which is due to the interaction between resolved-scale velocity gradientand subfilter Reynolds stresses
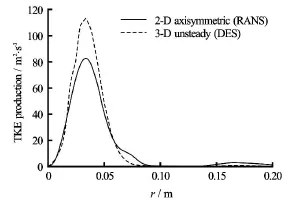
Fig.7 Radial distributions of the TKE production at Section X3in the draft tube,comparison between DES and RANS simulations
As depicted in Fig.7,the level of the TKE production is underpredicted by RANS simulations comparing to the DES results,while the location of the maximum TKE production is well captured which is consistent with the previous observation.Additionally,overprediction of the drop in TKE at the centerline(the difference between the level of TKE at the centerline and the peak associated with the shear layer)predicted by the RANS simulations (see Fig.2(b)) indicates that the level of TKE diffusion is not correctly predicted either.Therefore,a modified model should deal with correcting the level of TKE production and diffusion within the shear layer and stagnant region in the draft tube.
3.Model development
It was argued in the previous section that steady RANS models underpredict the turbulent kinetic energy production and diffusion in regions of the flow where the vortex rope forms.This is summarized graphically in Fig.8 where turbulent kinetic energy is plotted in the draft tube (same as Fig.2(b)).It should be noted that this conclusion holds for both 2-D axisymmetric and 3-D steady RANS simulations since no difference is seen between results of these simulations[19].Nevertheless,the focus of the present section is on 2-D axisymmetric modeling.
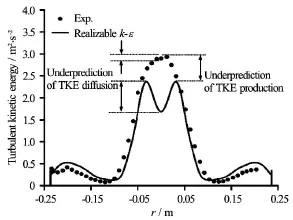
Fig.8 TKE distributions in the simplified draft tube.The deviation between RANS predictions and experimental data is attributed to the underprediction of the TKE production and diffusion
The goal of the present study is to take the effects of extra production and diffusion of TKE due to the vortex rope unsteadiness into account using a physical model.The extra production and diffusion can be physically understood as coherent or local turbulence production/diffusion as opposed to the mean production/diffusion.The Kelvin-Helmholtz instabilities associated with the formation of the vortex rope locally generate turbulence as shown experimentally in other flow problems including a strong shear layer[23-25].The shear layer instabilities yield a considerable kinetic energy transfer from the mean flow to the vortices in the region where the shear layer roll-up occurs.Scarano et al.[23]experimentally investigated the turbulent separated flow over a backward facing step and found a relationship between the coherent structures in the shear layer and the production of TKE.In their work,the dominant role of the coherent structures in the production of TKE is confirmed by the high values of coherent production compared with the corresponding mean production.Furthermore,they stated that regions with considerable TKE production correspond to the area where the occurrence of vortices is higher,which confirms the conclusion in the previous section.
Based on all these observations,a new steady RANS model for simulations of the mean flow field in the draft tube cone is developed by modification of the TKE transport equation as follows

where Pcand Dcare the coherent TKE production and diffusion due to the vortex rope respectively.Using the concept of the coherent eddy viscosityνc,these extra terms can be written as
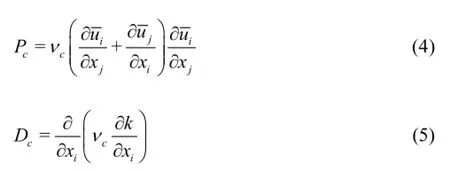
Therefore,Eq.(3) can be written as
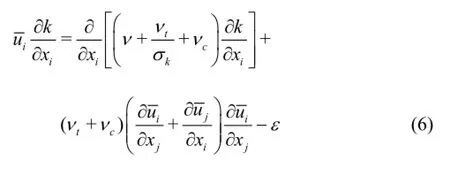
where the only unknown parameter is the coherent eddy viscosity νc.Considering the analogy with the eddy viscosity concept,this coherent eddy viscosity can be related to a length and a velocity scale as

where lcand Vcare the length and velocity scales of the unsteady coherent structures forming within the shear layer in the draft tube.Note that Eq.(7) makes sense on dimensional grounds.The velocity scaleVc,itself,can be written as

where Ωrepresents the angular velocity of fluid particles in the vortices,therefore,it is chosen to be the vorticity magnitude

where Ωijis the mean rate-of-rotation tensor.

Considering the simplest form,the coherent eddy viscosity can be written as

The closure problem still exists,but now it has changed to finding the length scale lc.The length scale of the coherent structures in the vortex rope is related to the thickness of the shear layer,and can be seen as the vortex rope diameter.However,no general definition was found for the vortex rope diameter in the literature.There are attempts to extract the rope diameter by image processing[26],but they are limited to the cavitating vortex rope (see Fig.9) using the volume of the vapor (which is a function of the cavitation number),and hence,cannot be used in general.
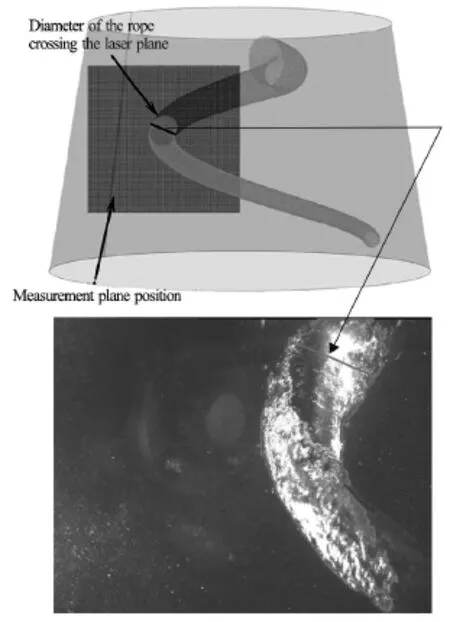
Fig.9 Extraction of the rope diameter by image processing in the PIV study of Iliescu et al.[26]
In this study,a new definition for the vortex rope diameter is presented.Further investigations of the unsteady 3-D simulations[14,19]revealed that the helicity has a local maximum at the vortex center,then drops,moving away from the vortex core.Helicity is a property of a moving fluid which represents the potential for helical flow.It provides insight into the vorticity aligned with the fluid stream.Mathematically,helicity for a fluid particle is defined by the dot product of the vorticity and the velocity vectors

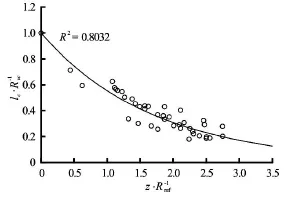
Fig.10 Vortex rope diameter lcnormalized by the vortex core location Rvcas a function of normalized (by the draft tube inlet radius Rref) streamwise distance from the draft tube inlet.An exponential line can be fit through these points with good precision (see Eq.(13))
With this observation,the diameter of the vortex rope is defined as the distance from the vortex core by which the helicity drops by 90%.This is a general definition valid for both cavitating and non-cavitating cases.Using unsteady 3-D simulations and this definition,the vortex rope diameter can be calculated directly.Figure 10 shows the values of the vortex diameter,i.e.,the vortical structure length scale lc,normalized by the vortex core location (Rvcis the radial location of the vortex core) as a function of streamwise locationz normalized by the draft tube inlet radius Rref.The data in Fig.10 present results for several different times,locations,and operating conditions.It can be seen that a curve can be fit through the data with an acceptable accuracy.This curve represents the average value of the length scale of the unsteady coherent structures forming within the shear layer in the draft tube.From this curve,the length scale lcis found to be

where Rvcis the radial distance of the vortex core from the draft tube centerline,z is the streamwise distance from the draft tube inlet,and Rrefis the draft tube inlet radius.The finding of the previous section is very useful here because it was shown that although the vortex rope cannot be modeled by steady axisymmetric simulations,the location of the vortex core,i.e.,Rvcis quite precisely defined by the location of maximum TKE production.Therefore,Eq.(13) can be used in steady axisymmetric simulations to find the length scale of vortical structures required by Eq.(11).It should be noted that formulating the length scaleusing the geometrical parameters inherently imposes some limitations in the model.However,considering the limited range of the diverging angle in draft tubes,it is expected that the present model will show similar performance for comparable draft tubes.Nevertheless,a more general formulation for the length scale of the coherent structures is currently under development.
Finally,the system of equations for the newly developed axisymmetric model is closed.The newly developed k-εRANS model consists of Eq.(6) for the TKE transport whereνcis obtained by Eqs.(11),(9) and (13).The transport equation for the turbulent dissipation rateεremains intact.

Fig.11 Profiles in the simplified draft tube for Case A,comparison of the present model and the realizable k-εturbulence model
4.Results and discussion
Steady axisymmetric simulations are performed for the simplified draft tube using the newly developed model combined with a two-layer zonal model for near wall treatment.All the details of the simulation setup are the same as in Foroutan and Yavuzkurt[19].
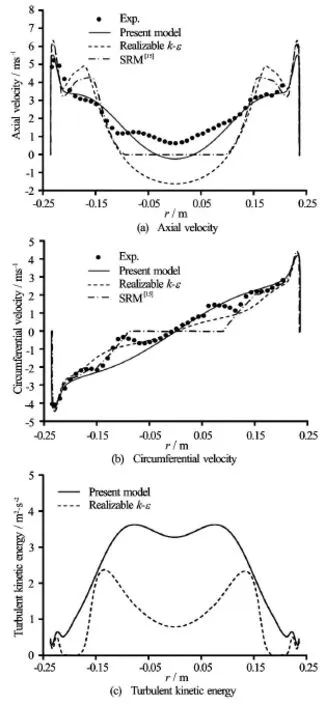
Fig.12 Profiles in the simplified draft tube for Case B,comparison of the present model,the SRM[15],and the realizable k -ε turbulence model
Figure 11 shows the profiles of axial and circumferential velocity,and turbulent kinetic energy in the draft tube for Case A corresponding to 91% of the BEP flow rate.Results are shown at Section S*in the draft tube (see Fig.1).It is seen that the present modified model overcomes the underprediction of the axialvelocity and turbulent kinetic energy near the centerline of the draft tube,and a very good agreement is obtained with experimental data.Specifically,both the level of the TKE and its behavior at the center of the draft tube is modified (as much as 37% improvement at the centerline).Therefore,it is believed that the new model is able to capture the physics of the vortex rope formation in an average sense.It can be seen in Fig.11(b) that the present model does not cause a considerable change in the circumferential velocity distribution in case A where both the realizable k-ε model and the present model are in good agreement with experimental data.Figure 12 shows the same results for case B with 70% of the BEP flow rate.The results of the stagnant region model (SRM) of Susan-Resiga et al.[15]are also depicted for comparison.Again,results for the axial velocity are considerably improved in comparison to the realizable k-εmodel predictions.The new model better predicts the level of the axial velocity at the center of the draft tube,as well as it shows considerable improvement in prediction of the shear flow region.The SRM model shows some improvements,but still overestimates the axial velocity in the shear flow region by as much as 46%.Additionally,zero axial velocity in a large region at the center of the draft tube does not seem to realistically mimic the actual flow behavior.The same conclusion holds for the circumferential velocity,where the present model better captures the swirl over the entire draft tube radius while the SRM cannot give the correct slope near the center of the draft tube.No experimental data for TKE are available for Case B,therefore,only simulations results are presented.It should be noted that all model coefficients and constants are kept unchanged in predicting Cases A and B.
In order to further investigate the model,the TKE budgets are considered.The transport equation for TKE for a steady flow in the simplified draft tube can be written as

where D,P and εare the total TKE diffusion(transport),total TKE production,and total TKE dissipation.In the present model,PandD include both the effect of mean and coherent production and diffusion respectively,i.e.,whereas in a tradition RANS model,PandD only represent the mean production and diffusion of the turbulent kinetic energy (νc=0).
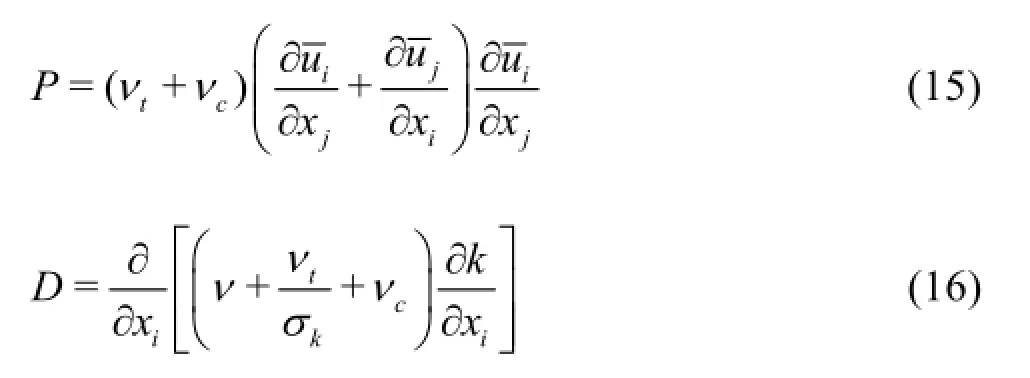
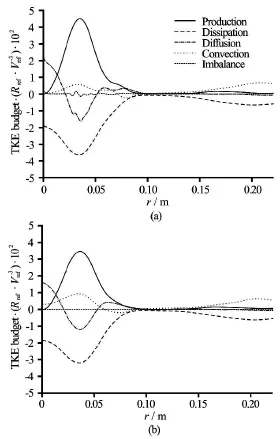
Fig.13 Radial distributions of the normalized TKE budgets (see Eq.(14)) in the draft tube for (a) the present model and(b) its baseline model (the k-εmodel)
Figure 13 shows radial distrib*utions of the normalized TKE budgets at Section S in the draft tube.The terms in the TKE transport equation are normalized by the draft tube inlet velocity (Vref)and radius(Rref).Results of the k-εmodel and the present modified model are plotted in Figs.13(a) and 13(b),respectively.In both simulations,the dominant term around the shear layer (r≈0.035 m)is the TKE production which is in balance with the TKE dissipation.At the centerline,however,the production becomes zero and mainly diffusion and dissipation are in balance.Comparing Figs.13(a) and 13(b),it is clearly seen that the level of TKE production and diffusion is predicted higher using the newly developed model,resulting in the improvements seen in Fig.11 and Fig.12.Specifically,the newly developed model predicts 31% and 46% more TKE production and diffusion right at the shear layer.
In both cases,the “imbalance” budget (also known as the residual) is the net difference between four TKE budgets.The imbalance budget is quite negligible in both cases showing that the TKE transport equation is being solved with negligible numericalerror.It should be noted that in Fig.13 the near wall region is not shown to better present the TKE budgets near the centerline.Moving away from the center of the draft tube towards the wall,the rotation rate and,consequently,the coherent eddy viscosity suddenly decrease.Therefore,the present model behaves similar to the original k-εmodel.However,the near-wall region(y+<200)is associated with very high levels of production and dissipation due to high velocity gradients.In this region the TKE budgets are similar for both cases of k-ε and the modified model (due to the use of the two-layer formulation for the near wall region),and are shown in Fig.14 in the wall coordinates.

Fig.14 Near-wall distributions of the normalized TKE budgets in the draft tube
5.Conclusion
Several previous studies have shown that steady RANS simulations using traditional turbulence models underpredict the axial velocity at the center of the draft tube under partial load conditions.This underprediction,which becomes worse as conditions move farther from BEP,is attributed to the incapability of these models in predicting the turbulence mixing due to the formation of the vortex rope.The attention of the present paper is focused on developing a new steady RANS turbulence model in order to overcome this underprediction and correctly predict the mean flow field in a draft tube operating under partial load using an axisymmetric model.The goal is to provide designers with a simulation tool (a new k-εRANS model) that does not take too much time and storage to run,but lets them evaluate the draft tube performance.It is argued in detail that steady RANS models can give the average location of the vortex rope through the location of the maximum TKE production,but underpredict the level of TKE production and diffusion in regions of the flow where the vortex rope forms.Based on this argument,a new model taking into account the extra production and diffusion of TKE due to coherent structures is developed.Simulations are performed for the simplified axisymmetric FLINDT draft tube.Two partial load operating conditions with same head and different flow rates are considered.The flow rates for these two operating points correspond to 91% (Case A) and 70% (Case B)of the flow rate at BEP.It is clearly shown that predictions of the newly developed RANS model for axial velocity and TKE are in much closer agreement with the experimental data compared to those using the realizable k-εRANS model.TKE budgets are investigated,where it is seen that the newly developed model predicts 31% and 46% more TKE production and diffusion right at the shear layer.The modified level of TKE production and diffusion results in better prediction of TKE profiles which directly affects the velocity profiles through the eddy viscosity in momentum equation.
Acknowledgements
The work presented herein was funded in part by the Office of Energy Efficiency and Renewable Energy (EERE),U.S.Department of Energy,under Award Numbers DE-EE0002667 (the DOE/PSU Graduate Student Fellowship Program for Hydropower Research) and DE-EE0002668 (The HRF Fellowship),and the Hydro Research Foundation.
[1]DÖRFLER P.,SICK M.and COUTU A.Flow-induced pulsation and vibration in hydroelectric machinery[M].London,UK:Springer-Verlag,2013.
[2]PALDE U.Influence of draft tube shape on surging characteristics of reaction turbines[R].Technical Report REC-ERC-72-24,Denver,USA:Bureau of Reclamation,Engineering and Research Center,1972.
[3]MAURI S.Numerical simulation and flow analysis of an elbow diffuser[D].Doctoral Thesis,Lausanne,Switzerland:École Polytechnique Fédérale de Lausanne,2002.
[4]CIOCAN G.D.,VU T.C.and AVELLAN F.et al.Experimental study and numerical simulation of the FLINDT draft tube rotating vortex[J].Journal of Fluids Engineering,2007,129(2):146-158.
[5]ZHANG R.,MAO F.and WU J.et al.Characteristics and control of the draft-tube flow in part-load Francis turbine[J].Journal of Fluids Engineering,2009,131(2):021101.
[6]VU T.,DEVALS C.and ZHANG Y.et al.Steady and unsteady flow computation in an elbow draft tube with experimental validation[J].International Journal of Fluid Machinery and Systems,2011,4(1):85-96.
[7]SKOTAK A.Of the helical vortex in the turbine draft tube modeling[C].20th IAHR Symposium on Hydraulic Machinery and System.Charlotte,NC,USA,2000.
[8]RUPRECHT A.,HELMRICH T.and ASCHENBRENNER T.et al.Simulation of vortex rope in a turbine draft tube[C].21st IAHR Symposium on Hydraulic Machinery and Systems.Lausane,Switzerland,2002,259-266.
[9]PAIK J.,SOTIROPOULOS F.and SALE M.J.Numerical simulation of swirling flow in complex hydroturbine drafttube using unsteady statistical turbulence models[J].Journal of Hydraulic Engineering,ASCE,2005,131(6):441-456.
[10]JAVADI A.,NILSSON H.Time-accurate numerical simulations of swirling flow with rotor-stator interaction[J].Flow Turbulence and Combustion,2015,95(4):755-774.
[11]GYLLENRAM W.,NILSSON H.Design and validation of a scale-adaptive filtering technique for LRN turbulence modeling of unsteady flow[J].Journal of Fluids Engineering,2008,130(5):051401.
[12]JOŠT D.,LIPEJ A.Numerical prediction of non-cavitating and cavitating vortex rope in a Francis turbine draft tube[J].Strojniski Vestnik,2011,57(6):445-456.
[13]JESTER-ZUERKER R.,JUNG A.and MAIWALD M.Evaluation of a Francis turbine draft tube flow at part load using hybrid RANS-LES turbulence modeling[J].IOP Conference Series:Earth and Environmental Science,2012,15(6):062010.
[14]FOROUTAN H.,YAVUZKURT S.A partially-averaged Navier-Stokes model for the simulation of turbulent swirling flow with vortex breakdown[J].International Journal of Heat and Fluid Flow,2014,50:402-416.
[15]SUSAN-RESIGA R.,MUNTEAN S.and STEIN P.et al.Axisymmetric swirling flow simulation of the draft tube vortex in Francis turbines at partial discharge[J].International Journal of Fluid Machinery and Systems,2009,2(4):295-302.
[16]KIRSCHNER O.,MUNTEAN S.and SUSAN-RESIGA R.et al.Swirling flow in a straight cone draft tube:Axisymmetric flow analysis and comparison with circumferentially averaged PIV measurements[C].2nd IAHR International Meeting of the Workgroup on Cavitation and Dynamic Problems in Hydraulic Machinery and Systems.Timisoara,Romania,2007.
[17]SUSAN-RESIGA R.,MUNTEAN S.and HASMATUCHI V.et al.Analysis and prevention of vortex breakdown in the simplified discharge cone of a Francis turbine[J].Journal of Fluids Engineering,2010,132(5):051102.
[18]BOSIOC A.,TANASA C.and MUNTEAN S.et al.2D LDV measurements and comparison with axisymmetric flow analysis of swirling flow in a simplified draft tube[C].3rd IAHR International Meeting of the Workgroup on Cavitation and Dynamic Problems in Hydraulic Machinery and Systems.Brno,Czech Republic,2009,551-560.
[19]FOROUTAN H.,YAVUZKURT S.Flow in the simplified draft tube of a Francis turbine operating at partial load-Part I:Simulation of the vortex rope[J].Journal of Applied Mechanics,2014,81(6):061010.
[20]AVELLAN F.Flow investigation in a Francis draft tube:The FLINDT project[C].20th IAHR Symposium on Hydraulic Machinery and System.Charlotte,NC,USA,2000.
[21]RUDOLF P.,ŠTEFAN D.Reduced order model of draft tube flow[J].IOP Conference Series:Earth and Environmental Science,2014,22:022022.
[22]CIOCAN G.,ILIESCU M.Vortex rope investigation by 3D-PIV method[C].2nd IAHR International Meeting of the Workgroup on Cavitation and Dynamic Problems in Hydraulic Machinery and Systems.Timisoara,Romania,2007.
[23]SCARANO F.,BENOCCI C.and RIETHMULLER M.Pattern recognition analysis of the turbulent flow past a backward facing step[J].Physics of Fluids,1999,11(12):3808-3818.
[24]MATSUMOTO Y.,HOSHINO M.Onset of turbulence induced by a Kelvin-Helmholtz vortex[J].Geophysical Research Letters,2004,31(2):L02807
[25]BREDE M.Measurement of turbulence production in the cylinder separated shear-layer using event-triggered laser doppler anemometry[J].Experiments in Fluids,2004,36(6):860-866.
[26]ILIESCU M.,CIOCAN G.D.and AVELLAN F.Analysis of the cavitating draft tube vortex in a Francis turbine using particle image velocimetry measurements in twophase flow[J].Journal of Fluids Engineering,2008,130(2):021105.
10.1016/S1001-6058(16)60621-2
(Received May 10,2015,Revised November 25,2015)
* Biography:Hosein FOROUTAN (1984-),Male,Ph.D.,National Research Council Postdoctoral Fellow
2016,28(2):195-205
- 水动力学研究与进展 B辑的其它文章
- Manoeuvring prediction based on CFD generated derivatives*
- Effects of water flow on the uptake of phosphorus by sediments:An experimental investigation*
- Improved formulas for thermal behavior of oscillating nanobubbles*
- Lattice Boltzmann method for Casimir invariant of two-dimensional turbulence*
- The experiment and analysis of transitional flow in pipe*
- Numerical simulation of 3-D free surface flows by overlapping MPS*

