Raman Spectra of Bredigite at High Temperature and High Pressure
XIONG Zhi-hua, ZHAO Ming-zhen, HE Jun-guo, LI Yi-peng, LI Hong-zhong
1. School of Earth and Space Science, Peking University, Beijing 100871, China
2. School of Material Science and Engineering, South China University of Technology, Guangzhou 510275, China
3. School of Earth Science and Geological Engineering, Sun Yat-sen University, Guangzhou 510275, China
4. Guangdong Provincial Key Lab of Geological Processes and Mineral Resource Survey, Guangzhou 510275, China
5. University of Houston, Department of Earth and Atmospheric Sciences,Houston, Texas 77204-5007, USA
6. Key Laboratory of Mineral Resource, Institute of Geology and Geophysics, Chinese Academy of Sciences, Beijing 100029, China
Raman Spectra of Bredigite at High Temperature and High Pressure
XIONG Zhi-hua1, ZHAO Ming-zhen2, HE Jun-guo3,4*, LI Yi-peng5, LI Hong-zhong4,6*
1. School of Earth and Space Science, Peking University, Beijing 100871, China
2. School of Material Science and Engineering, South China University of Technology, Guangzhou 510275, China
3. School of Earth Science and Geological Engineering, Sun Yat-sen University, Guangzhou 510275, China
4. Guangdong Provincial Key Lab of Geological Processes and Mineral Resource Survey, Guangzhou 510275, China
5. University of Houston, Department of Earth and Atmospheric Sciences,Houston, Texas 77204-5007, USA
6. Key Laboratory of Mineral Resource, Institute of Geology and Geophysics, Chinese Academy of Sciences, Beijing 100029, China
Bredigite was synthesized by using the Piston-Cylinder in 1.2 GPa and 1 473 K. With external heating device and diamond anvil cell, high temperature and high pressure Raman spectra of bredigite were collected at temperatures 298, 353, 463, 543, 663, 773 and 873 K and with pressure from 1 atm up to 14.36 GPa (room temperature). The SEM image showed that the sample consisted of one crystalline phase with grain size ranging from 10~20 μm. The EPMA data suggest a chemical formula of Ca7.03(2)Mg0.98(2)Si3.94(2)O16which was identical to the theoretical component of bredigite. The Raman spectroscopic results indicate there were 29 vibration bands of bredigite at high temperature. Some bands were merging, weakening and disappearing increasingly with the temperature, which was obvious in the range of 800~1 200 cm-1. The vibration bands of 909, 927 and 950 cm-1disappeared at 873, 773 and 873 K, respectively. The results primarily indicated that the structure of bredigite was stable under experimental condition. In addition, isobaric mode-Grüneisen parameters and isothermal mode-Grüneisen parameters were calculated, yielding 1.47(2) and 0.45(3) as their mean values, respectively. Anharmonic coefficients were estimated based on the high temperature and high pressure Raman experiments, showing that the contributions to anharmonic-effect induced with the Si—O vibration modes were smaller than other modes.
Bredigite; High temperature Raman; High pressure Raman; Anharmonic coefficients
Introduction

bredigite can be formed as follows
(1)
AsCa2SiO4andCa3Mg(SiO4)2werefoundinbothSkarnareaandasinclusionsindiamond,bredigitewasanticipatedtobeakindofimportantcompositionofcrustandmantle.Inaddition,bredigitealsoplayedimportantrolesincements,clinkers,slagsandfertilizersindustry.Butthepropertiesofbredigiteremainedunclear.Inthisstudy,wesynthesizedpurebredigitewithpiston-cylinderat1.2GPaand1 473K.HightemperatureRamanspectrumsofbredigitewerecollectedwithexternalthermaldevicefromroomtemperatureto873K,andhighpressureRamanofbredigiteupto14.36GPa.

Fig.1 Unit cell representation of the crystalstructure of bredigite (Without Ca)
1 Experimental
Thestartingmaterialforthehigh-Psynthesizingexperimentswithfollowingsteps:wefirstlymixedthepowdersofSiO2,MgOandCaCO3underacetoneinamolarratioof7∶1∶4,whichwerepretreatedat1atmand723Kfor5days;wesecondlypressedthismixtureintoapelletanddegasseditat1atmand1 472Kforabout48hours;wethirdlycrushedfinelythepelletunderacetoneintoapower,whichwaslaterstoredat383Kinadryingoven.Thestartingmaterialforthehigh-PsynthesizingexperimentswassealedintoaPtcapsule.Theapparatususedinoursynthesizingexperimentsispiston-cylinder,detailedintroductionsareavailableinLiuandFleet[18].Thesynthesizingconditionswere1.2GPaand1 473Kwithaheatingtimeof24hours.
TheRamansystemusedinhightemperatureandhighpressureexperimentswasequippedwithamonochromaticArionlaser.Ramansignalwereexcitedbya514.5nmmonochromaticargonionbeamandrecordedbytheCCDdetector.
Hightemperatureenvironmentusedinourexperimentwascreatedbyakindofheatingdevice[19].Andhigh-pressureRamanspectrawerecollectedwiththeuseofdiamond-anvil-cell.Coupleofsmallrubysphereswasplacedinthesamplechamberalongwiththe4∶1methanolandethanolaspressuremediumtomonitoranddeterminethepressurevariations(Maoetal. 1978).AbackscatteringgeometrywasusedtocollectRamandataandeachspectrumwascollectedatabout15mins.TheRamanpeakswereanalyzedwithVoigtprofilesusingthePeakFitprogram.
2 Result and discussion
2.1 Sample detection
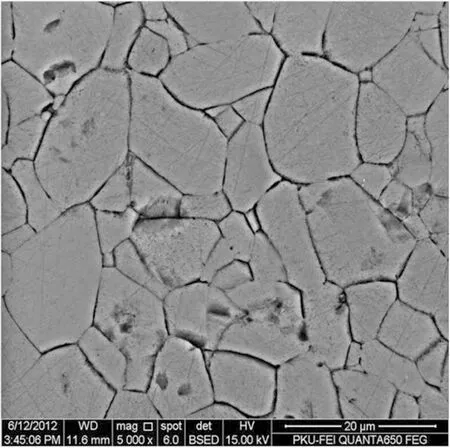
Someportionsofthesynthesizedsampleswereselectedrandomlyandexaminedbyascanningelectronmicroscope(Quanta650FEG).AsshowedinFig.2,theproductsynthesizedisasinglephase,withthesizeofthegrainrangefrom10to20μm.

Fig.2 SEM image of bredigite, showingits grain size is 10~20 μm
Besides,Ramanspectrumscollectedrandomlyonthesurfaceofthesampleturnedouttobesame,whichindicatedthestructureofsamplesynthesizedwereidentical.Finally,electronmicroprobeanalyseswereconductedon10arbitrarilyselectedgrainsofthesample,andtheiraveragewasCa7.03(2)Mg0.98(2)Si3.94(2)O16,whichwasinaccordancewiththeidealformulaofbredigite.Allthetestesprovethesuccessinsynthesizingbredigite.

Fig.3 High temperature Raman spectrums of bredigite
2.2 High-temperature high-pressure Raman
HightemperatureRamanspectrumswerecollectedfromroomtemperatureupto873K(298, 353, 463, 543, 663, 773and873K).AsshowedinFig.3, 29peakscouldbedetectedinhightemperatureexperimentstotally,andthepeakpositionshifttowardtolowerfrequency.Withanalysis,wefoundthatnonewpeaksappearedastemperatureincreased,butsomeprimitivepeaksdisappearedbecauseoftheweakeningoftheirintensity;meanwhile,somepeaksmergedtogetherwiththeincreasingoftemperature. .
Comparedwithmineralswithsimilarcompositionandstructure,wefoundthatthebandsoftherangefrom500to1 200cm-1couldbeassignedtotheSi-Ostretching,whichwereinternalmodes;andthebandsappearedintherangefrom50to500cm-1couldbeattributedtothestretchingofMg-OandCa-O,aswellasthetranslationandrotationsofSiO4andMgO6[24-26].
AsshowninTable1andFig.4,vibrationpeakwasinlineardriftasthetemperaturewaschanging.BasedontheresultofhightemperatureRamanexperiments,thestructureofbredigiteshouldbeastableonewithintheinvestigatedtemperaturerange.

Table 1 Temperature and pressure dependences of vibrational frequency shifts, and anharmonic parameters of bredigite
Isobaric Grüneisen parameter can be calculated as
(2)
In whichν0iand ∂νi/∂Twas the mode frequencies at ambient conditions and theretemperature-dependent frequency shift, respectively,αisthere was the thermal expansion coefficient. For there was no high temperature experiment performed to investigate the thermal expansion coefficients. So take the minerals including monticellite and pyroxene as references[28-30], the thermal expansion coefficients was assumed as 3.96×10⁻⁵K-1in this study.

Fig.4 Raman frequency shifts as functions of temperature
The results of the calculated isobaric Grüneisen parameters were listed in Table 1. Values corresponding to the internal modes range from 1.5 to 3.22, lattice modes range from 0.63 to 1.21. The average value of all isobaric Grüneisen parameters is 1.47(3).
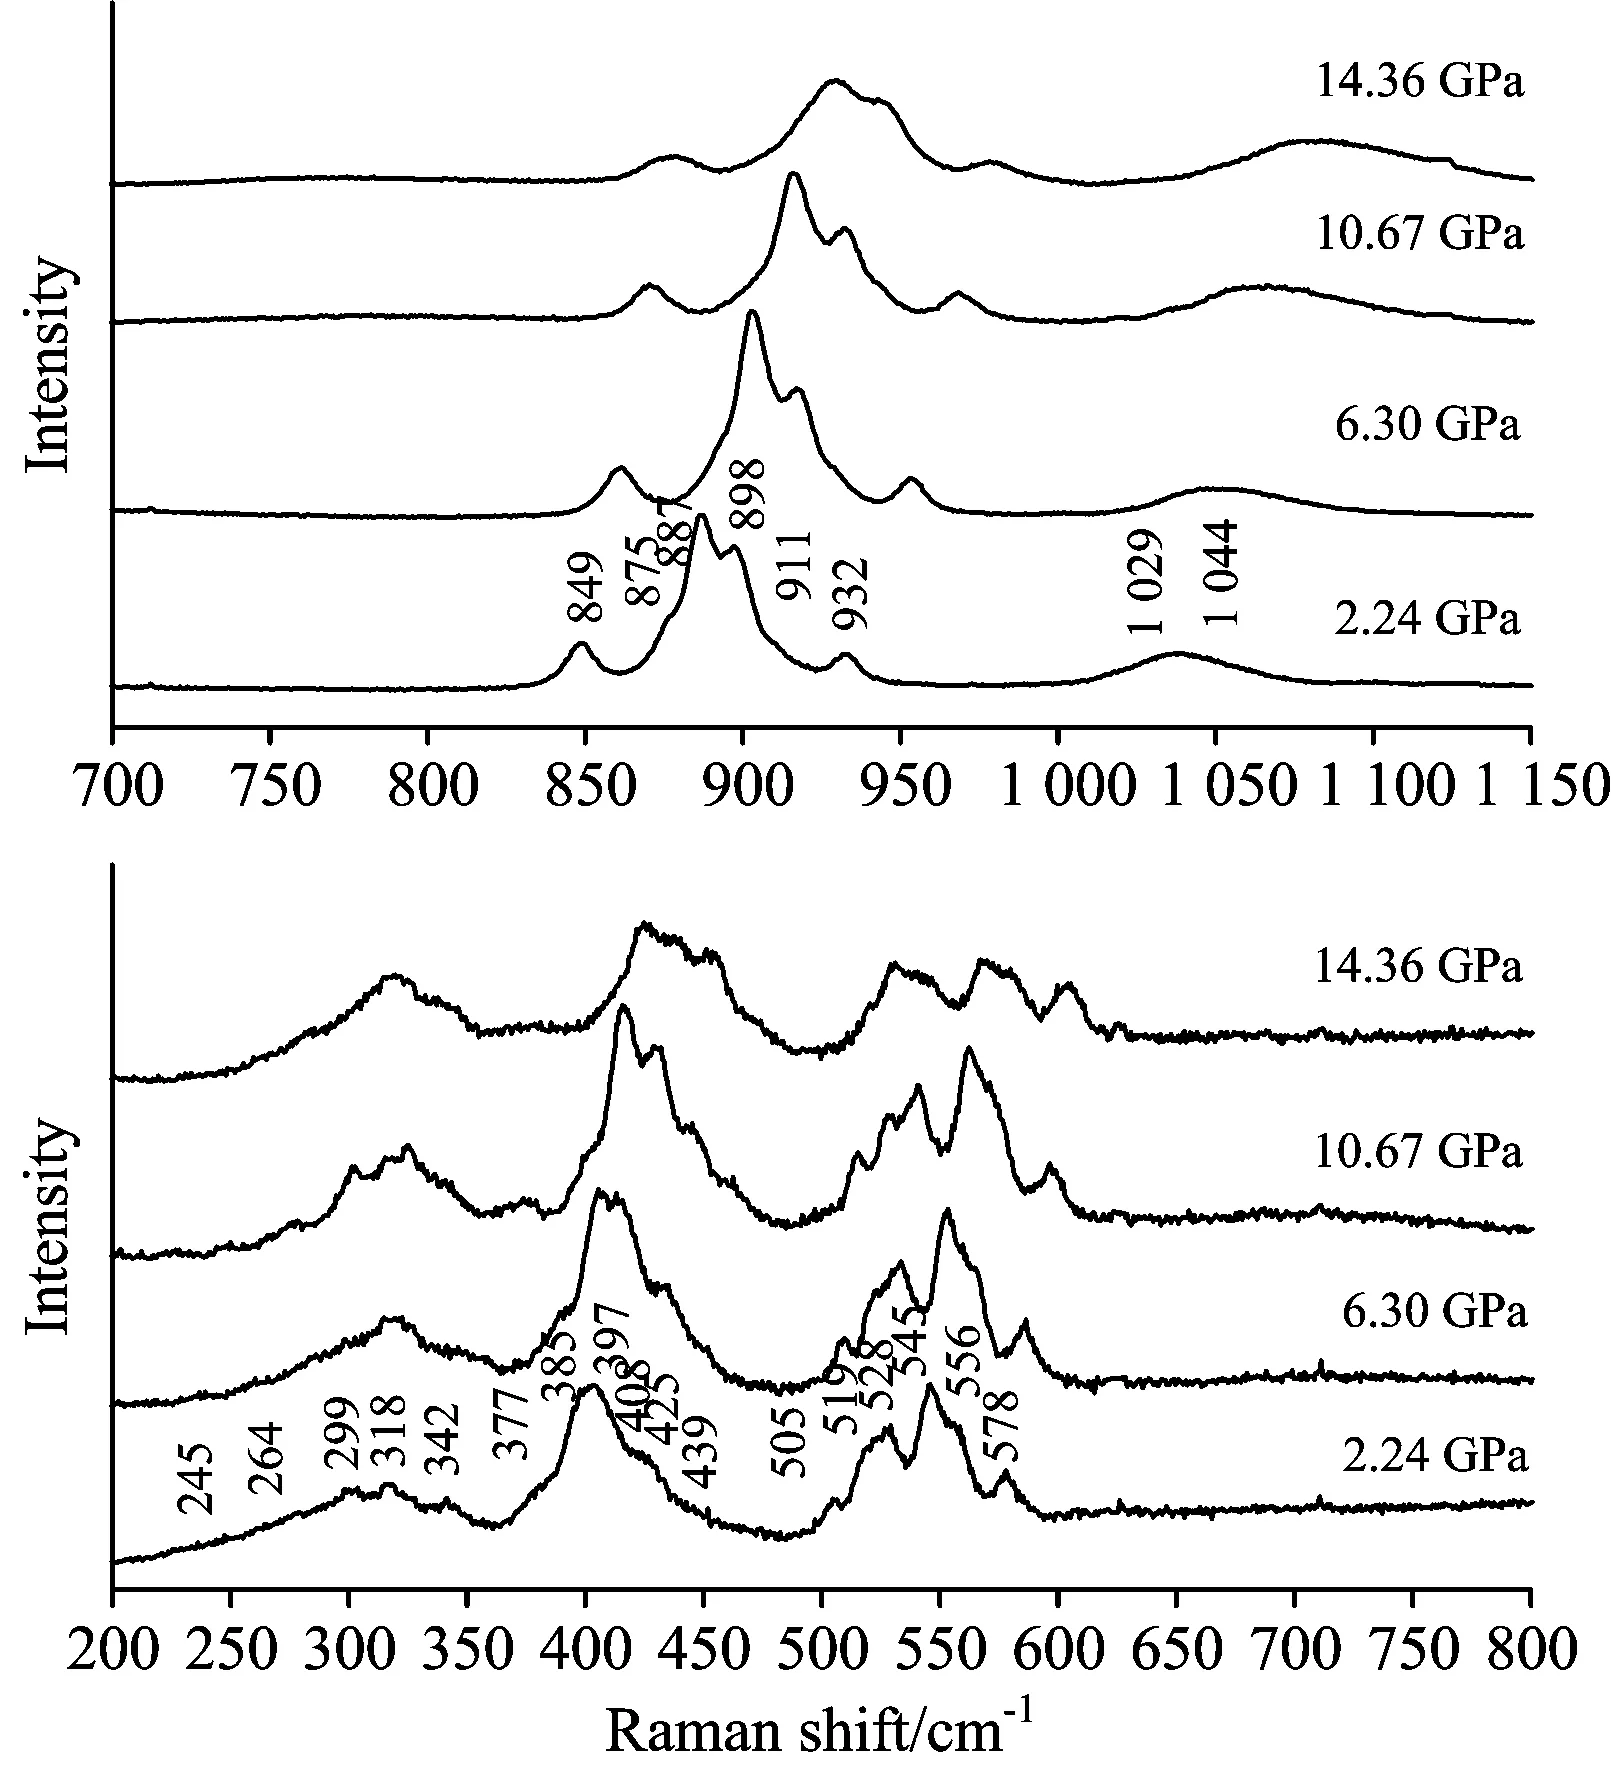
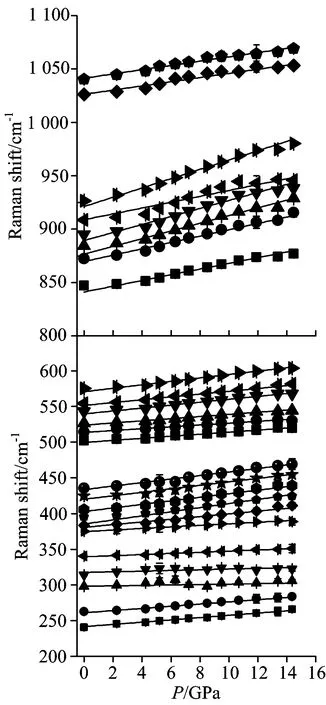
High pressure Raman spectrums were showed as Fig.5. Totally, 25 peaks were collected in high pressure experiments, with 17 peaks distributed in the range of 200~600 cm-1and 8 peaks in the range of 800~110 cm-1. All the peaks shift toward high frequency as pressure increases without the appearance of new peaks or the disappearance of primitive peaks. The fitting results showed that the relationship between peak shifting and pressure is a linear one, and the Frequency shifts as a function of pressure of bredigite were shown in Table 1. The results of high pressure Raman also primitively indicate that the structure of bredigite can be stable as pressure increase up to 14.36 GPa.
Similarly as to thermal expansion coefficients, we also took minerals including monticellite and pyroxene as reference[31-33], the bulk modulus of bredigite was assumed as 109 GPa in this study. The mode-Grüneisen parameter (γi) can be obtained from the following equation
(5)

Fig.5 Representative Raman spectra of bredigite at high pressures (room temperature) in the range of (a) 200~800 cm-1; (b) 700~1 150 cm-1

Fig.6 Raman frequency shifts ad a function of pressure of bredigite
Whereν0iand dνi/dPare mode frequencies at ambient conditions and their pressure-dependent frequency shift, respectively,KTstand for the bulk modulus. These parameters were calculated using polynomial fitting of the Raman frequencies as a function of pressure. The obtained dνi/dPandγivalues Table 1.
The results of the calculated mode Grüneisen parameters were listed in Table1. Values corresponding to the internal modes range from 0.2 to 0.45, lattice modes range from 0.47 to 0.80. The average value of all mode Grüneisen parameters is 0.45(8).
2.3 Anharmonic parameter
Anharmonic parameter is an important parameter in thermodynamic system, which stands for the anharmonic extent induced by temperature and pressure. According to the equation[34]
(4)

Fig.7 Anharmonic parameters of bredigite
Combining the result of high temperature and high pressure experiments, the estimated anharmonic parameters of different modes were listed in Table 1 and Fig.7. The values of internal modes range from -0.84 to -3.57, and the values of lattice modes range from -3.81 to -6.27.
It’s obvious that the absolute value of internal modes was smaller than that of lattice modes. The results indicate that the vibrations of Si-O have more contributions to heat capacity than other vibrational-modes.
3 Conclusions
(1) Bredigite was synthesized with piston-cylinder under 1.2 GPa and 1 473 K;
(2) High temperature Raman spectrums were collected form room temperature to 873 K, providing the shift rates and isobaric Grüneisen parameters. The average of all isobaric Grüneisen parameters was 1.47(3). The result of high temperature Raman experiment showed that no phase transition happened in bredigite’s structure within the investigated temperature range;
(3) With diamond anvil cell, high pressure Raman spectrums were collected up to 14.36 GPa, giving the shift rates and mode- Grüneisen parameters, the average of all mode Grüneisen parameters was 0.45(8). The result of high pressure Raman experiment showed that the structure of bredigite could keep stable as pressure up to at least 14.36 GPa;
(4) Anharmonic parameters were calculated based on the results of high temperature and high pressure experiments, the result showed that the anharmonic effects of vibration induced by Si-O were smaller than other vibration modes.
[1] Tilley C E. Mineralogical Magazine, 1929, 22: 77.
[2] Sabine P A, Styles M T, Young B R. Mineralogical Magazine, 1985, 49: 663.
[3] Tilley C E, Vincent H C G. Mineralogical Magazine, 1948, 28: 255.
[4] Douglas A M B. Mineralogical Magazine, 1951, 29: 875.
[5] Bridge T E. American Mineralogist, 1966, 51: 1766.
[6] Sarakar S L, Jeffrey J W. Journal of the American Ceramic Society, 1978, 61: 177.
[7] Moore PB, Araki T. American Mineralogist, 1976, 61: 74.
[8] Lin H C, Foster W R. Journal of American Ceramic Society, 1975, 58: 73.
[9] Taylor J H. American Mineralogist, 1935, 20: 120.
[10] Mason B. American Mineralogist, 1957, 42: 379.
[11] Joswig W, Stachel T, Harris J W, et al. Earth and Planetary Science Letters, 1999, 173: 1.
[12] Brenker F E, Vincze L, Vekemans B, et al. Earth and Planetary Science Letters, 2005, 236: 579.
[13] Lee K W, Park S H, Yoon H S, et al. Optis Express, 2012, 20: 6248.
[14] Lee K H, Im W B. Journal of American Ceramic Society, 2013, 96: 503.
[15] Yi D, Wu C, Ma B, et al. Journal Biomaterials Applications, 2014, 28: 1343.
[16] Wu C, Chang J, Wang J, et al. Biomaterials, 2005, 26: 2925.
[17] Schlaudt C M, Roy D M. Journal of the American Ceramic Society, 1966, 49: 430.
[18] Liu X, Fleet M E. Journal of Mineralogical and Petrological Science, 2009, 104: 25.
[19] Wang F, Liu X, Lv M D, et al. Spectroscopy and Spectral Analysis, 2015, (In review).
[20] Mao H K, Bell P M, Shaner J W, et al. Journal of Applied Physics, 1978, 49: 3276.
[21] Klotz S, Chervin J-C, Musch P, et al. Journal of Physics D: Applied Physics, 2009, 42: 075413.
[22] Angel R J, Bujak M, Zhao J, et al. Journal of Applied Crystallography, 2007, 40: 26.
[23] Godwal B K, Speziale S, Clark S M, et al. Journal of Physics and Chemistry of Solids, 2010, 71: 1059.
[24] Mohanan K, Sharma S K. American Mineralogist, 1993, 78: 42.
[25] Kolesov B A, Geiger C A. Physics and Chemistry of Minerals, 2004, 31: 142.
[26] Kleppe A K, Jephcoat A P, Smyth J R. Physics and Chemistry of Minerals, 2006, 32: 700.
[27] Noel Y, Catti M, D’ArcoPh, et al. Physics and Chemistry of Minerals, 2006, 33: 383.
[28] Ye Y, Schwering R S, Smyth J R. American Mineralogist, 2009, 94: 899.
[29] Lager R A, Carmichael E P. American Mineralogist, 1978, 63: 365.
[30] Cameron M, Sueno S, Prewitt C T, et al. American Mineralogist, 1973, 58: 594.
[31] Hazen R M. American Mineralogist, 1976, 61: 1280.
[32] Sharp Z D, Hazen R M, Finger I W. American Mineralogist, 1987, 72: 748.
[33] Walker A M, Tyer R P, Bruin R P, et al. Physics and Chemistry of Minerals, 2008, 35: 359.
[34] Gillet P, Richet P, Guyot F, et al. Journal of Geophysical Research, 1991, 96: 11805.
*通讯联系人
S511
A
白硅钙石的高温高压拉曼光谱研究
熊志华1,赵明臻2,何俊国3, 4*,李羿芃5,李红中4, 6*
1. 北京大学地球与空间科学学院, 北京 100871
2. 华南理工大学材料科学与工程学院, 广东 广州 510275
3. 中山大学地球科学与地质工程学院, 广东 广州 510275
4. 广东省地质过程与矿产资源探查重点实验室,广东 广州 510275
5. University of Houston, Department of Earth and Atmospheric Sciences, Houston, Texas 77204-5007, USA
6. 中国科学院地质与地球物理研究所,中国科学院矿产资源研究重点实验室, 北京 100029
利用活塞圆筒装置在1.2 GPa,1 473 K的条件下合成了白硅钙石。采用外加热装置和金刚石压腔结合拉曼光谱分析技术,采集了白硅钙石298,353,463,543,663,773以及873 K温度区间的常压及1 atm~14.36 GPa(常温)压力区间的拉曼谱图。扫描电镜下,该研究合成的样品为结构一致的单一相,颗粒大小为10~20 μm。电子探针分析结果表明,样品的组成为Ca7.03(2)Mg0.98(2)Si3.94(2)O16,该组分完全吻合白硅钙石理论组分。Raman分析结果表明,高温时白硅钙石的拉曼谱图中具有29个振动峰。随着温度的升高,部分振动峰出现了合并或者弱化消失的现象。该现象尤其以800~1 200 cm-1范围内的909,927和950 cm-1振动峰峰位最为明显,这些振动峰分别在873,773以及873 K时弱化消失。据此,白硅钙石的结构在实验温压范围内稳定,且随着温度和压力的升高,其拉曼振动峰峰位分别呈现往低频和高频方向线性飘移的趋势。除此之外,根据高温和高压拉曼实验的结果,分别计算了白硅钙石拉曼振动峰峰位的等压mode-Grüneisen参数和等温mode-Grüneisen参数,其算术平均值分别为1.47(2)和0.45(3)。最后结合高温和高压拉曼实验的结果,计算了白硅钙石的非谐系数,结果表明,Si-O振动模式对于非谐效应的贡献要小于其他振动模式。
白硅钙石;高温拉曼;高压拉曼;非谐系数
2015-07-03,
2015-11-29)
Foundation item:National Natural Science Foundation of China(410090371, 41273072, 41303025)
10.3964/j.issn.1000-0593(2016)10-3404-06
Received:2015-07-03; accepted:2015-11-29
Biography:XIONG Zhi-hua, (1987—), female, a PhD candidate at school of Earth and Space Science, Peking University e-mail: zhihuaxiong@pku.edu.cn *Corresponding authors e-mail: waynelee01@163.com;lihongzhong01@aliyun.com
- 光谱学与光谱分析的其它文章
- Gd靶激光等离子体光源离带辐射及其等离子体演化的研究
- Probing the Binding of Torasemide to Pepsin and Trypsin by Spectroscopic and Molecular Docking Methods
- Mn(Ⅱ)-5-Br-PADAP共沉淀-火焰原子吸收光谱法测定虾、贝样中的镉
- Near Infrared Spectroscopy Study on Nitrogen in Shortcut Nitrification and Denitrification Using Principal Component Analysis Combined with BP Neural Networks
- 内蒙古草原植被最大光能利用率取值优化研究
- 健康和糖尿病大鼠红细胞荧光光谱非线性程度差异

