
Studied on Distribution and Heavy Metal Pollution Index of Heavy Metals in Water from Upper Reaches of the Yellow River, China
2016-07-12 12:57:05ZUOHangMAXiaolingCHENYizhenLIUYing
光谱学与光谱分析 2016年9期
ZUO Hang, MA Xiao-ling, CHEN Yi-zhen,LIU Ying,2*
1. College of Life and Environmental Sciences, Minzu University of China, Beijing 100081, China 2.Beijing Engineering Research Center of Food Environment and Public Health,Minzu University of China, Beijing 100081, China 3.China National Environmental Monitoring Center, Beijing 100012, China
Studied on Distribution and Heavy Metal Pollution Index of Heavy Metals in Water from Upper Reaches of the Yellow River, China
ZUO Hang1,3, MA Xiao-ling1, CHEN Yi-zhen1,LIU Ying1,2*
1. College of Life and Environmental Sciences, Minzu University of China, Beijing 100081, China 2.Beijing Engineering Research Center of Food Environment and Public Health,Minzu University of China, Beijing 100081, China 3.China National Environmental Monitoring Center, Beijing 100012, China
In order to understand the spatial distribution and evaluate the pollution degree of heavy metals (As, Cd, Cr, Co, Cu, Mn, Ni, Pb, and Zn) in upper reaches of the Yellow River, surface water samples were collected from 12 selected sites during two field surveys in April 2014 (drought season) and October 2014 (normal season).The concentrations of heavy metals were determined using inductively coupled plasma mass spectrometry (ICP-MS) for spatial variation and heavy metal pollution index.The average concentrations of the metals in the drought season and normal season decreased respectively in the order: Cr (18.56 μg·L-1)>As (2.95 μg·L-1)>Ni (1.87 μg·L-1)>Mn (1.20 μg·L-1)>Cu (1.12 μg·L-1)>Zn (0.59 μg·L-1)>Pb (0.08 μg·L-1)>Cd (0.01 μg·L-1); Mn (596.89 μg·L-1)>Zn (52.46 μg·L-1)>Cu (36.27 μg·L-1)>Ni (25.11 μg·L-1)>Cr (23.19 μg·L-1)>Pb (19.51 μg·L-1)>As (7.30 μg·L-1)>Cd (0.37 μg·L-1).The results were compared with national and international water quality guidelines, as well as literature values reported for the same river in flood season.To assess the composite influence of all the considered metals on the overall quality of the water, heavy metal pollution indices were calculated.The Heavy Metal Pollution Index (HPI) of the river calculated for the individual locations showed ranging from 6.46 to 11.95 in drought season, 4.53 to 210.53 in normal season, respectively.Both the distribution of metals and HPI of two seasons revealed obvious seasonal variation.The results showed that the degree of heavy metal contaminant was not very high and had seasonal variation; both the concentrations of metals and HPIs indicated the pollution level of the normal season was higher than it of the drought season.The results of this paper provided reliable experimental data and theoretical basis for the relevant departments to make further policy decision.
Heavy metal; Distribution; Heavy metal pollution indices; The Yellow River
Introduction
Heavy metals become a special group of contaminants of water resources and attain high ecological significance because they are not removed from water through self-purification, and they can accumulate in reservoirs and enter the food chain[1].With the rapid development of urbanization and industrialization in many developing countries, heavy metals contamination in river is one of the major quality issues[2].Characterization of the spatial variation of water quality variables can provide an improved understanding of the environmental conditions and help researchers establish priorities for sustainable water management[3].
Heavy metal pollution index (HPI) is a method that rates the aggregate influence of individual heavy metal on the overall quality of water and is useful in getting a composite influence of all the metals on overall pollution, with reference to particular metal only.In recent years HPI has been given much attention towards the evaluation of heavy metal pollution in ground and surface waters, which has been used by a number of researchers globally[4].
The Yellow River, the second longest river in China, runs northeastward along the southern boundary of the study area, was the most important water source for the area.The study area is a newly developed industrial region located in the west of China along the upper reaches of the Yellow River, which is rich in mining of Pyrite, Galena, Zinc ore, Copper ore, Kaolin Clay and other mineral resources.Over the past two decades, vast economic growth has been achieved in the area due to the increasing of industrial plants, such as metal mining, mineral processing, metal smelting, chemical and related manufacturing industry, and these may brought metal pollution in the Yellow River.
During past 10 years, studies were carried out on the concentration, the fraction and the assessment of heavy metals in sediment of the Yellow River, however, investigations on water contamination of the Yellow River were not popular.Liu[5]had studied on ecological risk assessment from Gansu, Ningxia and Inner Mongolia sections of the Yellow River during flood season in 2012.The main goal of this paper is studies the concentration distribution of As, Cd, Cr, Co, Cu, Mn, Ni, Pb, and Zn during drought season and normal season and reveals the contamination status with the HPI.
1 Material and methods
1.1 Sampling and analysis
Surface water samples were collected in 12 sites from upstream to downstream along the Yellow River in Gansu, Ningxia and Inner Mongolia regions during drought season (April 2014) and normal season (October 2014).The sampling points are given in Fig.1.S2, S4, S6, S7, S9 and S10 were belonged to the national control sections, S1, S3, S5, S8, S11 and S12 were set on the sections where branches carried industrial wastewater flowed in the main stream.Surface water samples were collected in High Density Polyethylene (HDPE) containers with preconditioned acid washed and filtered through prewashed 0.45 μm Millipore nitrocellulose filters.The initial portion of the filtration was discarded to clean the membrane and filter, the following ones were acidified to pH<2 using supra pure HNO3and then stored at 4 ℃ for further laboratory analysis.
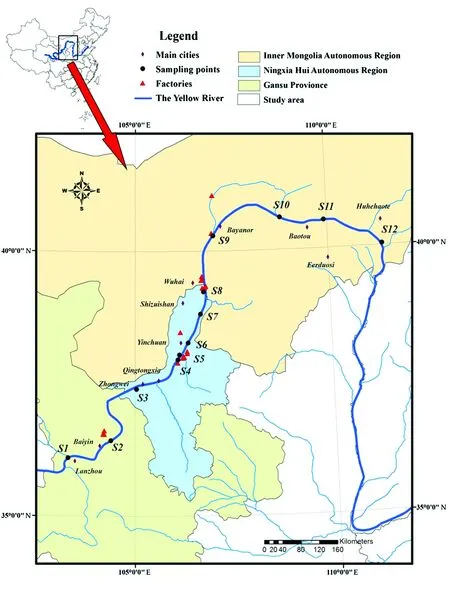
Fig.1 Map of study area, industrial area of upper reaches of the Yellow River
S1: Fuhedaqiao; S2: Dongdagou; S3: Xiaheyan; S4: Nangangou; S5: Jinshawan; S6: Lingwudonggou; S7: Pingluohuanghedaqiao; S8: Mahuanggou; S9: Dengkou; S10: Zongpaigan; S11: Huajiangyingzi; S12: Lamawan
1.2 Determination of metals
All the water samples were tested at the CNNC Beijing Research Institute of Uranium Geology, which was certificated by the China National Accreditation Board for Laboratories, Environment Impact Assessment and Quality Management System.The concentrations of As, Cr, Cd, Cu, Mn, Ni, Pb and Zn in water samples were determined using Inductively Coupled Plasma Mass Spectrometry (ICP-MS, Elan DCR-e, PerkinElmer) according to the methods DZ/T 0064.80—1993, EPA 7473 and GB/T 8538—2008.
1.3 Heavy metal pollution index
Heavy metal pollution index (HPI) is a rating technique that provides the composite influence of individual heavy metal on the overall quality of water.Rating system is an arbitrary value between 0 and 1, and its selection depends upon the importance of individual quality considerations in a comparative way, or it can be assessed by making values inversely proportional to the recommended standard for the corresponding parameter[4].
The HPI model proposed is given as followed.
(1)
WhereQiis the sub index of theith parameter.Wiis the unit weightage ofith parameter andnis the number of parameters considered.The critical pollution index of HPI value for drinking water as given by Prasad and Bose[6]is 100.However, a modified scale using three classes has been used in the present study after Edet and Offiong[7].The classes have been demarcated as low, medium and high for HPI values <15, 15~30 and >30, respectively.
The sub index (Qi) of the parameter is calculated by
(2)
WhereMiis the monitored value of heavy metal ofith parameter,Iiis the ideal value of ith parameter,Siis the standard value ofith parameter.The sign (-) indicates the numerical difference of the two values, ignoring the algebraic sign.To calculateWi, the drinking water standards (GB 5749—2006) and WHO (2006) were used for As, Cr, Cd, Cu, Mn, Pb, Zn and Ni, respectively.
2 Results and Discussion
2.1 Distribution of heavy metals
Fig.2 shows the distribution of heavy metals of the 12 sampling sites in two seasons.In the drought season, the concentrations of heavy metals were ranged over following intervals (μg·L-1): Cd: 0.003~0.02; Pb: 0.01~0.16; Zn: 0.10~1.24;Cu: 0.62~1.88; Mn: 0.02~6.40; Ni: 1.00~2.36; As: 2.12~4.21; Cr: 15.30~22.30; And the minimum and maximum concentrations (μg·L-1) of heavy metals in the samples of the normal season were found: Cd: 0.02~0.78; As: 2.63~14.50; Pb: 0.42~46.30; Cr: 5.68~55.80; Ni: 2.17~64.60; Cu: 3.25~110.00; Zn: 5.22~139.00; Mn: 31.60~1 274.00.
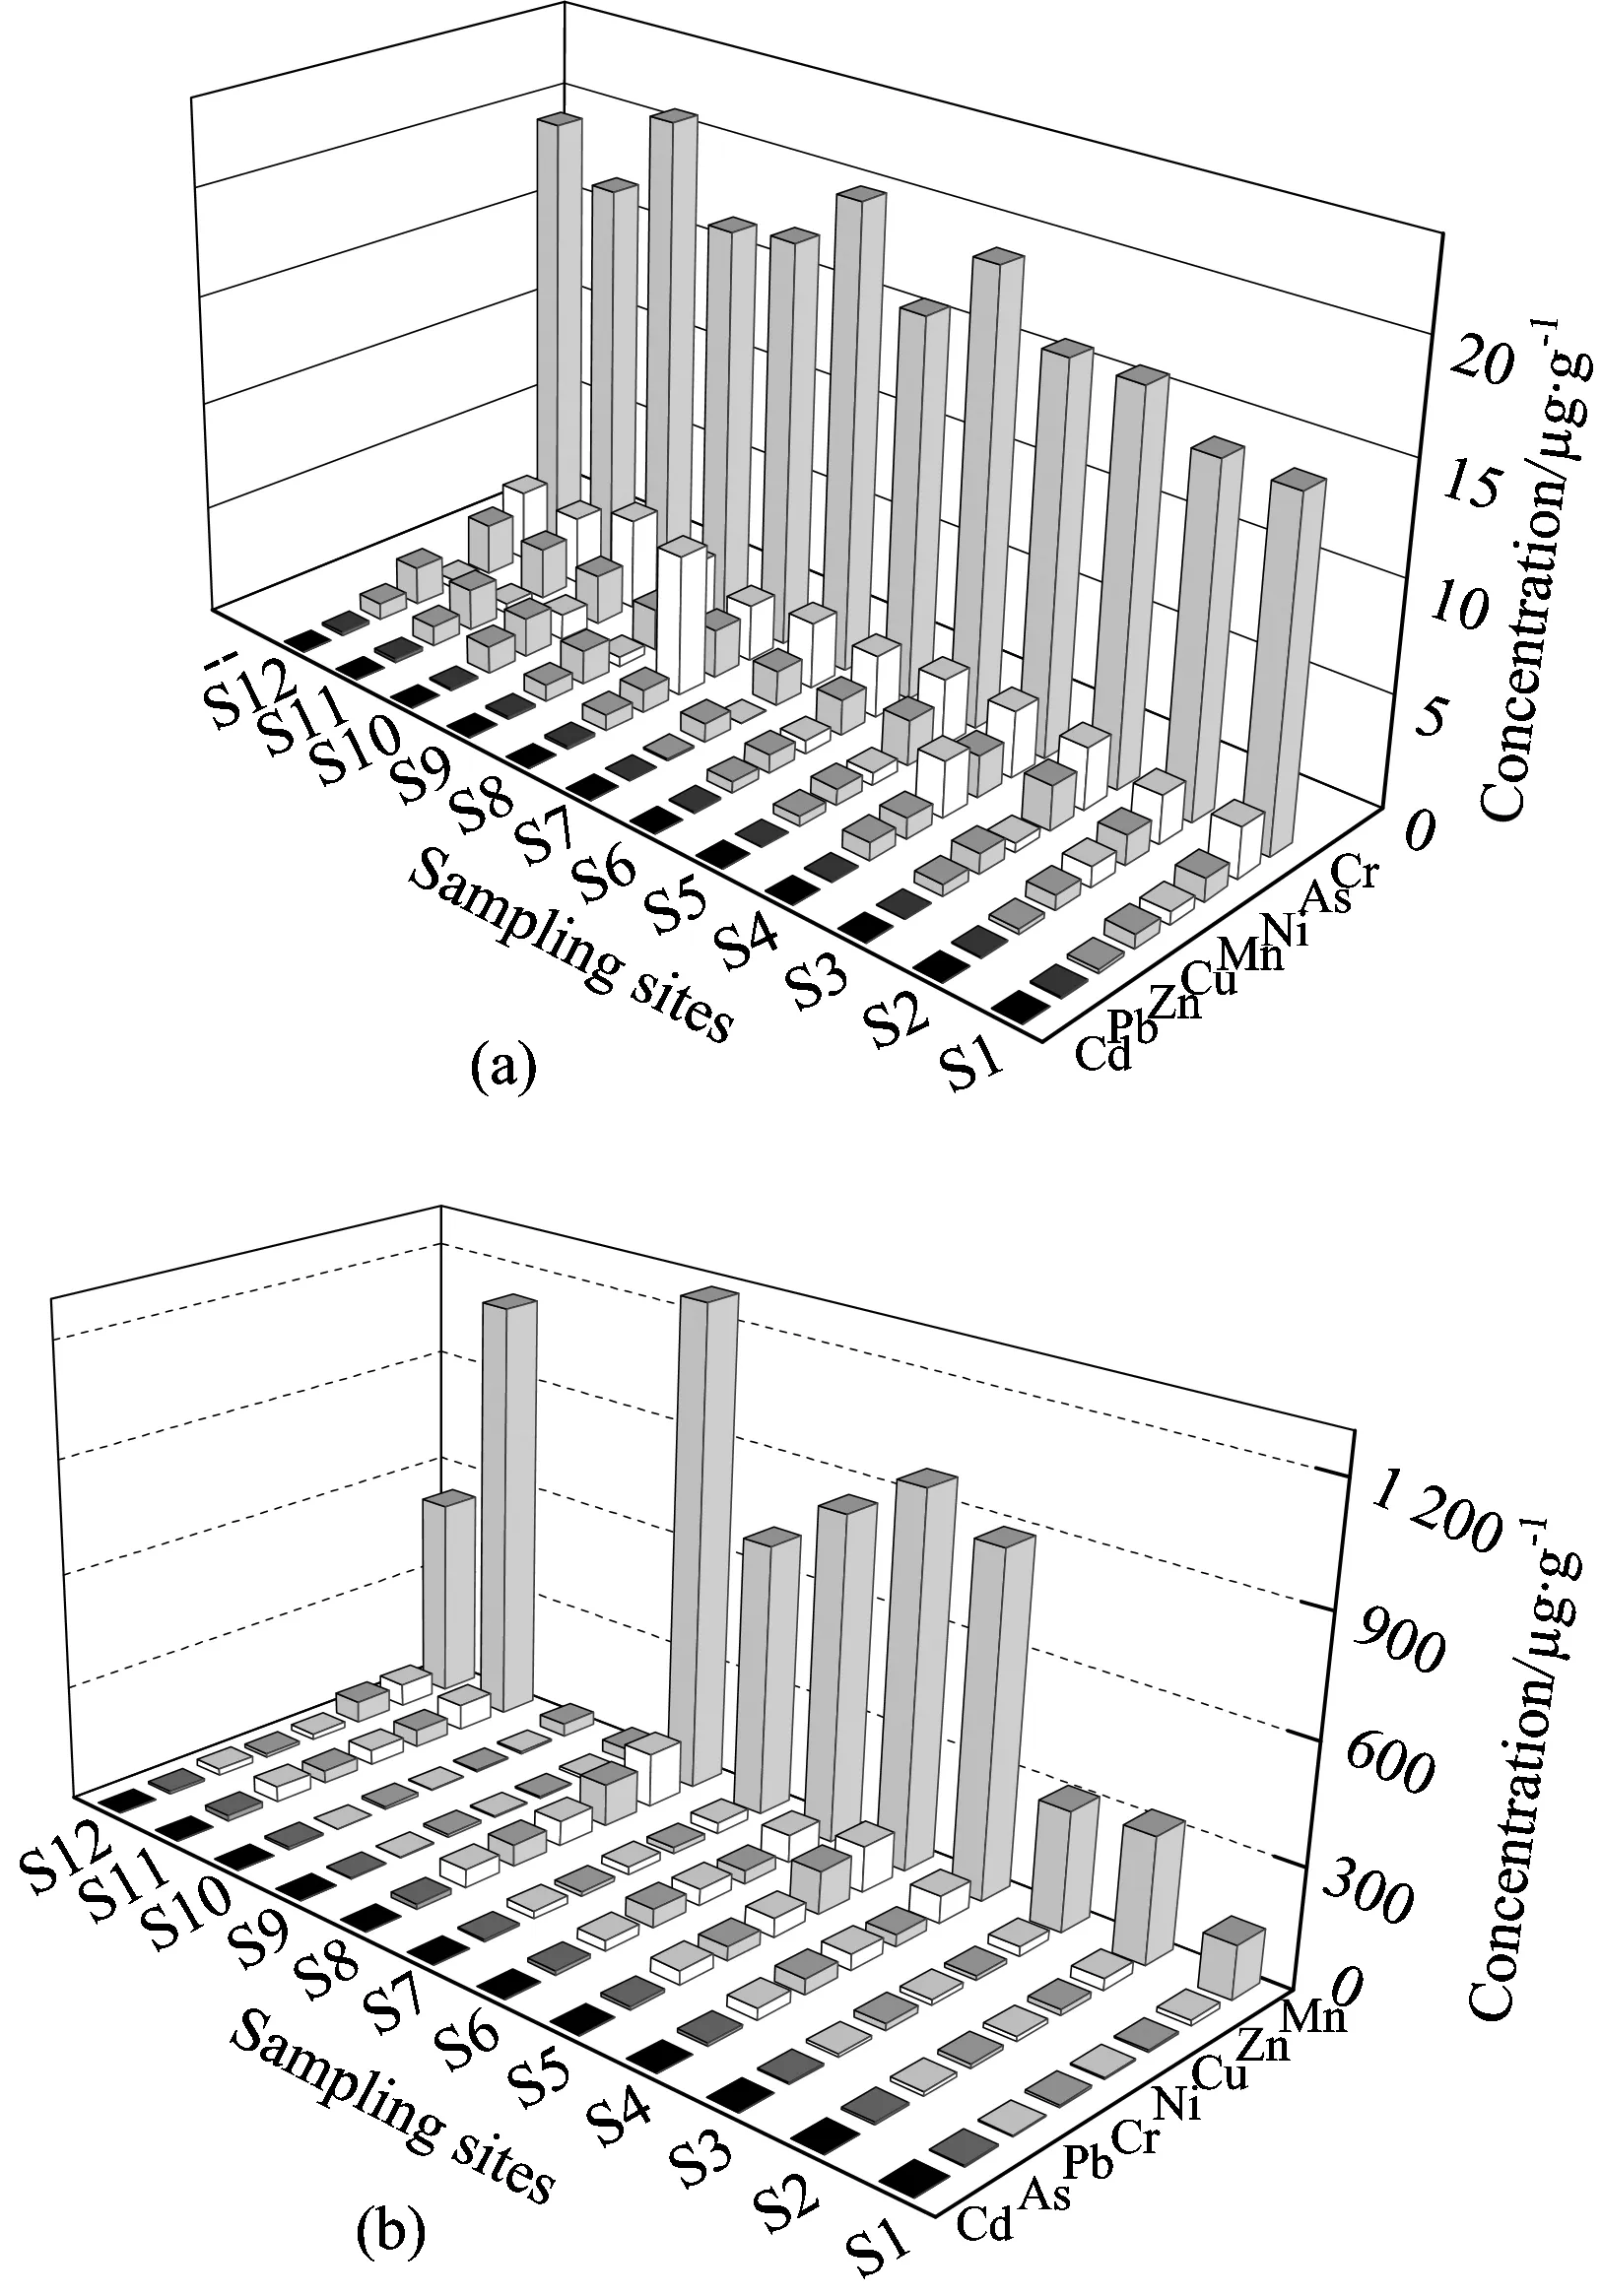
Fig.2 Distribution of heavy metals of all the 12 sampling sites in drought season (a) and normal season (b)
The Table 1 was generated by comparing measured concentrations of elements with drinking water quality standards currently effective in China (GB5749,2006), WHO(2006) and US EPA(2009), also with the China Environmental quality standards for surface water(2002) and water quality criteria in the US EPA(2006).

Table 1 The concentrations of heavy metals from various sources (μg·L-1)
To Table 1

SE1.400.024.450.85-0.780.111.02Drinkingwaterquality,WHO200350200010070103000WHO,2006Drinkingwaterquality,China10550100010020101000China,2006Drinkingwaterquality,USEPA50~2005100130050-155000USEPA,2009ChinaEnvironmentalGuidelinesClassⅠ501.01010100-1050ClassⅡ505.0501000--101000China,2002ClassⅢ505.0501000--501000ClassⅣ1005.0501000--502000ClassⅤ10010.01001000--1002000FreshwaterqualitycriteriaforprotectionofaquaticlifeCMC,acute3404.31613-47065120USEPA,2006CCC,chronic1502.2119-522.5120
Compared to the drinking water quality guidelines mentioned above, the mean concentration of the metals for drought season were all under the permissible value.Meanwhile in the normal season, the average concentration of Mn (596.89 μg·L-1) and Pb (19.51 μg·L-1) were much higher than the drinking water standards and the other elemental concentrations were acceptable.
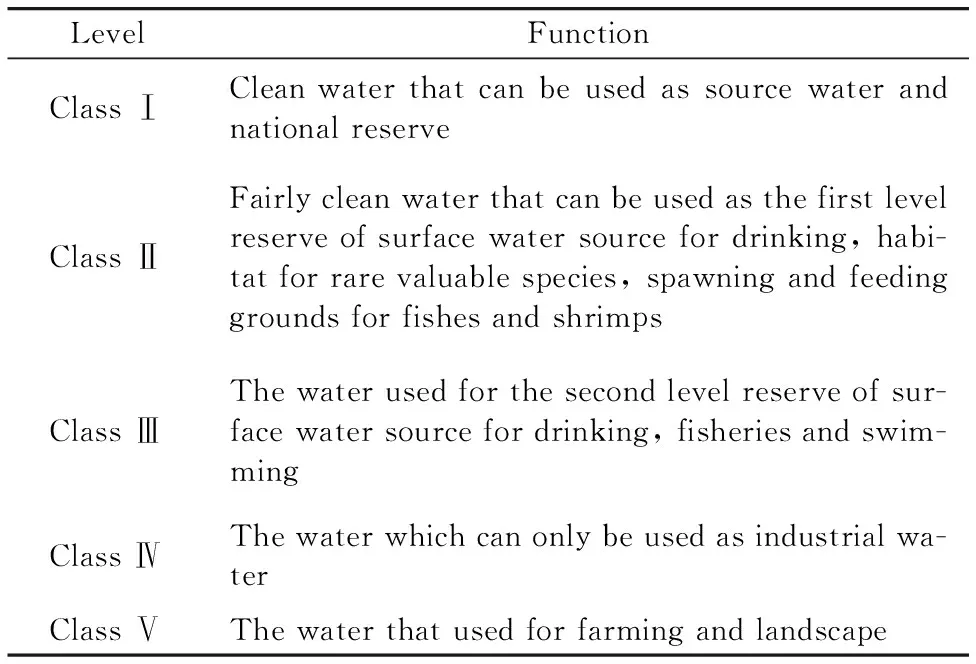
Table 2 Level and Function of inland water in China
Inland waters have been divided into five classes (GB 3838, 2002) in China, levels and functions were given in Table 2.Therefore, in drought season, the mean concentrations of all the metals were under the value given for the Class Ⅰ except for Cr (18.56 μg·L-1) whose value was between Class Ⅰ and Ⅲ.In normal season, The level of Cr (23.19 μg·L-1), Cu (36.27 μg·L-1), Mn (596.89 μg·L-1), Pb (19.51 μg·L-1), Zn (52.46 μg·L-1) was above the Class Ⅰ, and the mean concentration of Mn was almost 6 times of the given value.
When compared with the priority toxic pollutants, As, Cd, Cr, Cu, Ni, Pb and Zn (listed in US EPA (2006) water quality criteria), the mean concentrations of Cr for the drought season and Cr, Cu for the normal season were greater than the criteria maximum concentrations (CMC) and criterion continuous concentration (CCC) values of the US EPA Water Quality Criteria; The values for Pb in the normal season were lower than the US EPAs CMC value and higher than CCC value.
2.2 Seasonal variation of metals
The concentrations of dissolved metals displayed great seasonality.In drought season, the mean concentration of heavy metals decreased in the following order (μg·L-1): Cr (18.56)>As (2.95)>Ni (1.87)>Mn (1.20)>Cu (1.12)>Zn (0.59)>Pb (0.08)>Cd (0.01).In normal season, the average concentration of heavy metals arranged as follows (μg·L-1): Mn (596.89)>Zn (52.46)>Cu (36.27)>Ni (25.11)>Cr (23.19)>Pb (19.51)>As (7.30)>Cd (0.37).The total concentrations of all the studied elements in surface water had an average of 26.37 and 761.10 μg·L-1in the drought season and normal season, respectively.For each metal, the concentration in normal season was much higher than that in drought season.Especially for Mn, Pb and Zn, whose mean concentrations were almost 500, 200 and 100 times between the two seasons.
A relationship was found when compare the sum concentration of heavy metals with the GDP of the study area at the same period (Fig.3).The data of sum concentration of heavy metals for the flood season were obtained from literature[5].In drought season (normally during January to April), there was a reduction of industrial production because of the cold weather and traditional festival[8].In flood and normal season (from May to October), the concentration of heavy metals increased with the GDP in the reason of intense anthropogenic activities (agriculture and high degree of mining activities) in summer[9].
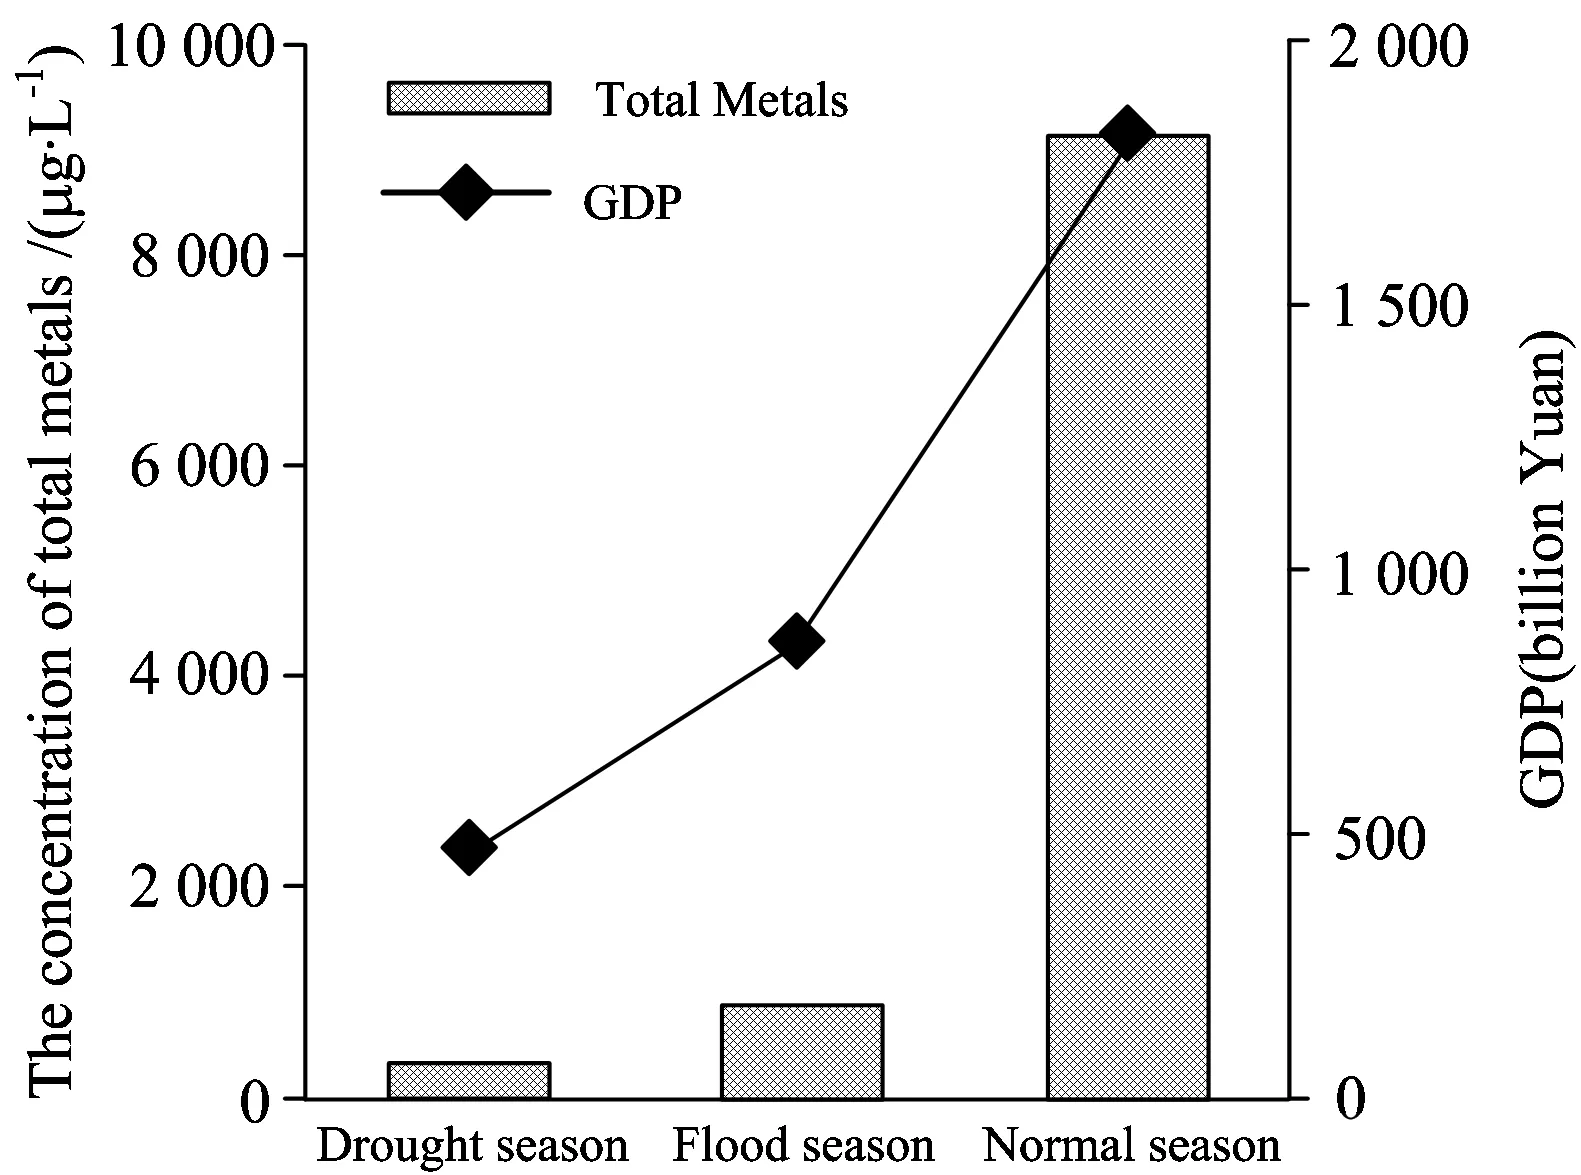
Fig.3 The relationship of the sum concentration of metals and GDP
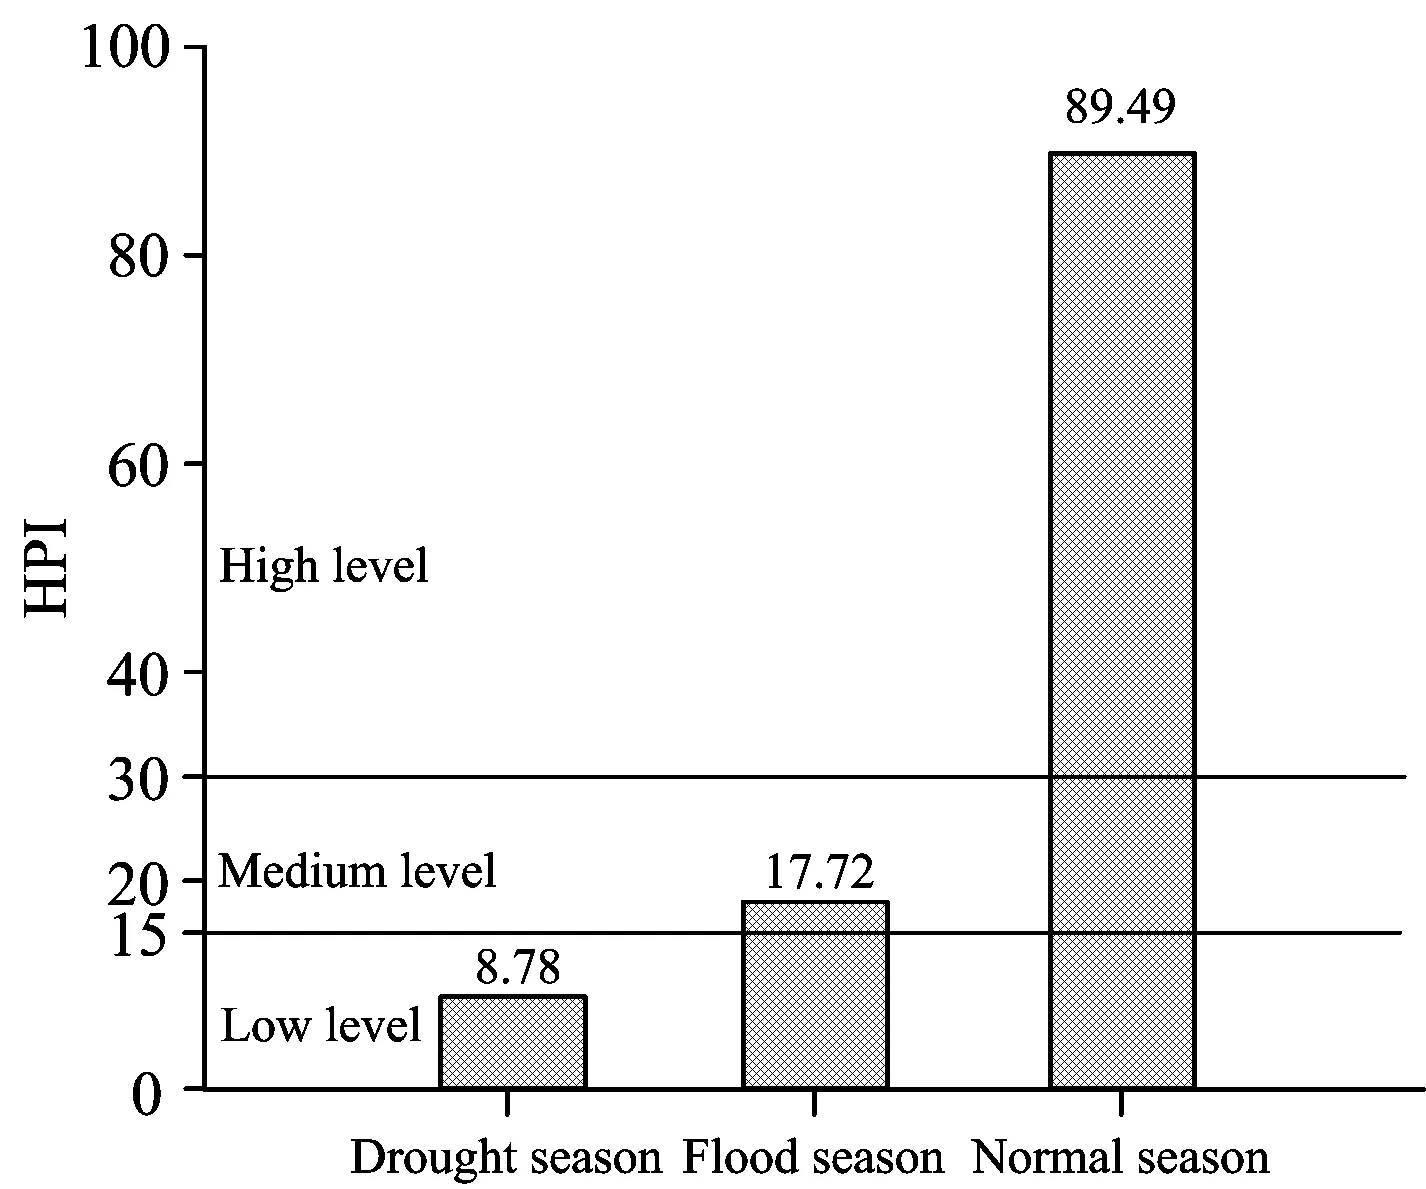
Fig.4 The HPI value for three seasons
2.3 Heavy Metal Pollution Index
HPI is an effective tool to characterize the surface water pollution because HPI combines several parameters to obtain a particular value which can be compared with the critical value to assess the extent of pollution and potability of the water.In order to calculate the HPI of the water, the mean concentration values of As, Cd, Cr, Cu, Mn, Ni, Pb, Zn have been taken into account.HPIs were calculated and the results for the drought season and the normal season were depicted in Table 3.
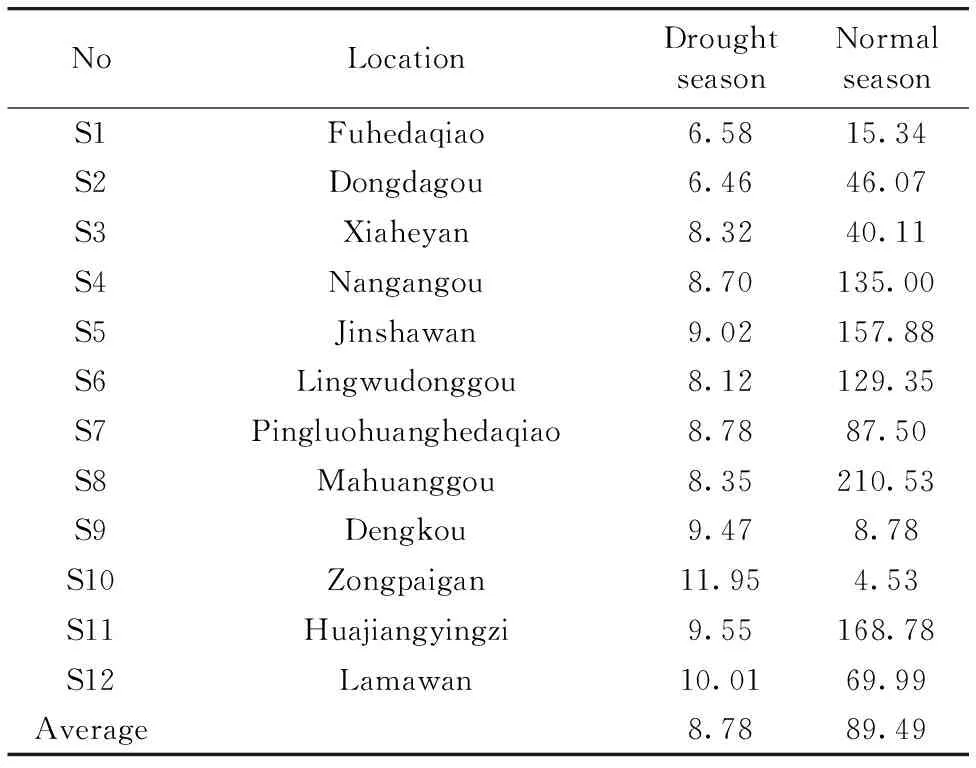
Table 3 HPI values for the different locations in two seasons (μg·L-1)
The average HPI of three seasons were provided as supplementary Fig.4.Among them, data from Liu[5]obtained during the flood season in 2011 were used for calculating HPI of the flood season.The quality of water in regard to metals for the drought season, the flood season and the normal season fell in the low class (HPI<15), the medium class (HPI15~30) and the high class (HPI>30), respectively.The Highest HPI value were calculated (89.49) for the normal season as compared to the other ones, which is the same consequence as the distribution of heavy metal concentrations found in the water during the three seasons.
In the drought season, The HPI value for surface water of the Yellow River of the 12 locations all fell under the low class, which suggested that the surface water was not influenced by anthropogenic activity.In the normal season, the HPI of the surface water of the Yellow River calculated for the individual locations showed great variations.The HPI values ranged from 4.53 to 210.53, the lowest HPI was calculated at Zongpaigan, which located between two industrial areas, while the highest was at Mahuanggou, which located on the downstream of a mineral industry district.Considering the classes of HPI, 75% locations fell under the high class (HPI>30) which were under the influence of mining and industries.The sampling sites, Nangangou, Jinshawan, Lingwudonggou, Pingluohuanghedaqiao and Mahuanggou, which located in Ningxia Hui Autonomous Region, were influenced heavily by leather industry, mining industry and smelting industry, had a very high average HPI value of 144.05, which was even higher than the critical value of 100.Especially at location of Mahuanggou, the HPI was calculated to be 210.53.Besides these, the HPI calculated for sampling sites of Huajiangyingzi and Lamawan which located in Inner Mongolia Autonomous Region also fell in the high class.These two locations were under the influence of active lead, zinc and copper mining, as well as rare earth industry.While the lower HPI value was found in the site of Dengkou and Zongpaigan, this may be because of the Yellow River’s self-purification, as in that district there were not many factories.
So it can be inferred that the composite influence of all the considered metals on the overall quality of the water is alarming owing to the mineralization, mining and industrial activities near some of the locations that can be visualized while evaluating the HPI for each location.
3 Conclusions
Concentrations of As, Cr, Co, Cu, Mn, Ni, Pb and Zn in the surface water of the Yellow River demonstrated great seasonality.The average concentrations of metals increased from drought season to normal season, and the variation trend kept consistent with GDP of the study area.
Compared to drinking water guidelines established by WHO, China and the US EPA, China Environmental Guidelines and Freshwater quality criteria, the mean concentrations of most heavy metals were under the permissible values for drought season.Except for Cr, which the concentration was a little higher than standard, and for normal season, all the concentration of metals increased a lot, much greater attention should be paid to Mn, Pb and Cu when the concentrations were beyond the permissible value.The higher contents of metals in the normal season imply more human activities influence.
HPI values for drought and normal seasons revealed that it increased successively from drought season to flood season to normal season.In drought season the HPI value fell into low class in 12 sites.In normal season, the HPI ranged from 4.53 to 210.53 with an average of 89.49, falling in the high class.High HPI were observed at the locations near to industries and mining.
The results of the present study suggested that the upper reaches of the Yellow River was slightly contaminated by heavy metals, but the HPI values indicated that the water was polluted during the normal season.In conclusion, as an eco-environmentally fragile regions and an economic developing area, the study area should be given more attention to control the emission of heavy metals to sustain the ecological integrity.
[1] Kunwar P S, Amrita M, Nikita B, et al.Chemometr.Intell.Lab.,2007, 87: 185.
[2] Ahmad M K, Islam S, Rahman S, et al.Int.J.Environ.Res.,2010, 4(2):321.
[3] Kolovos A, Christakos G, Serre M L, et al.Water Resour.Res., 2002, 38(12): 1318.
[4] Mohan S V, Nithila P, Reddy S J.J.Environ.Sci.Health A,1996, 31(2): 283.
[5] Liu J J, Liu Y.Spectrosc.Spectr.Anal.,2013, 33(12): 3249.
[6] Prasad B, Bose J M.Environ.Geol.,2001, 41: 183.
[7] Edet A E, Offiong O E, GeoJournal,2002, 57: 295.
[8] Gui W L, Han Z Z.Journal of Quantitative & Technical Economics.2011, 28(7): 77.
[9] Olias M, Nieto J M, Sarmiento A M, et al.Sci.Total.Environ.2004, 333: 267.
X52
A
黄河上游水体中重金属分布特征及重金属污染指数研究
左 航1,3,马小玲1,陈艺贞1,刘 颖1,2*
1.中央民族大学生命与环境科学学院,北京 100081 2.中央民族大学北京市食品环境与健康工程技术研究中心,北京 100081 3.中国环境监测总站,北京 100012
为了研究黄河上游地区水体中重金属含量分布特征及评价该区域重金属污染水平,分别于2014年4月(枯水期)和10月(平水期),在12个采样点采集了24个黄河表层水样。由电感耦合等离子质谱仪ICP-MS测量水样中As,Cd,Cr,Co,Cu,Mn,Ni,Pb和Zn的含量,并确定黄河上游水体中重金属分布特征和重金属污染指数。结果显示枯水期重金属的平均浓度顺序是:Cr(18.56 μg·L-1)>As(2.95 μg·L-1)>Ni(1.87 μg·L-1)>Mn(1.20 μg·L-1)>Cu(1.12 μg·L-1)>Zn(0.59 μg·L-1)>Pb(0.08 μg·L-1)>Cd(0.01 μg·L-1),平水期的重金属平均浓度顺序是:Mn(596.89 μg·L-1)>Zn(52.46 μg·L-1)>Cu(36.27 μg·L-1)>Ni(25.11 μg·L-1)>Cr(23.19 μg·L-1)>Pb(19.51 μg·L-1)>As(7.30 μg·L-1)>Cd(0.37 μg·L-1)。将重金属含量测定结果与中国和国际水质参考值以及同地区丰水期重金属含量数据进行了比较,结果显示Cr,Mn,Pb和Cu含量高于标准值。同时,用重金属污染指数(HPI)评估所有金属对整个水体的影响,结果表明各选点枯水期HPI值为6.46~11.95,平水期HPI为4.53~210.53。两个季节的重金属分布特征和HPI都显示了明显的季节性变化。研究结果表明黄河研究流域水体重金属含量及HPI均显示平水期重金属污染程度较枯水期高,可能与季节性生产及降水变化有关。研究结果可为相关部门制定环保政策提供可信的实验数据和理论依据。
重金属;分布;重金属污染指数;黄河
2015-08-04,
2015-12-20)
Foundation item:The National Natural Science Foundation of China(21177163), 111 Project B08044, First-class University First Class Academic Program of Minzu University of China(YLDX01013), Coordinate Development of First-Class and First-Class University Discipline Construction Funds(10301-0150200604), The Academic Team Construction Project of Minzu University of China(2015MDTD25C&13C), The Fundamental Research Funds for the Central Universities(2015,Ph.D)
10.3964/j.issn.1000-0593(2016)09-3047-06
Received:2015-08-04; accepted:2015-12-20
Biography:ZUO Hang, (1981—), Doctor of College of Life and Environmental Sciences, Minzu University of China e-mail: zuohang@cnemc.cn *Corresponding author e-mail: liuying4300@163.com
*通讯联系人
猜你喜欢
国家教育行政学院学报(2022年11期)2022-12-30 16:12:44
银幕内外(2020年5期)2020-11-25 02:42:59
陶山(2019年2期)2019-12-15 20:52:00
辐射防护通讯(2019年3期)2019-04-26 05:16:26
绿色科技(2018年24期)2019-01-19 06:36:50
意林(儿童绘本)(2018年10期)2018-11-08 11:01:36
史志学刊(2018年4期)2018-09-04 09:22:14
韩国语教学与研究(2017年2期)2017-03-07 17:48:24
中央民族大学学报(自然科学版)(2015年1期)2015-06-11 02:56:46
中央民族大学学报(自然科学版)(2015年2期)2015-06-09 08:45:14
