Molar volume of eutectic solvents as a function of molar composition and temperature☆
Farouq S.Mjalli
Petroleum and Chemical Engineering Department,Sultan Qaboos University,123 Muscat,Oman
1.Introduction
The recent interest in finding alternatives to ionic liquids to alleviate their high synthesis cost obstacle has increased recently and the area of synthesis and characterization of deep eutectic solvents(DES)have been under the focus of many recent articles.Deep eutectic solvents,when carefully designed for a particular application can replace conventional ionic liquids and be used economically in large industrial scales[1].Many studies have focused on exploring the physico-chemical characteristics of these liquids[2–5].These and many similar studies indicated that the physical and thermodynamic properties of the DES are profoundly affected by the nature of DES components,their composition,temperature,pH value and moisture and impurity content.Hence,it's of extreme importance to study the DES properties under these factors.This will enable the better selection and use of these solvents for diverse current and future applications.
Liquid volume is a fundamental physical property that is often required in engineering design and rating calculations.Examples are fluid flow calculations,thermodynamic calculations,design of separation equipment and many more.In addition,the experimental molar volume data can be utilized in predicting other physical properties[6].This property is usually determined experimentally.However,in certain situations,it's not practical to conduct such experiments due to the many factors affecting its value.This is even more serious for the case of DES molar volume data.DES can be synthesized using countless salt to hydrogen bond molar compositions and the value of this property is affected by temperature to a great extent.Hence,prediction methods for this property may fill in this gap by providing a practical and simple mathematical alternative for evaluating this property under different experimental factors.Efficient prediction methods will contribute heavily in developing reliable property calculation methods for process simulators and reduce the effort needed to design and rate industrial equipment.
Predicting the molar volume of liquids in general and deep eutectic solvents in particular is a basic requirement for enabling their implementation in different industrial applications.This property was measured and modeled for many ionic liquids[7].However,very little studies are reported for the measurement and modeling of deep eutectic solvents molar volume[8–11].Most of the previously reported models of DES molar volume are of linear form with temperature[12–15].These simple models are specific to particular DES systems and they cannot be generalized for different DES systems.
More general predictive models involve molecular structure parameters like group contributions[16–19]or based on the corresponding state principle[7].However,the previous methods are more suitable to molecular liquids and usually do not perform well for ionic liquids and their analogs[16].Thermodynamic methods based on the critical properties have shown reasonable success in predicting the molar volume of these liquids[17].An example of such models is the Rackett model[20–22].This model predicts the reduced saturated liquid density or volume as a function of its critical properties and temperature.
Recently,few studies have been reported on new prediction methods and strategies.To mention some of these studies,Black-box artificial intelligence methods such as artificial neural networks(ANN)were used to model DES density as a function of temperature[23].The ANN-based model was very accurate in predicting the studied systems density with an overall deviation of 0.14%.In a similar study,the molecular structure of the DES was encoded using the concept of the mass connectivity index[24].This parameter was calculated for 20 commonly used type III DESs and adopted in a simple correlation for predicting DES density as function of temperature.The MCI-based model over performed the conventional Rackett model.
The original form of the Rackett model was studied for predicting DES molar volume data[25].It was found that the basic Rackett assumption of ln(V/Vc)tends toZas the reduced temperature goes to zero is invalid for the case of DES.Hence,proper modifications were applied on the Rackett equation and these modifications proved to be reliable for predicting molar volume of variety of DESs.
All the previously modeling attempts focused on taking the temperature as the major contributing factor for the DES molar volume.In this study,the effect of DES composition is added as another important factor for predicting the molar volume.The conventional Rackett molar volume model was modified to incorporate the molar DES composition.The model performance was compared to the original form using experimental data for 13 type III DESs.
2.Proposed Molar Volume Model
The Rackett model[20]was among the earliest successful predictive models for the molar volume of molecular liquids.In its basic form,this model can be expressed as:

where Vc,Tc,and Zcare respectively the critical density,temperature and compressibility factor.At theTr=0,the Rackett equation reduces to:

SubstitutingVC=ZCRTC/PCin Eq.(1)and putting this equation in its exponential form as:

Unfortunately,the Rackett Eq.(3)was notsuccessfulin all cases,and hence,it was later modified by Spencer and Danner[21].The improved version was proved reliable in predicting the molarvolume of hydrocarbons,organic compounds,and inorganic compounds.The modification introduced by Spencer and Danner was mainly by replacing the compressibility factorZcwith a component specific compressibility factor ZRA.In this case,a reference experimental molarvolume(VSR)ata reference temperature(TR)is needed and Eq.(3)was rewritten as:

The value ofZRAis determined from:

This form of the Rackett model was very successful for predicting saturated molecular liquids molar volume data.For DES,experimental critical thermodynamic data are not available and hence they can be evaluated using group contribution methods[10].To improve the prediction capability of Eq.(5)when used for DES,the equation was modified by introducing two parameters(aandb)and Eq.(5)was written as:

The two parameters were evaluated by optimizing DES molar volume data against the model predictions and were set to a=16/7 andb=5/24[25].This new form resulted in a reduction of more than three folds in the absolute relative average deviation in molar volume as compared to the original Rackett model.
However,the model in Eq.(6)does not cater for the effect of molar composition of the DES which is an important parameter in the synthesis of DES.Altering the molar composition of the corresponding salt and HBD that makeup the DES results in considerable variation in the DES physical and thermodynamic properties.Hence,in this work,this contribution is added to Eq.(6)in the form of a quadratic polynomial with respect to salt molar fraction.Eq.(6)is rewritten in the form:

wherexrepresents the salt molar composition in the DES anda1toa5are model parameters.
3.Experimental Measurements of Molar Volume
Choline chloride(2-hydroxyethyl-trimethylammonium),and urea with purity(>98%)were supplied by Merck Chemicals(Darmstadt,Germany).These two chemicals were dried in a vacuum oven before use at a temperature of 353.15 K to eliminate moisture contamination.The DES synthesis was conducted as described in our previous work[2].Three different mole fractions of the ChCl:urea DES(known as reline)were prepared.A chemical sample description table is given in Table 1.
Experimental molar volumes were evaluated by measuring DES densities at different temperatures using a DMA4500 vibrating tube density/specific gravity meter(Anton Paar,Austria)at temperatures from 298.15 to 368.15 K with three replicates for each reading as described in Shahbazet al.[8].The average measurement standard uncertainty in density was 0.0025 g cm-3.All DES samples were prepared at atmospheric pressure and under tight control of moisture content and also kept in an airtight vials for storage in a moisture controlled desiccator.The water content of samples of the prepared DESs was measured by Karl Fisher titration method.The average measured moisture content was less than 0.05 wt%.
4.Results and Discussion
Atotalof 384 experimentalmolar volume data values,were used for developing the proposed model.These values were subdivided into two groups.A training set consisting of nine different DESs at different salt:HBD molar compositions with a total of 333 experimental molarvolume values.In addition,another set of four different DESs was regarded as the model validation set which consists of 50 mol·L–1volume data values.The acronyms,type of salt and HBD used and their molar composition are all given in Table 2.All experimental data were extracted from the literature.However,the data for DES10 was done in this work since the literature lacks the molar volume data for this DES at the three selected mole fractions.Measured density data for DES10 are reported in Table 3.

Table 1Chemical sample description table
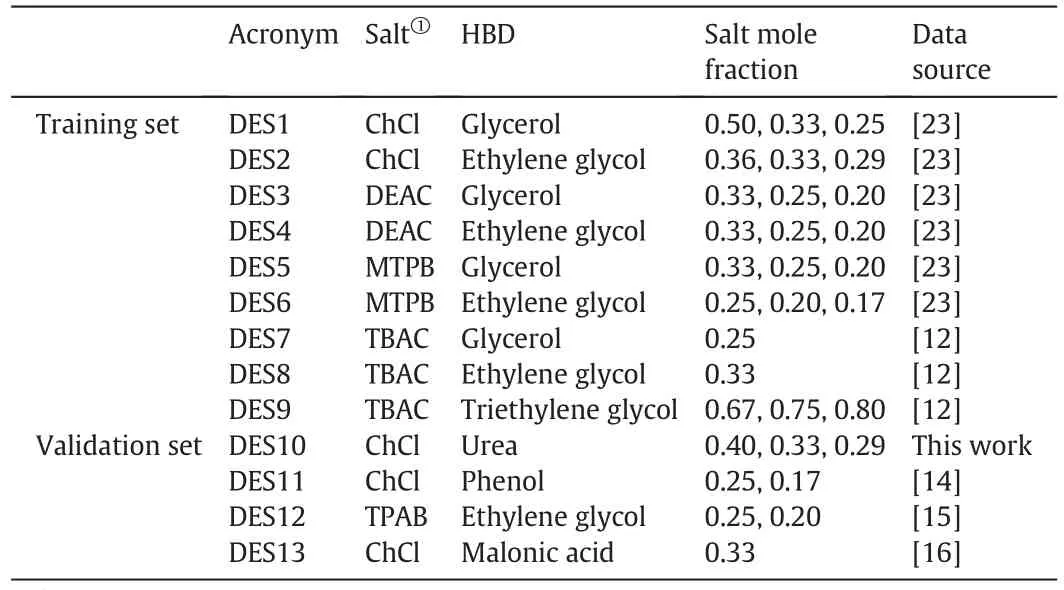
Table 2List of DESs used in this work with their acronyms,composition and sources
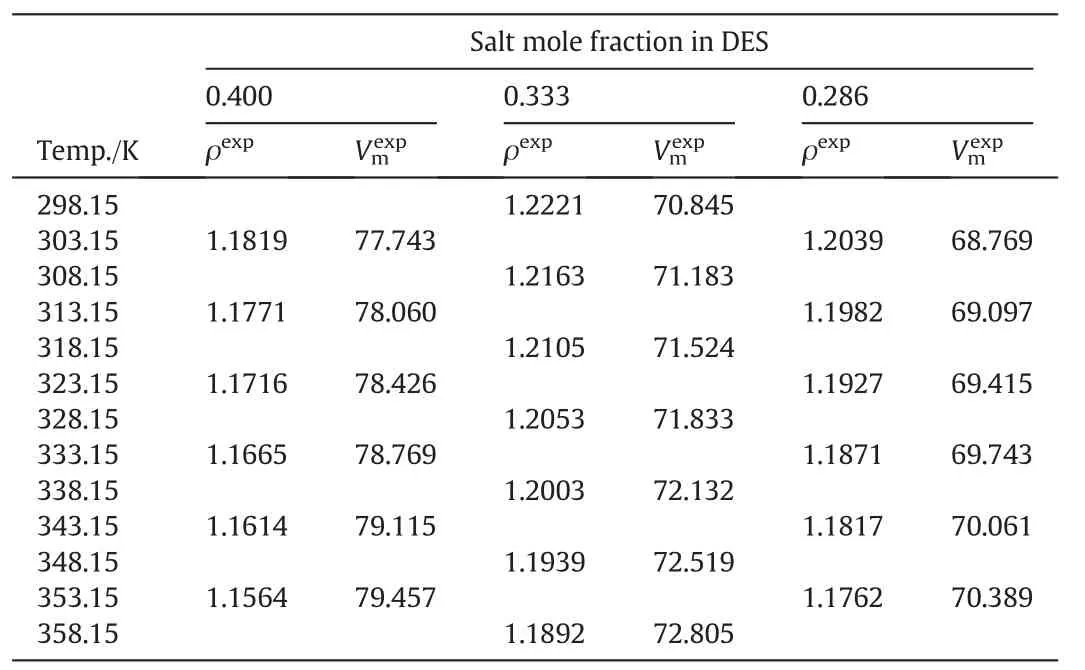
Table 3Measured density(g·cm-3)and corresponding molar volume(cm3·mol-1)data for DES10 at a pressure p=0.1 MPa①
Fig.1,shows a comparison between the measured density data of this work with those reported in the literature for the DES10–2(ChCl:urea,1:2).The density data generated by this work deviates by an average of 1.41%from those reported by Yadav and Pandey[16]and Liron and Li[29].This may be due to the method of preparing the DES.In both reported works,the DES was purchased from Scionix Ltd.and used as received.In contrast,the DES used in the current work was prepared from its ingredients(ChCl and urea)after drying in the oven.Considering this DES in particular,comparison with literature data has been reported previously[28].Shah and Mjalli compared the density data of the DES10–2 systemwith others and the differences have been observed.

Fig.1.Comparison of this work density data to literature data.
The value of DES molar volume depends on the nature of its constituting components,their mole fractions and temperature.The experimental molar volumes of the DESs studied in this work are shown graphically as symbols in Fig.2.Values of molar volume occupied a wide range starting from 72 cm3·mol-1to 264 cm3·mol-1.DES9 attained the highest molar volume among all studied DESs(232–264 cm3·mol-1).DES2 and DES4 have the lowest molar volume values(72–84 cm3·mol-1)and DES5 and DES7 attained mid-range values(113–139 cm3·mol-1).It is also noticed that the DESs containing same salt result in higher molar volumes when glycerol is used as HBD compared to ethylene glycol-based DESs.This can be attributed to the difference in molecular weight of the two HBD(92.01 for glycerol and 62.07 for ethylene glycol).For example,considering the ChCl,DEAC,MTPB and TBAC salts,the glycerol based DESs have molecular mass of(107.917,112.589,158.373,149.660)resulting in molar volumes of(90.53,95.98,122.05,136.63)at the same reference temperature.However,using the same salts and mole fractions,the ethylene based DESs have molar mass of(87.894,92.566,135.858,129.255)with a corresponding molar volumes of(78.65,84.19,108.68,102.68)respectively.This effect of molar mass on the molar volume can also be seen for all studied DES.Fig.3,shows graphically the experimental molar volume and molecular weights of all studied DESs.It can be seen that the trends and to some extent the values of the DESs molar volumes have the same order as that of the corresponding molar volume.
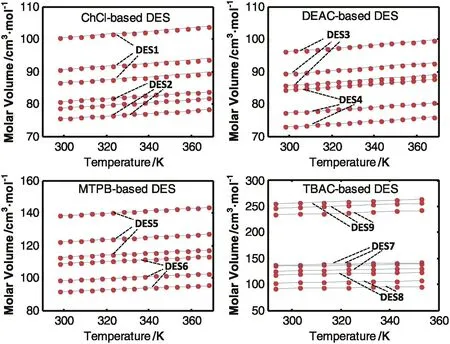
Fig.2.Experimental and proposed density model predictions of the used DESs.
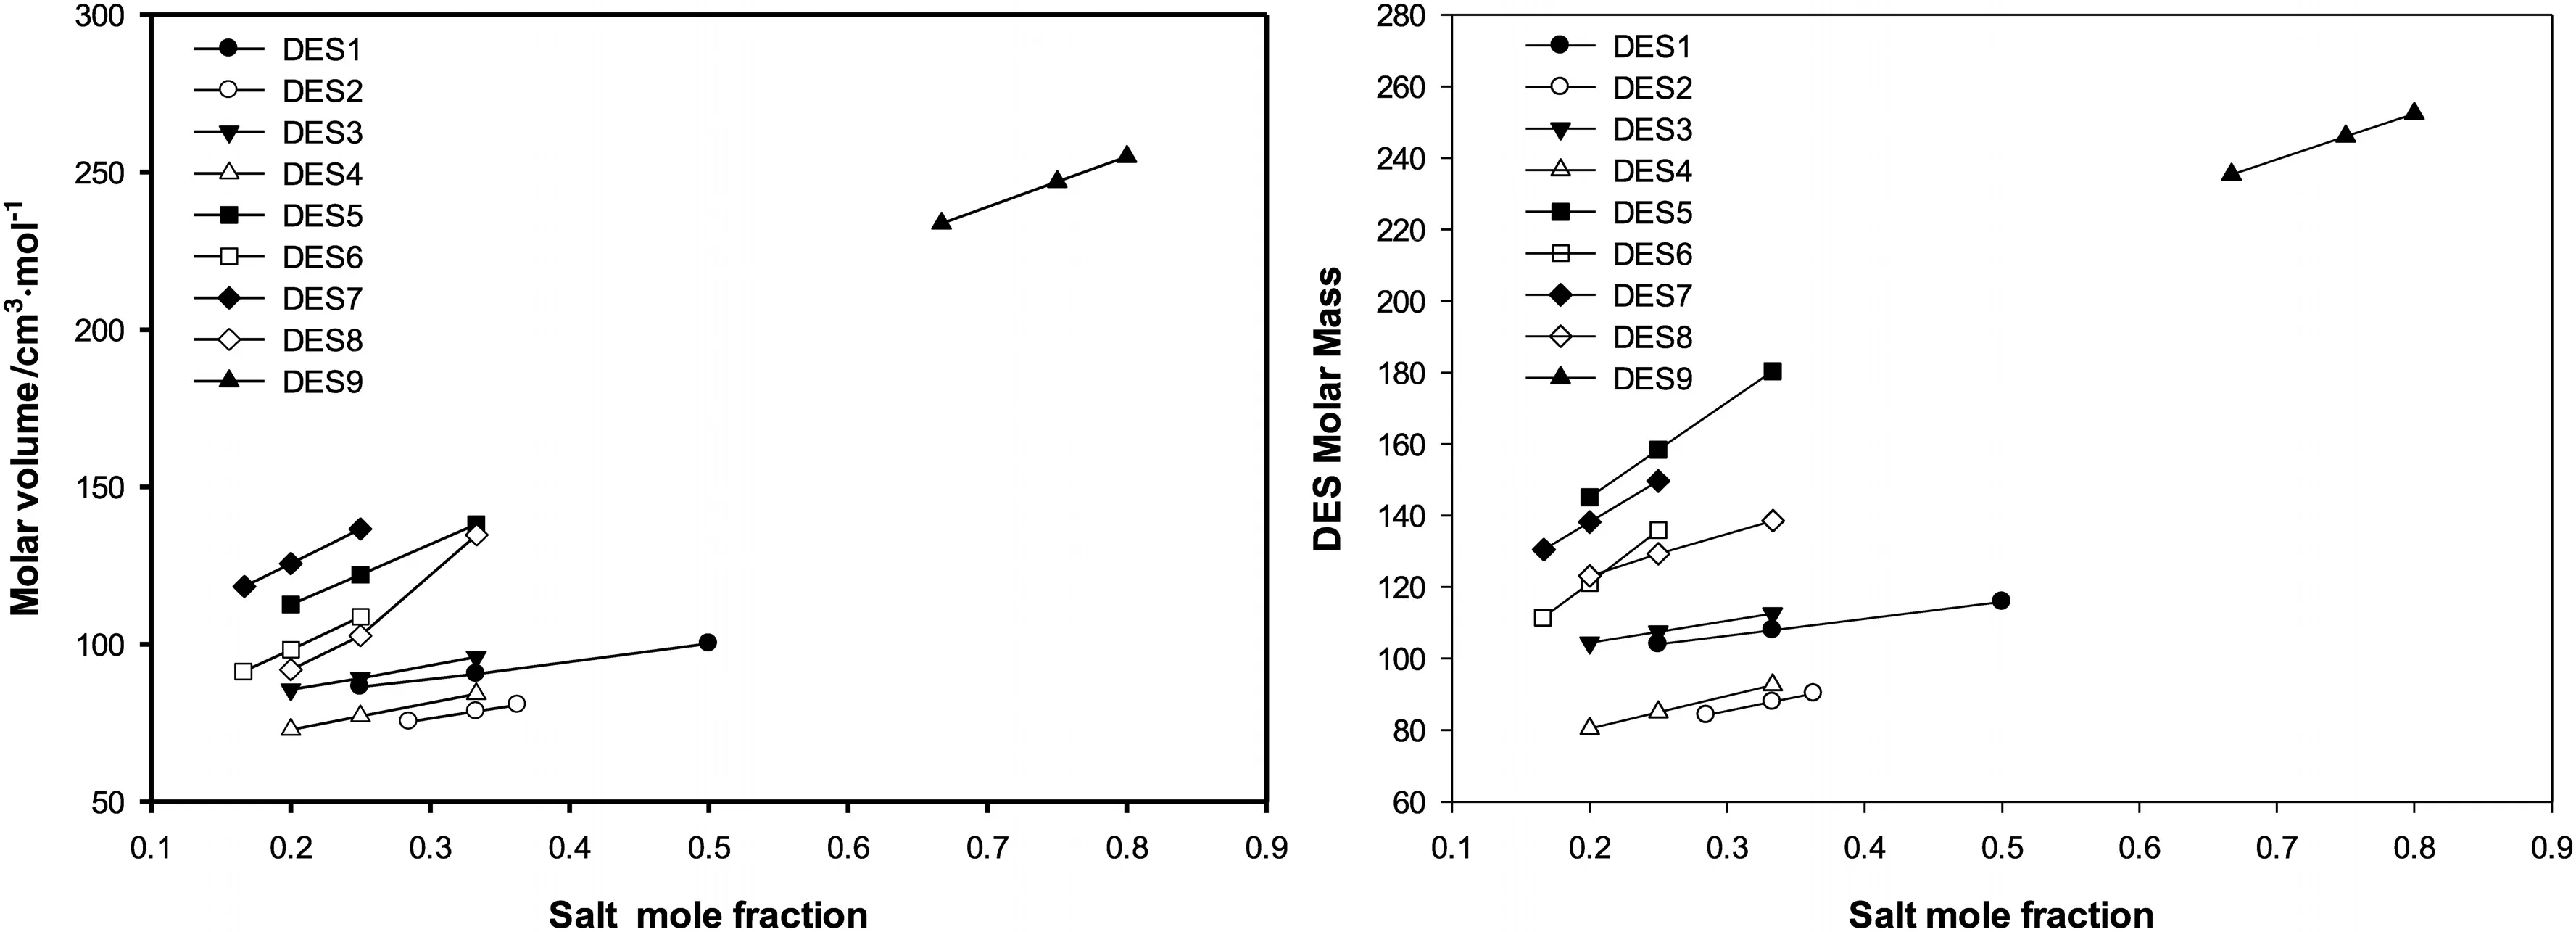
Fig.3.The experimental molar volume and molecular weights of the studied DES at the reference temperature.
As expected,temperature has a direct positive effect on the values of molar volumes.The increase of temperature results in increasing molecular kinetic energy,which allows molecules to travel farther apart from each other increasing the molar volume of the DES.All studied DESs showed similar monotonic increasing trends with increasing salt content in the DES structure.In the same figure,the molar volumes and the molecular mass of the DESs show similar approximate trends.This indicates that the increase in the molar composition results in increasing the molar mass of the DES and consequently,the volume occupied by the molecules increases which results in increasing the DES molar volume.This highlights the importance of considering the molar composition of the DES in predicting the molar volume.
The critical properties data namely;temperature,volume and pressure for all studied DESs were estimated using the modified Lydersen–Joback–Reid group contribution method[26]whereas the acentric factor was calculated based on the method of Valderrama and Robles[27].In the calculation,the critical properties of each DES salt and HBD were calculated separately,then the Lee–Kesler mixing rules equations recommended by Knappet al.were utilized to calculate the critical properties of the corresponding DES[10].Table 4 lists the calculated critical properties used in this work.
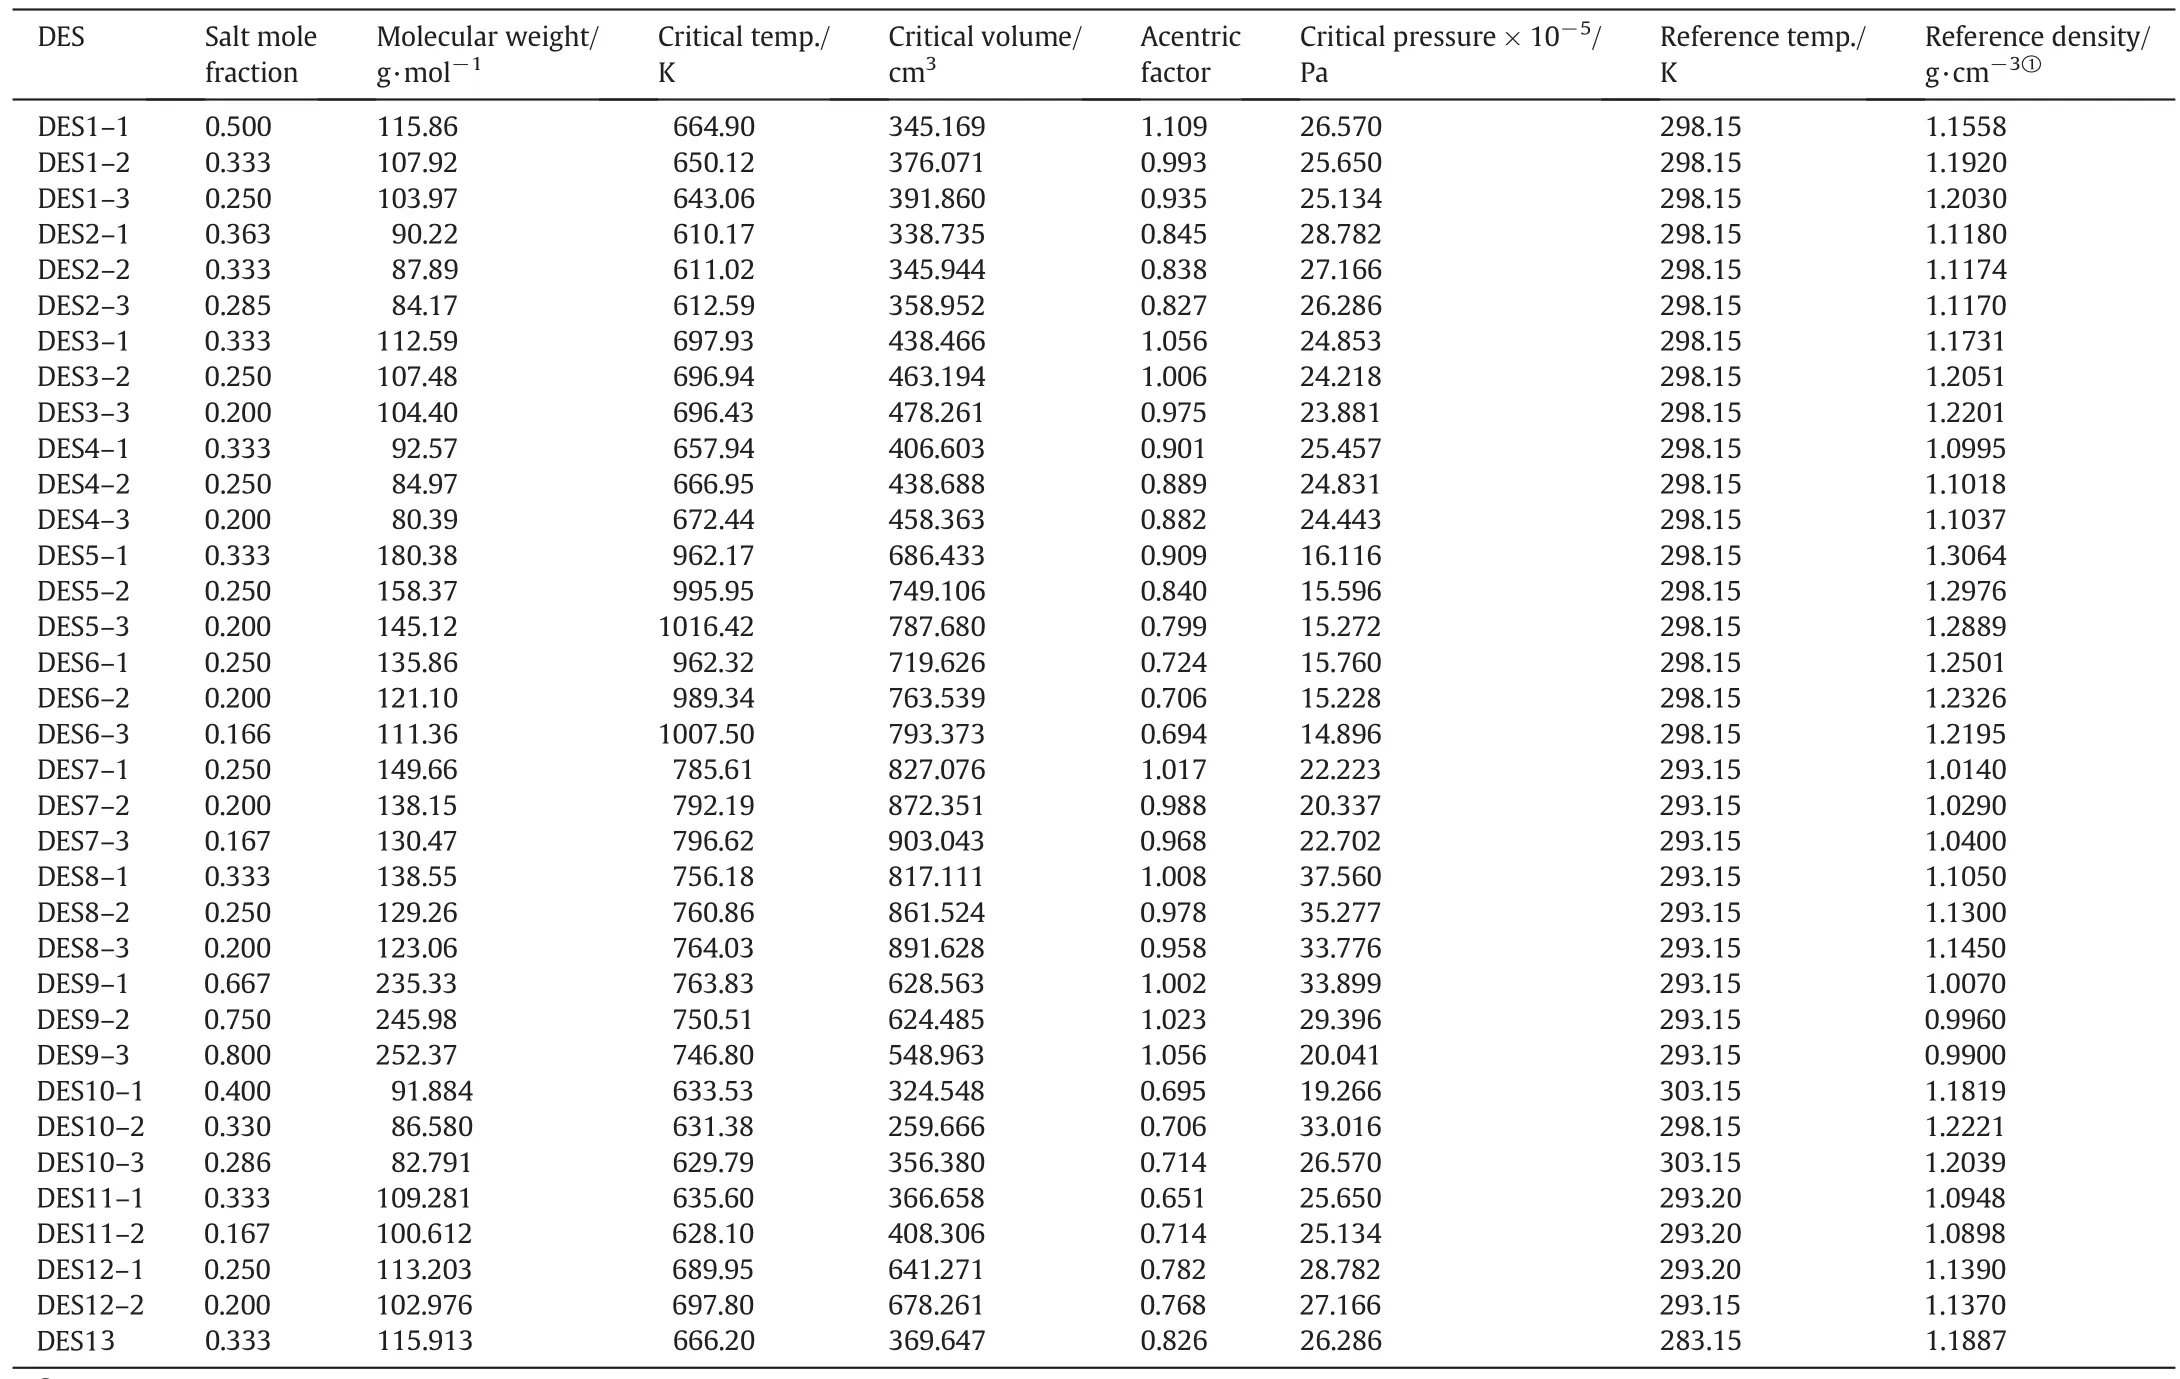
Table 4Critical properties of the DES systems used in this work
The experimental data of the training set of DESs composed of the first nine DESs in Table 2,were used in combination with an optimization algorithm to regress the proposed model of Eqs.(7)and(8).
To check the predictive capability of the proposed model,the Average Relative Deviation(ARD)was calculated as:

The proposed molar volume model for the studied DES was estimated by consolidating the model predictions with the experimentally measured molar volume data.This is done by minimizing an objective function of the form:

The finally optimized model parameters were calculated as follows:a1=0.8604,a2=0.3330,a3=-0.6124,a4=0.0840 and a5=3.8482
For the sake of simplifying the use of the model without sacrificing its prediction efficiency,the five model parameters were converted to equivalent fractional representations.Hence,these parameters are represented as:

The molar volume model of Eqs.(7)and(8),can then be written as:

The optimization algorithm reached an optimum solution with an average ARD of around 0.1,a coefficient of determinate of 0.998 and a t-test p-value of 0.994.This indicates the high degree of goodness of fit.In addition,the p-value>significance level,indicates insignificant differences between the reference experimental DESs molar volume measurements and those obtained from model predictions.
Fig.4 shows a graphical representation of the percentage average deviation between the experimental and model predicted molar volumes as a function of temperature.In general,model predictions are better at lower temperatures.The MTPB-based DES attained the highest accuracy with lowest ARD values(ARD=0.035),the prediction of the ChCl-based DESs molar volume were the least(ARD=0.148).Values of ARD and t-test p-values of the model predictions are also given in Table 5.

Fig.4.Comparison of DES density estimation deviations from experimental data using the new model.
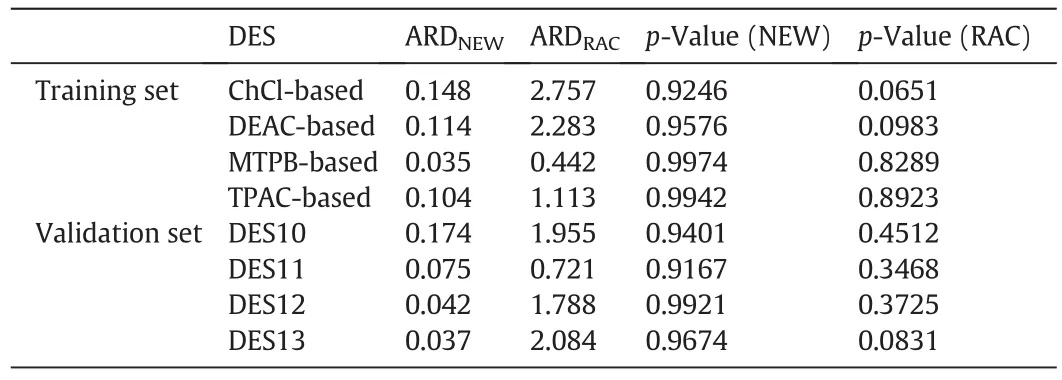
Table 5Average relative deviations(ARD)and t-test p-values for the molar volume new(NEW)and the conventional Rackett(RAC)model predictions

Fig.5.Experimental and the Rackett density model predictions used DESs.
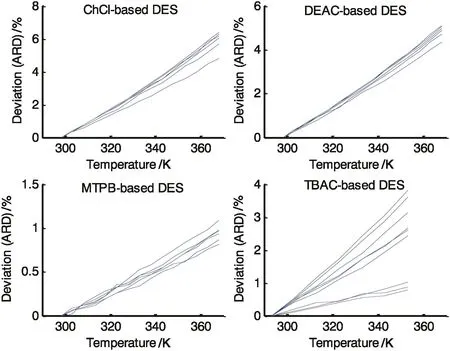
Fig.6.Comparison of DES density estimation deviations from experimental data using the Rackett model.
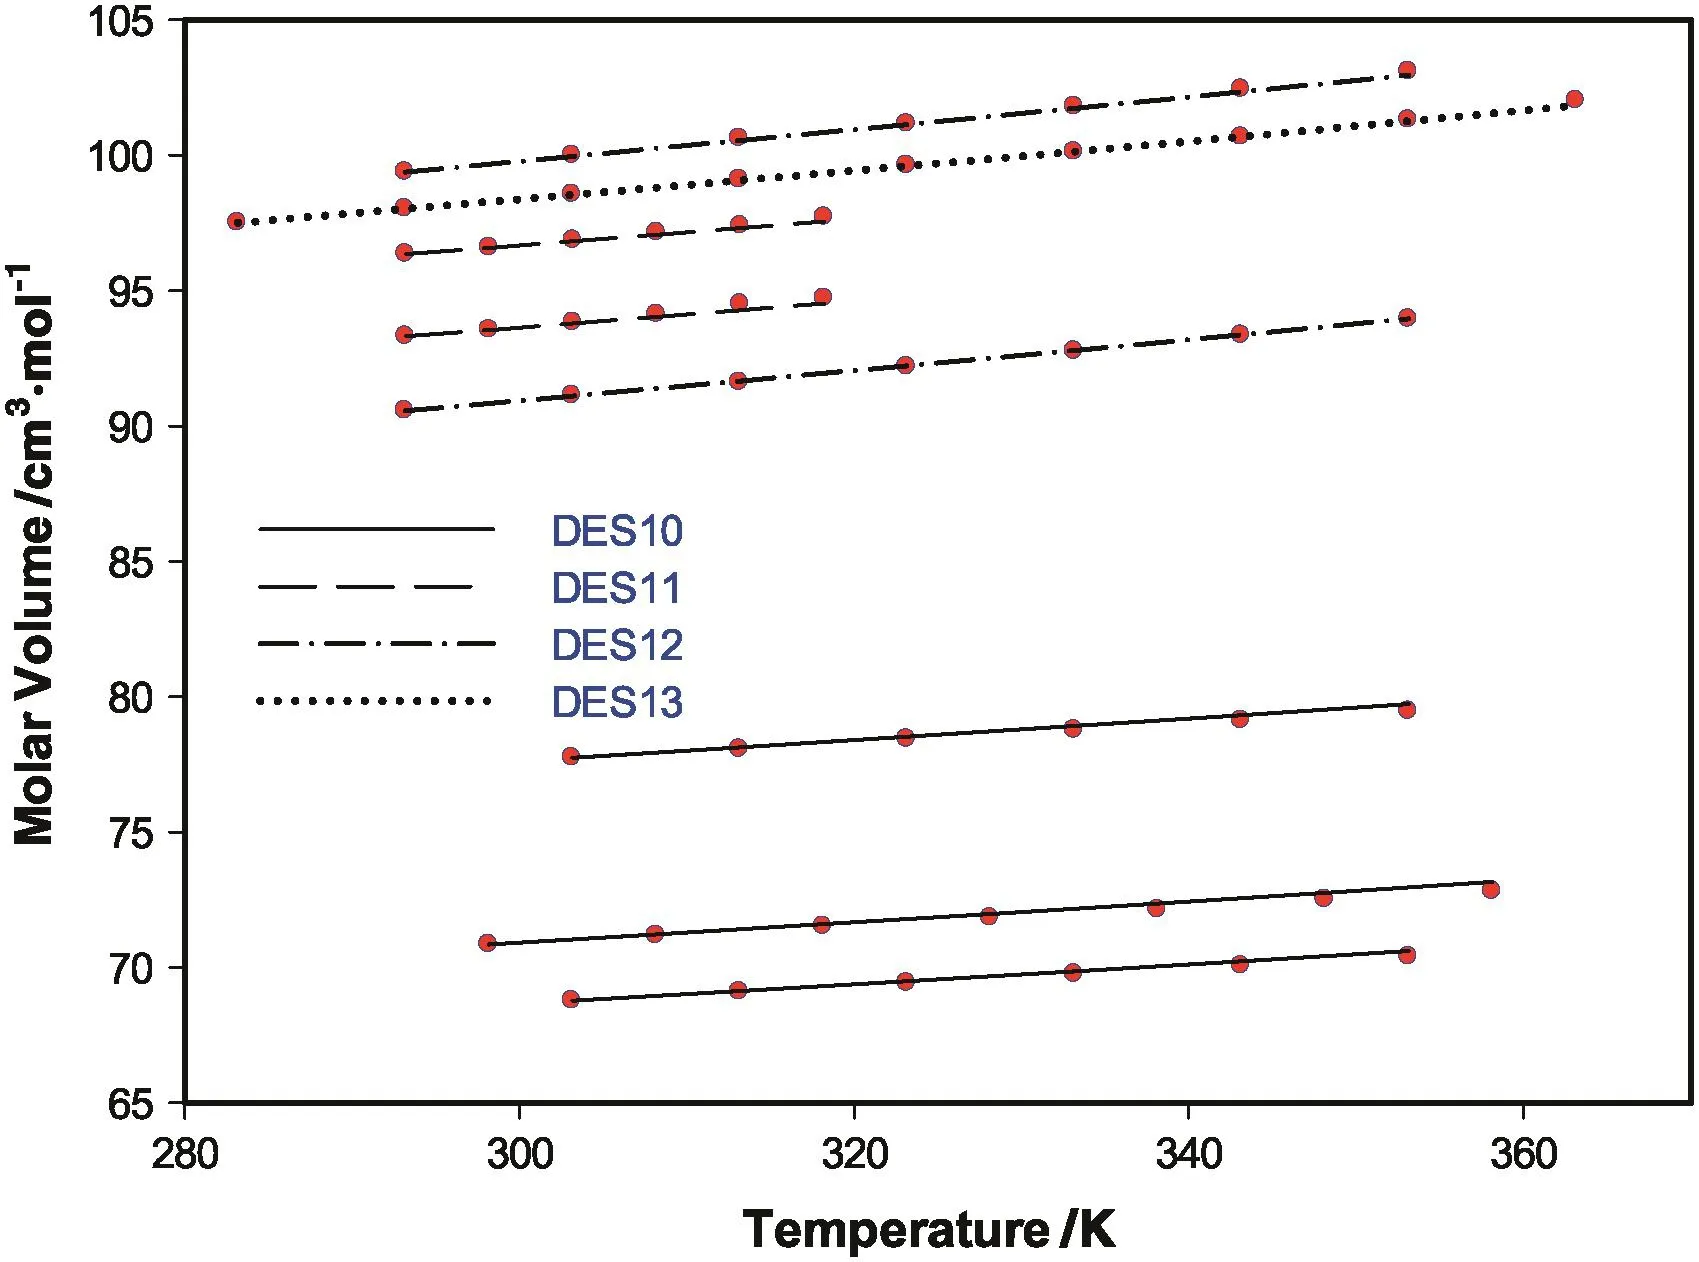
Fig.7.New model molar volume predictions for the validation set of DES.
To benchmark the proposed model performance,its performance was compared to the well-known Rackett model.The calculated critical properties were utilized in the Rackett model of Eq.(5)to predictmolar volumes and the predictions are shown in Fig.5.Overall,the Rackett model gave worse predictions than that of the proposed model.This is especially clear for the ChCl and DEAC-based DESs.For these two systems the ARD reached 2.757 and 2.283 respectively.Table 5 gives a summary of the predictions deviations.The molar volume of both training and validation DES sets were predicted with an average ARD of 1.648 and 1.626,respectively.The worse prediction of the Rackett model was that for DES13 which attained at-testp-value of 0.0831 which is very close to the significance limit of 0.05.Looking at the graphical representation of the ARD in Fig.6,we notice the monotonic increase as temperature increases.Although the Rackett model predictions are acceptable at the lower temperature range,however,its accuracy deteriorates rapidly and reaches an ARD of 6.142 for the case of the ChCl-based DES.
Fig.7,shows the model predictions for the four DESs used in the validations set.Surprisingly,the model predictions for the validation DES set were even better than that of the training set.The ARD of the model for the validation set was 0.085.This high degree of prediction for DESs that were not part of the model optimization procedure give high confidence in using the model for other DESs not studied in this work.
Fig.8 statistically summarizes the performance of the two models predictions as compared to the experimental molar volume data.This is depicted as a grouped box plots for the four different types of DESs used.In each one of the four grouped box plots,the first box represents the experimental values while the second and third represent the proposed and Rackett model predictions.The first two boxes are almost identical in terms of size,median,and quartiles.While the third box representing the Rackett model predictions is noticeably different indicating its inferiority relative to the proposed model.
5.Conclusions
The effect of DES composition has a pronounce effect on its general characteristics and physical and thermodynamic properties.In this work,the effect of molar composition of DES in the form of salt molar fraction is incorporated in the well-known Rackett molar volume model.The improved model predicts the DES molar volume as a function of calculated hypothetical DES critical data based on a group contribution method.
A set of 13 DES systems of type III DES involving four common quaternary ammonium and phosphonium salts was used to calculate the model parameters using an evolutionary optimization algorithm.Experimental data of molar volume for these DESs were collected from the literature in addition to one system(ChCl:urea)measured in this work.Nine of the DES considered were used for optimizing model parameters and four others for validating its performance.The new model prediction performance was consolidated with experimental data and compared to the conventional Rackett model predictions.
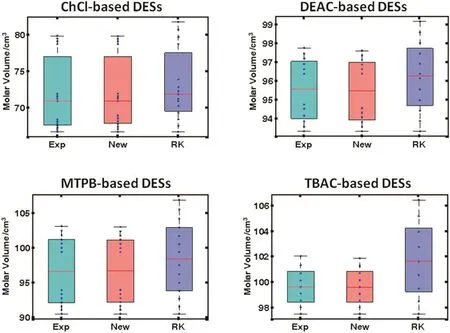
Fig.8.Grouped box plot for the experimental and predicted molar volume data(New:new model,RK:Rackett model).
In general,the improved model performance surpassed the conventional one for both training and validation sets.An average relative percentage deviation of around 0.1%was attained for these sets.This means that the prediction performance of the new model is more than ten folds better compared to that of the Rackett model.Additionally,the Rackett model accuracy depends on the distance of the considered temperature away from the used reference temperature.As this difference gets larger,the prediction discrepancy becomes larger.This is in contrast to the new model,which attained a smaller and more consistent deviation as the temperature is increased.
Incorporating the effect of DES molar composition in the molar volume model enables the better prediction of this property.In addition,the DES molar volume at other not reported molar compositions can be predicted which enables using the model in related design and simulation studies.
[1]B.Tang,K.H.Row,Recent developments in deep eutectic solvents in chemical sciences,Monatsh.Chem.144(2013)1427–1454.
[2]F.S.Mjalli,J.Naser,B.Jibril,S.Al-Hatmi,Z.S.Gano,Ionic liquids analogues based on potassium carbonate,Thermochim.Acta575(2014)135–143.
[3]R.Yusof,E.Abdulmalek,K.Sirat,M.B.Abdul Rahman,Tetrabutylammonium bromide(TBABr)-based deep eutectic solvents(DESs)and their physical properties,Molecules19(2014)8011–8026.
[4]A.P.Abbott,D.Boothby,G.Capper,D.L.Davies,R.K.Rasheed,Deep eutectic solvents formed between choline chloride and carboxylic acids:Versatile alternatives to ionic liquids,J.Am.Chem.Soc.126(2004)9142–9147.
[5]R.C.Harris,Physical properties of alcohol based deep eutectic solvents(PhD Thesis)University of Leicester,Leicester,UK,August 2008.
[6]R.C.Reid,J.M.Prausnitz,B.E.Poling,The properties of gases and liquids,fourth ed.McGraw-Hill,New York,1987.
[7]J.Jacquemin,G.Rile,P.Nancarrow,D.W.Rooney,F.Margarida,A.H.P.Agilio,C.Hardacre,Prediction of ionic liquid properties.I.Volumetric properties as a function of temperature at 0.1 MPa,J.Chem.Eng.Data53(2008)716–726.
[8]K.Shahbaz,S.Ghareh Bagh,F.S.Mjalli,I.M.AlNashef,M.A.Hashim,Prediction of refractive index and density of deep eutectic solvents using atomic contributions,Fluid Phase Equilib.354(2013)304–311.
[9]F.S.Mjalli,V.Gholamreza,K.Shahbazb,I.M.AlNashef,Application of the Eötvos and Guggenheim empirical rules for predicting the density and surface tension of ionic liquids analogues,Thermochim.Acta575(2014)40–44.
[10]K.Shahbaz,F.S.Mjalli,I.M.AlNashef,M.A.Hashim,Prediction of deep eutectic solvents densities at different temperatures,Thermochim.Acta515(2011)67–72.
[11]K.Shahbaz,F.S.Mjalli,I.M.AlNashef,M.A.Hashim,Prediction of the surface tension of deep eutectic solvents,Fluid Phase Equilib.319(2012)48–54.
[12]F.S.Mjalli,J.Naser,B.Jibril,V.Alizadeh,Z.S.Gano,Tetrabutylammonium chloride based ionic liquid analogues and their physical properties,J.Chem.Eng.Data59(2014)2242–2251.
[13]F.S.Mjalli,N.M.A.Jabbar,Acoustic investigation of choline chloride based ionic liquids analogues,Fluid Phase Equilib.381(2014)71–76.
[14]G.W.Guo,Y.Hou,S.Ren,W.Wu,Formation of deep eutectic solvents by phenols and choline chloride and their physical properties,J.Chem.Eng.Data58(2013)866–872.
[15]B.Jibril,F.S.Mjalli,J.Naser,Z.S.Gano,New tetrapropylammonium bromide based deep eutectic solvents:Synthesis and characterizations,J.Mol.Liq.199(2014)462–469.
[16]A.Yadav,J.R.Kar,M.Verma,S.Naqvi,S.Pandey,Densities of aqueous mixtures of(choline chloride+ethylene glycol)and(choline chloride+malonic acid)deep eutectic solvents in the temperature range 283.15–363.15 K,Thermochim.Acta600(2015)95–101.
[17]N.Roshan,S.Ghader,Developing models for correlating ionic liquids density:Part 1 Density at 0.1 MPa,Fluid Phase Equilib.331(2012)33–47.
[18]C.Ye,J.M.Shreeve,Rapid and accurate estimation of densities of room temperature ionic liquids and salts,J.Phys.Chem.A111(2007)1456–1461.
[19]R.L.Gardas,J.A.P.Coutinho,Extension of the Ye and Shreeve group contribution method for density estimation of ionic liquids in a wide range of temperatures and pressures,Fluid Phase Equilib.263(2008)26–32.
[20]H.G.Rackett,Equation of state for saturated liquids,J.Chem.Eng.Data15(1970)514–517.
[21]C.F.Spencer,R.P.Danner,Improved equation for prediction of saturated liquid density,J.Chem.Eng.Data17(1972)236–241.
[22]J.O.Valderrama,W.S.Wilson,A.L.Juan,Critical properties,normal boiling temoratures and acentric factor of 200 ionic liquids,Ind.Eng.Chem.Res.47(2008)1318–1330.
[23]K.Shahbaz,S.Baroutian,F.S.Mjalli,M.A.Hashim,I.M.AlNashef,Densities of ammonium and phosphonium based deep eutectic solvents:Prediction using artificial intelligence and group contribution techniques,Thermochim.Acta527(2012)59–66.
[24]F.S.Mjalli,Mass connectivity index-based density prediction of deep eutectic solvents,Fluid Phase Equilib.409(2016)312–317.
[25]F.S.Mjalli,K.Shahbaz,I.M.AlNashef,Modified Rackett equation for modelling the molar volume of deep eutectic solvents,Thermochim.Acta614(2015)185–190.
[26]V.H.Alvarez,J.O.Valderrama,A modified Lydersen–Joback–Reid method to estimate the critical properties of biomolecules,Alimentaria254(2004)55–66.
[27]J.O.Valderrama,P.A.Robles,Critical properties,normal boiling temperatures and acentric factor of fifty ionic liquids,Ind.Eng.Chem.Res.46(2007)1338–1344.
[28]D.Shah,F.S.Mjalli,Effect of water on the thermo-physical properties of Reline:An experimental and molecular simulation based approach,Phys.Chem.Chem.Phys.16(2014)23900–23907.
[29]R.B.Leron,M.-H.Li,High-pressure density measurements for choline chloride:Urea deep eutectic solvent and its aqueous mixtures atT=298.15 K to 323.15 K and up to 50 MPa,J.Chem.Thermodyn.54(2012)293–301.
 Chinese Journal of Chemical Engineering2016年12期
- Chinese Journal of Chemical Engineering的其它文章
- Hemicellulose in corn straw:Extracted fromalkali solution and produced 5-hydroxymethyl furfural in HCOOH/HCOONa buffer solution☆
- Investigation on molar heat capacity,standard molar enthalpy of combustion for guaiacol and acetyl guaiacol ester
- Statistical mechanics and artificial intelligence to model the thermodynamic properties of pure and mixture of ionic liquids☆
- A comprehensive fractal char combustion model☆
- Development of a bifurcation analysis approach based on gPROMS platform☆
- Catalytic kinetics of dimethyl ether one-step synthesis over CeO2–CaO–Pd/HZSM-5 catalyst in sulfur-containing syngas process☆
