Modeling and experimental studies of methyl methacrylate polymerization in a tubular reactor☆
Mohamad-Taghi Rostami*,Ali Daneshgar
Department of Engineering,Mohaghegh Ardabili University,Daneshgah Street,Ardabil,Iran
1.Introduction
Tubular reactors are often used in processes of large scales in chemical industries as they are easy to maintain and have higher rate of converting raw materials in reactors' volume unit in grade n reactions than other reactors of continuous systems[1].Polymerization reactions are one of the most central reactions occurring in these reactors.In these types of reactions,monomers are inserted into the reactors with a predetermined concentration.After the residence time span,these monomers are emitted as a mixture of polymers and residues of monomers.One of the most important reactions of this type is the polymerization of methyl methacrylate which results in producing Polymethyl methacrylate,one of the most commonly used industrial polymers[2].
In tubular reactors,many measures and values affect the conversion rate.The type of fluid flow and velocity profile of substances in the reactor are one of the most central measures[3,4].Rheological models can be employed to study the velocity distribution and the behavior of fluids;Power Law Model is one of the most commonly used models.The n value( flow behavior index)is one of the mostessential and effective outputs of velocity profile equation of Power Law Model.As this value changes in the laminar flow,the velocity profile is also modified and as a result,the products yielded have different conversion[5].
Many experimental studies of the polymerization of methylmethacrylate and the modeling of tubular reactors have been conducted formerly[3,6–11].Looking through these studies,it has been indicated that the flow has been usually considered uniform-like plug-in the former set of researches.Orin the other studies,that the Power Law Model has been employed to examine the viscosity,the values n and k have been kept constant.As far as the hypotheses of previous experiments are considered to be the deficiencies of modeling,evaluating and calculating the mixture's velocity profile through rheological models with different values and attaining such a profile within different lengths of a reactor are of high value.Thus,the above-mentioned procedure increases the precision of mass balance calculations and modeling.
In this study,at the outset it has been studied the plug and mixed patterns and their conversion rates.The pattern of fluid flow is then assumed to be the laminar flow.Through rheological examination of the reactor's mixture using a rheometer,the n value of the Power Law Model has been attained at different sections of the selected reactor.Using these numerical data,modeling has been carried out and conversion rate has been calculated.Moreover,the functions of the reactor have been compared in three modes of plug,mixed and laminar flow.As a final point,the precision of the modeling has been evaluated through comparing the conversion rate of the modeling and its laboratorial corresponding quantity.
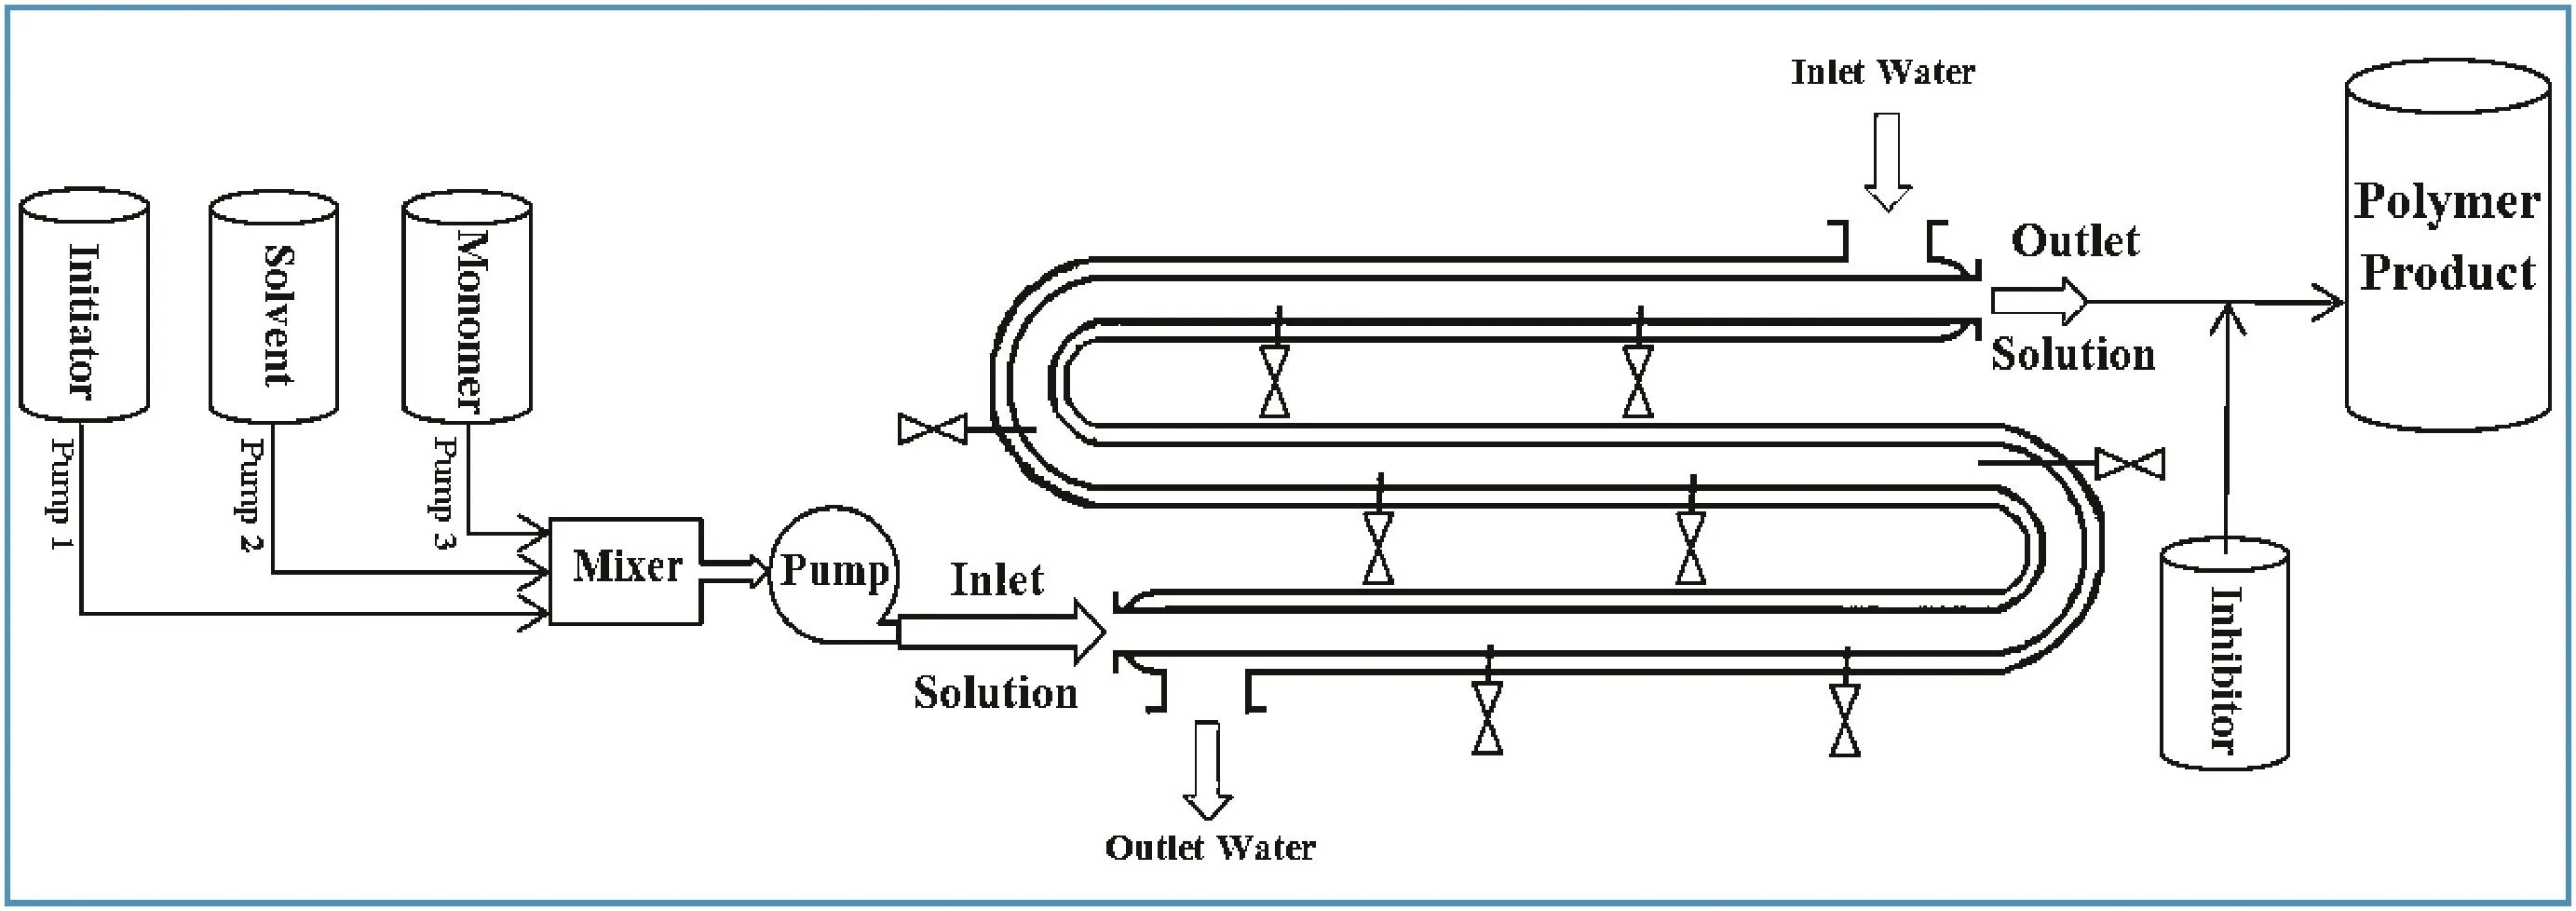
Fig.1.The pilot-plant tubular reactor.
2.Experimental
2.1.Materials and equipment
The pilot-plant polymerization reactor is shown in Fig.1.The reactor tube has an inside diameter of 32 mm and a total length of 5.4 m.The tube is entirely made from 316 stainless steel.The reactor tube is jacketed by water to control the temperature of the reactor.The reactor pressure can be controlled using a pressure control valve.The reactor additionally has eight sampling points that are located along the tubular reactor at lengths 0.6,1.2,1.8,2.4,3,3.6,4.2,and 4.8 m.The following reagents were used in the experiments:MMA(99%,supplied by Lancaster Ltd.,UK),xylene(99%,supplied by Fisher Scientific UK),and BPO(97%,supplied by Merck Germany).The MMA was stabilized with hydroquinone as inhibitor.All the materials were used without further purification,which conforms to typical industrial practice.
2.2.Pilot-scale polymerization studies
Operating conditions used in the polymerization experiment is summarized in Table 1.Before being fed to the reactor,BPO/xylene solution and MMA were degassed separately by purging the liquids with Argon for 12 h.Initially,the reactor contained pure xylene at a temperature of 70°C,thus depicting a typical start-up situation.The reaction was initiated by the continuous flow of MMA,xylene and BPO into the reactor,which was considered as time zero of the polymerization experiment.The flow rate from each pump was set to achieve the desired reactant concentration.For running the experiment,the reaction was conducted over 3 h with the temperature maintained at70°C.During the polymerization,aliquots were taken from the eight sample ports along the reactor length every 20 min.Samples were quenched in a solution of cold xylene and inhibitor,and precipitated by adding an excess methanol.Monomer conversion was thus determined by the direct gravimetric method.
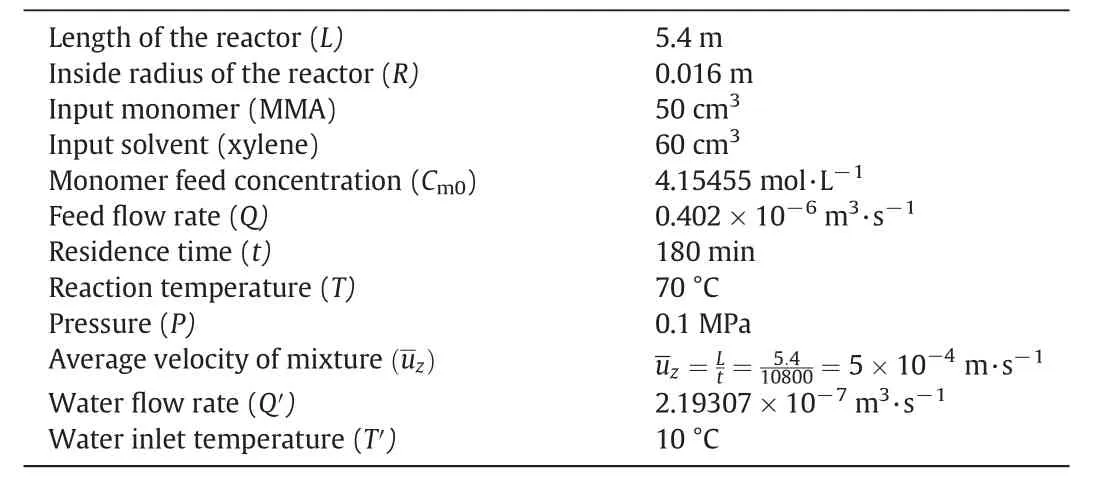
Table 1Operation conditions of the reactor
Precipitation of the polymer was achieved through the drop-wise addition of the stored polymer mixture to a stirred mixture of 10 times its volume of methanol.The precipitate was filtered(Whatman,Grade 1)and finally dried in a vacuum oven at 100°C until constant weight.From the weight of the dry polymer the conversion was determined gravimetrically based on the initial concentration of the polymerization mixture.The experimental results for conversion are shown in Table 2.

Table 2The experimental results of axial conversion in laminar flow
2.3.The rheological analysis of the reactor's content mixture
In order to analyze the mixture contained in the reactor,the Physica MCR 301 rheometer is used.This rheometer has two plates which are 25 mm in diameter and parallel to each other.The lower plate-which is fixed-is designed for placing the sample in and the upper plate which is moveable-for shear stress procedures.The inner temperature of the chamber in the rheometer is kept constant at 70 °C(±0.1 °C)using a compressor.In order to draw the flow curve,a thin layer of the sample is placed on the fixed plate while the moveable plate moves toward the fixed one and is set by 0.8 mm distance from the lower plate.A schematic illustration of the rheometer is presented in Fig.2.
In this experiment,the flow curve is drawn within an extensive shear rate ranging from 0.1 to 100 s-1.It is worth taking into consideration that no phase transition has occurred in the rheometer and the flow curve measurements have been carried out three times.

Fig.2.Plates of rheometer Physica MCR 301.
3.Model Developments
3.1.Kinetic and reaction rate of MMA polymerization
The polymerization of methyl methacrylate has been described making references to two articles by Baillagou and Soong and Pinto and Ray[12,13].In which the free radical mechanism has been employed in the process of polymerization.The reactions involved in the free radical mechanism of methyl methacrylate's polymerization are illustrated in Table 3.

Table 3Free radical MMA polymerization mechanism
In the equations,I,˙I,Pn,Dn,M,S,Z,and fzdenote Initiator molecule,Primary free radical molecule,Free radicals(live polymer)molecule of lengthn,Dead polymer molecule of lengthn,monomer molecule,solvent molecule,inhibitor molecule,and inhibitor molecule which ended to free radical,respectively[14].
It is worth pointing out that the 0th moment of living polymer is calculated through the following equation[7]:

where,in the above equation,f,kd,[I],and kt0denote initiator efficiency coefficient,kinetic constant for initiator decomposition,initiator concentration,and initial kinetic constant for termination,respectively.
The initiator efficiency coefficient(f)indicates a fraction of initial free radicals involved in the initial polymerization.In this experiment,Benzoyl Peroxide(BPO)has been used as the initiator with an efficiency rate of one[15].
According to the above-mentioned mechanism,the kinetic and the rate are calculated through the following equation[10]:

The rate constants of the model are listed in Table 4.

Table 4Kinetic rate constants and constitutive equations[12,13,16–18]
The equation is finally obtained through calculating the constant values and using these quantities in the equation:

3.2.Model formulation
The volume of the mixture can be considered to be constant(ε=0).Accordingly,different reactors of the same volume have the same residence time as well(= τp= τm).
3.2.1.Plug fl ow reactor model
The mass balance of this mode is inscribed as follows[19]:

With substitute the reaction rate quantities in Eq.(4),the following equation is obtained:

Using integration and simplification,the following equation is obtained:

As it is formerly mentioned,the residence time is the ratio of the distance to the velocitySo the above-mentioned equation is modified as the one below:

The output monomer concentration of the reactor is determined by substituting the residence time and input monomer concentration in the equation:

The conversion of the plug mode is accordingly determined as follows:

In these lines,the concentration and conversion can be also determined for different sections(different lengths of the reactor).
3.2.2.Mixed flow reactor model
For a mixed flow reactor within a constant volume,the concentration,the reaction rate and the residence time are related as follows[20]:

With substitute the reaction rate quantities in Eq.(10),the following equation is obtained:

The output monomer concentration of the reactor is determined by substituting the residence time and input monomer concentration in the equation:

The conversion of the mixed mode is accordingly determined asXm=47.44.
In these lines,the concentration and conversion can be also determined for different sections(different lengths of the reactor).
3.2.3.Laminar fl ow reactor model
Considering the following hypotheses,the mass balance is calculated:
·The flow is two-dimensional and axial symmetric
·The reaction conditions are stable and the flow is steady state(S.S)
·Mixture is non-slip condition at the walls of the reactor
·Although the reaction is exothermic,the inner temperature of the reactor is kept constant as the flow of water runs through the reactor's jacket
·The radial velocity is negligible
·The mixture contained in the reactor is non-Newtonian and in accordance with the Power Law Model.
The mass balance of this mode is inscribed as follows[21]:
Multiplying the termby the above-mentioned equation,the fol
lowing equation is obtained:
In this equation,Ddenotes the axial dispersion coefficient.In order to determine the quantity of this coefficient for polymeric mixture in a tube through a laminar flow,many processes have been carried out with the span of alterations ranging from 10-6to 10-11m2·s-1[22–24].In the model studied in this paper,this coefficient is ranging from 10-8to 10-9m2·s-1which is finally estimated to be 1.532 × 10⁻⁹m2·s-1[25].
Regarding the termsome experiments have been performed.The results are as follows[26]:
(1)If we consider the condition<3×10⁻³,the diffusion term which is in the radius direction can be neglected.
(2)If we consider the condition>3×10⁻³,the diffusion term which is in the radius direction cannot be neglected.
Considering the ratioin the reactor discussed,the radius diffusion cannot be neglected.In this situation,the diffusion term can be simplified and neglected at the axial direction through eliminating the dimensions of the equation at radial and linear directions by changing the variables intoandPerforming this process,Eq.(14)would be as follows:

Considering the negligible quantity of(R/L)2ratio,the abovementioned equation can be simplified as follows:

Below,the mass balances equation is presented by changing the former variables into their previous quantities:

The boundary conditions for solving this differential equation are listed below:
(1)The reactor is axial symmetric.
(2)At walls of the reactor,the monomer concentration is zero since the residence time of the mixture at walls of the reactor is so long and the reaction occurs within an infinite time;all of which cause the monomers to be converted to polymers.
(3)The concentration of mixture at the entry of the reactor is the
same as the input concentration of monomer.
In other words,

3.2.4.Solving the equation of laminar fl ow and determining the conversion distribution
The Finite difference method is employed to solve the partial differential equation.Following this process,the calculation circumstances are meshed first.Considering the directions available-radial and axial-the variation spans Δrand Δzare chosen.Alsoiandjvectors are chosen.The meshing of the reactor in 2-D figures has been illustrated in Fig.3.
The length of the reactor has been divided to 540 and its radius to 32 subdivisions;that ism=541andn=32in Fig.3.According to the length and radius of the reactor being 5.4 and 0.016 respectively,it is concluded that Δz=0.01 and Δr=0.0005.
Using the reaction rate quantities,the velocity profile equation,and the D coefficient at Eq.(17),the resulted equation is as follows:


Fig.3.Mesh grid of the reactor.
Employing the approximation of derivatives-which is the central difference for the radius and the backward difference for the axis and the implicit method,the equation,can be discrete.

It should be pointed out that both the vectors i and j are set at a single point of initiation.
According to observations by employing this method the differential equation is converted from the mass balance to an algebraic equation namely difference equation.
In order to solve the differential equation numerically,the boundary conditions should be inscribed numerically as well:

In implicit method,the concentration of each node depends on the previous and the next node at radial direction and also the concentration of the previous node at the axial direction.However,as indicated in the boundary condition No.3,the nodes of the entry section(j=1)are determinate at the axial direction;this way,no indeterminate variable is added to its counterpart of the next node(j=2).In other words,this can be concluded that there exists an equation for each indeterminate node in the second section(j=2).It should be considered that the estimated n for the second section of the reactor and also the valueuare used in the equations available.Regarding the rest of the boundary conditions,a set of30×30 algebraic equations are obtained forthe second section of the reactor and MATLAB program is used to solve these equations.As a result,the nodes of the second section(j=2)are all determined.A set of algebraic equations are obtained following this process;and the amount of concentrations are determined by solving the equations.
With regard to observations,a definite concentration is obtained for each node within each section of the reactor.Therefore,to determine the monomer concentration at each length,an average concentration should be considered generally:

4.Results and Discussion
4.1.Determination and calculation of the velocity pro fi le
The viscosity pattern of the rheometer for different samples has been presented in Fig.4.In addition,the flow curve for different samples has been presented in Fig.5.
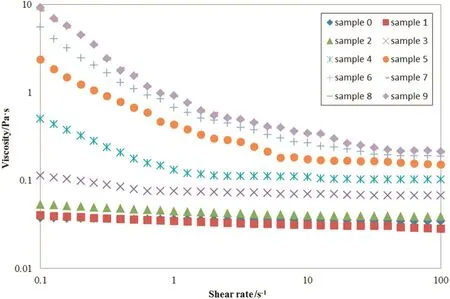
Fig.4.Viscosities behavior of different samples.
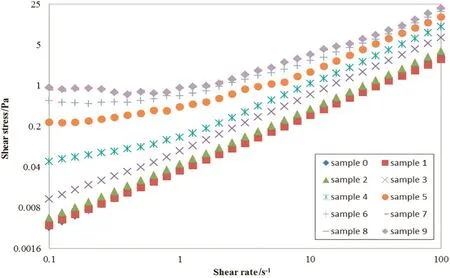
Fig.5.Flow curves behavior of different samples.
As illustrated in Fig.4,when the shear rate increases,the viscosity of the samples is exponentially decreased.Such a decrease indicates that the samples have a shear-thinning behavior in general.In other words,the Polymethyl Methacrylate mixture in the reactor is pseudoplastic.Based on observations,as the conversion rate grows through the length of the reactor,the viscosity is also increased exponentially.
Rheological models can be employed to determine the velocity profile of the mixture contained in a reactor.As the number of adjustable values in these models increases,the model would be more precise;however,the calculation of the velocity profile equation would be more complicated.Generally speaking,the calculation of velocity profile equation using Power Law Model is much feasible and easier than employing other models.Working with Power Law Model,the velocity profile equation can be obtained by integration and simplification[5].

Employing MATLAB program,curve fitting to the Power Law Model is applied using the flow curves and data the rheometer has presented.The calculated values of the Power Law Model have been listed in Table 5.
The n value is less than 1 for all samples in the Power Law Model as shown in Table 5 and based on this fact,the Polymethyl methacrylatemixture the tubular reactor contains is pseudo-plastic and has a shear thinning behavior.Accordingly,the results for the type of Polymethyl methacrylate mixture,a value mentioned in Table 5,are identical to those of Fig.4.The curve fitting has been duly performed with regard to this concordance.In this model,the n value for the sample 0 is much closer to 1 which represents the semi-Newtonian behavior of the mixture within the entrance of the reactor.Therefore,the velocity profile equation within the entrance can be considered as parabolic.According to observations made,in the next samples and also as the conversion grows,the n value is consistently descending.That is to say,as long as the conversion grows,the behavior of Polymethyl methacrylate mixture tends to be more non-Newtonian.
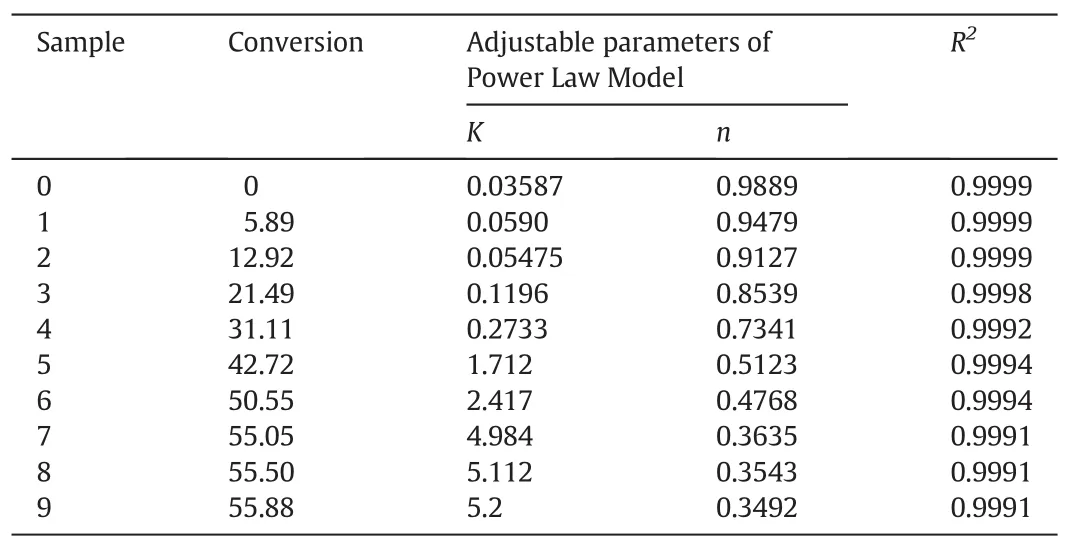
Table 5Results of curve fitting for Power Law Model
In the laminar flow for non-Newtonian fluids in the tube if the n value of Power Law Model is much closer to zero,the behavior of the flow is much similar to the plug mode[27].Then,it can be concluded that as the conversion grows,the reactor's flow pattern closes the plug mode and the flow pattern of the Polymethyl methacrylate mixture of the last sample-the outlet of the reactor-by the valuen=0.3492,is most similar to the plug flow than the other sections.This also should be taken into consideration that the flow pattern of the mixture contained in the reactor will never turn to plug,even at the outlet section.
4.2.Simulation results
The results of the modeling process are finally illustrated through some tables and figures.Table 6 represents the axial distributions of the conversion in plug and mixed modes.In addition,the radial andthe axial distribution of the conversion at laminar flow are shown in Figs.6 and 7,respectively.
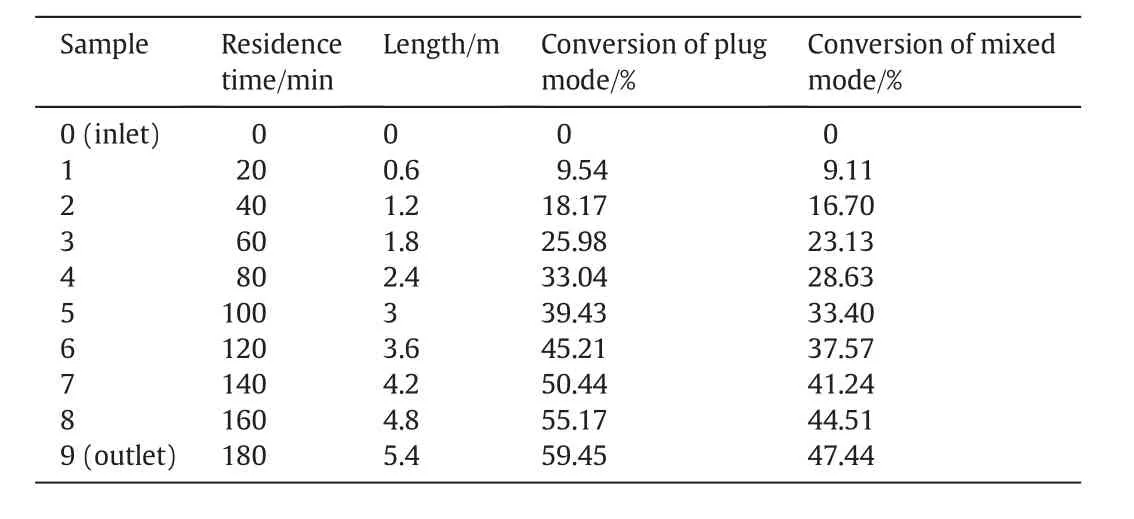
Table 6The modeling results of axial conversion in plug and mixed modes

Fig.6.The modeling results of radial conversion in laminar flow for different samples.
4.3.The effect of radius length on the conversion
The conversion rate distribution for the reactors having different radius is shown in Fig.8.
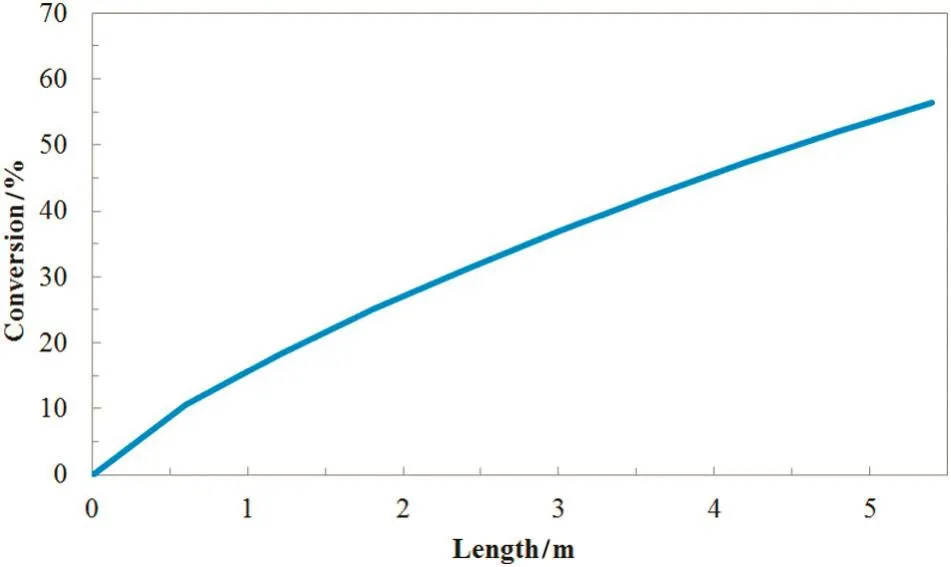
Fig.7.The modeling results of axial conversion in laminar flow.

Fig.8.Axial distribution of conversion for tubular reactor with different radius.
As shown in Fig.8,when the reactor's radius is decreased,the conversion rate grows.It is also inferred that compared with decreasing the radius,the effect of increasing the radius on the conversion is negligible.Furthermore,it is observed that decreasing the radius results in the inconsistency of the conversion distribution while increasing the radius makes the conversion distribution more consistent.
4.4.Comparing of the reactor in plug,mixed and laminar fl ow modes
Fig.9 illustrates the comparison made between the function of the reactor in plug,mixed and laminator flow modes.
As it is inferred from Fig.9:
(1)The plug mode has the most final conversion and the mixed mode has the lowest rate.
(2)The outlet conversion in laminar flow is between the plug and mixed modes.
(3)At the entry of the reactor in the laminar flow,the conversion is less than its equal rate in the mixed mode and as the progression is made through the length of the reactor,the conversion which is being discussed gradually reaches the conversion of the plug mode.

Fig.9.Comparison of the reactor in plug,mixed and laminar flow modes.
4.5.Model validation
Comparing the results of conversion distribution at modeling and laboratorial conditions,the precision of the modeling is assessed.The comparison made is shown in Fig.10.
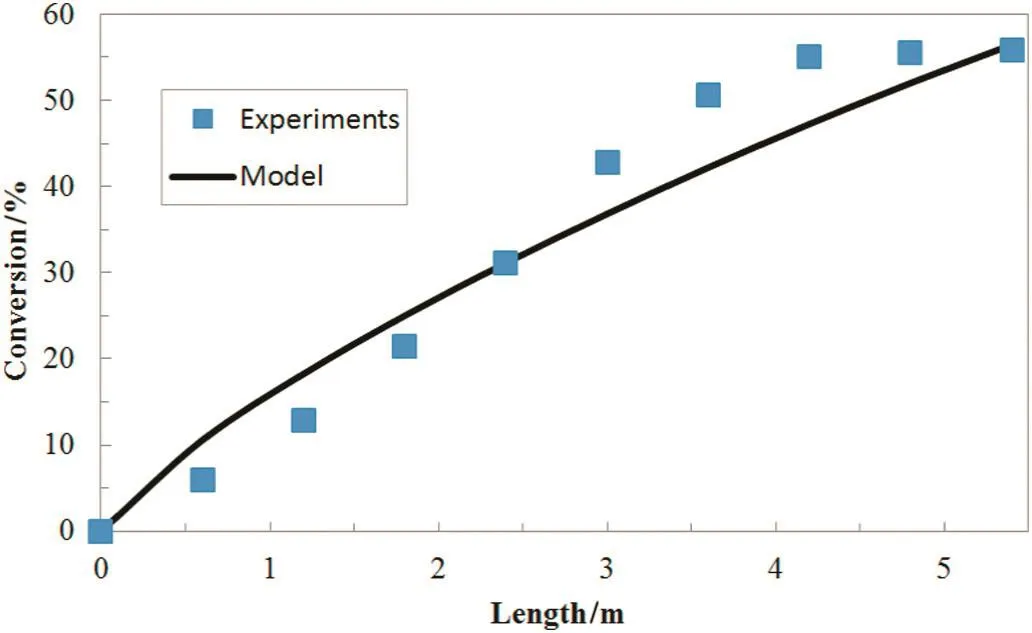
Fig.10.Comparison of the axial conversion distribution in theoretical and experimental modes.
As indicated in Fig.10,in general,the precision of the modeling is adequate especially for the outlet conversion as the rate obtained in the modeling(56.47%)is much closer to the experimental one(55.88%).However,as the glass and gel effect are not taken into account,the modeling is considered to have a deficiency.That is to say,the conversion distribution in modeling is consistent while this consistency is not observed in actual and experimental conditions.
5.Conclusions
In this study,rheological examination of the mixture of a tubular reactor in which methyl methacrylate was polymerized has been studied.The results indicate that the Polymethyl methacrylate mixture contained in the reactor is pseudo-plastic.Moreover,as the conversion grows,the velocity profile starts as a parabolic profile and approaches the plug mode;but it never reaches the plug.
In this modeling,the final conversion obtained is 56.47%;comparing this quantity with the experimental one which is 55.88%,it is concluded that the modeling performed is adequate.
According to the results,it is suggested that decreasing the reactor's radius considerably affects the conversion.However,as decreasing the radius would also reduce the productions rate this procedure is noteconomical unless few products are needed.
Nomenclature
A Area,m2
CiInitiator concentration,mol·L-1
CmMonomer concentration,mol·L-1
Cm0Inlet monomer concentration,mol·L-1
Cm,wMonomer concentration wall,mol·L-1
CmAverage monomer concentration at each length,mol·L-1
DAxial dispersion coefficient,m2·s-1
DnDead polymer molecule of lengthn
fInitiator efficiency coefficient
fzInhibitor molecule which ended to free radical
IInitiator molecule
˙IPrimary free radical molecule
iCounter for radius direction
jCounter for axial direction
K Consistency index,variable
K Kinetic constant,s-1
KdKinetic constant for initiator decomposition,s-1
KfmKinetic constant for transfer to monomer,m3·mol-1·s-1
KpKinetic constant for propagation of free radical,m3·mol-1·s-1
Kp0Initial kinetic constant for propagation of free radical,m3·mol-1·s-1
Kt0Initial kinetic constant for termination,m3·mol-1·s-1
KθpParameter in the gel effect constitutive equation,s-1
LLength of the reactor,m
MMonomer molecule
MwMolecular weight,g·mol-1
nFlow behavior index
PnLive polymer(free radical)molecule of lengthn
pPressure,MPa
QFeed flow rate,m3·s-1
Q′ Water flow rate,m3·s-1
RRadius of the reactor,m
R Universal gas constant,N·m·mol-1·k-1
R2Regression coefficient
rRadial position,m
rDimensionless radial position
rmPolymerization rate,mol·L-1·s-1
SSolvent molecule
TReaction temperature,°C
T′ Water temperature,°C
tResidence time,s-1
tResidence time,s-1
uzAxial velocity,m·s-1
umaxMaximum axial velocity,m·s-1
u Average axial velocity,m·s-1
XConversion
XmConversion of mixed reactor
XpConversion of plug reactor
ZInhibitor molecule
zAxial position,m
zDimensionless axial position
Δr Radius of element,m
ΔzLength of element,m
Shear rate,s-1
ε Void fraction of reactor
ϕpVolume fraction of polymer
η Viscosity,Pa·s-1
λ00th moment of“living”polymer chains,mol·m3
τ Shear stress,Pa
τmResidence time of mixed reactor,s
τpResidence time of plug reactor,s
Acknowledgement
The authors hereby thank Majid Ghiass and Mahdi Ghanavati for their assistance in conducting this research.
[1]R.Walker,Chemical reaction and diffusion in a catalytic tubular reactor,Phys.Fluids4(2004)1211–1216.
[2]E.Nauman,Polymerization Reactor Design Polymer Reactor Engineering,1,Springer,1994 125–147.
[3]I.Banu,Modeling and Optimization of Tubular Polymerization Reactors,Université Claude Bernard-Lyon I,2009.
[4]S.Lynn,J.E.Huff,Polymerization in a tubular reactor,AICHE J.17(1971)475–481.
[5]C.Chen,E.Nauman,Verification of a complex variable viscosity model for a tubular polymerization reactor,Chem.Eng.Sci.44(1989)179–188.
[6]M.Ghosh,D.Foster,J.Lencyzyk,T.Forsyth,A model of a tubular reactor for the continuous polymerization of styrene:experiments at low molecular weight,AIChE Symp.Ser.2(1976)134–147.
[7]B.M.Louie,G.M.Carratt,D.S.Soong,Modeling the free radical solution and bulk polymerization of methyl methacrylate,J.Appl.Polym.Sci.30(1985)3985–4012.
[8]P.E.Baillagou,D.S.Soong,Free radical polymerization of methyl methacrylate in tubular reactors,Polym.Eng.Sci.25(1985)212–231.
[9]P.A.Fleury,T.Meyer,A.Renken,Solution polymerization of methyl-methacrylate at high conversion in a recycle tubular reactor,Chem.Eng.Sci.47(1992)2597–2602.
[10]S.Fan,S.Gretton-Watson,J.Steinke,E.Alpay,Polymerization of methyl methacrylate in a pilot-scale tubular reactor:Modelling and experimental studies,Chem.Eng.Sci.58(2003)2479–2490.
[11]M.Scorah,R.Dhib,A.Penlidis,Modeling of free radical polymerization of styrene and methyl methacrylate by a tetra functional initiator,Chem.Eng.Sci.61(2006)4827–4859.
[12]P.Baillagou,D.Soong,Molecular weight distribution of products of free radical non isothermal polymerization with gel effect simulation for polymerization of poly(methyl methacrylate),Chem.Eng.Sci.40(1985)87–104.
[13]J.Pinto,W.Ray,The dynamic behavior of continuous solution polymerization reactors—VII.Experimental study of a copolymerization reactor,Chem.Eng.Sci.50(1995)715–736.
[14]A.Tobolsky,B.Baysal,A review of rates of initiation in vinyl polymerization:styrene and methyl methacrylate,J.Polym.Sci.11(1953)471–486.
[15]N.Tefera,G.Weickert,K.Westerterp,Modeling of free radical polymerization up to high conversion.II.Development of a mathematical model,J.Appl.Polym.Sci.63(1997)1663–1680.
[16]R.H.Perry,D.W.Green,J.O.Maloney,Perry's Chemical Engineer's Handbook,McGraw-Hill Book,1984.
[17]P.Baillagou,D.Soong,Major factors contributing to the nonlinear kinetics of freeradical polymerization,Chem.Eng.Sci.40(1985)75–86.
[18]M.Soroush,C.Kravaris,Nonlinear control of a batch polymerization reactor:an experimental study,AICHE J.38(1992)1429–1448.
[19]E.B.Nauman,Chemical Reactor Design,Optimization,and Scaleup,Wiley,New York,2008.
[20]O.Levenspiel,Chemical Reaction Engineering,Wiley,New York,1972.
[21]R.Bird,W.Stewart,E.Lightfoot,Transport Phenomena,Wiley,New York,1960.
[22]C.Wyman,L.Carter,A numerical model for tubular polymerization reactors,AIChE Symp.Ser.3(1976)1–16.
[23]J.S.Vrentas,J.L.Duda,Diffusion in polymer–solvent systems.III.Construction of Deborah number diagrams,J.Polym.Sci.15(1977)441–453.
[24]J.S.Vrentas,J.L.Duda,Molecular diffusion in polymer solutions,AIChE J.25(1979)1–24.
[25]W.C.Chen,S.J.Lee,B.C.Ho,Diffusion coefficients of acrylic monomers in poly(methyl methacrylate),J.Polym.Res.5(1998)187–191.
[26]L.S.Merrill,C.E.Hamrin,Conversion and temperature profiles for complex reactions in laminar and plug flow,AIChE J.16(1970)194–198.
[27]R.P.Chhabra,J.F.Richardson,Non-Newtonian Flow:Fundamentals and Engineering Applications,Butterworth-Heinemann,1999.
 Chinese Journal of Chemical Engineering2016年12期
- Chinese Journal of Chemical Engineering的其它文章
- Hemicellulose in corn straw:Extracted fromalkali solution and produced 5-hydroxymethyl furfural in HCOOH/HCOONa buffer solution☆
- Molar volume of eutectic solvents as a function of molar composition and temperature☆
- Investigation on molar heat capacity,standard molar enthalpy of combustion for guaiacol and acetyl guaiacol ester
- Statistical mechanics and artificial intelligence to model the thermodynamic properties of pure and mixture of ionic liquids☆
- A comprehensive fractal char combustion model☆
- Development of a bifurcation analysis approach based on gPROMS platform☆
