
The steady-state and dynamic simulation of cascade distillation system for the production of oxygen-18 isotope from water☆
2016-06-01 03:00YunhuGaoZhihongXuKejingWuXiaoluWangZhaojunYuWeiyangFei
Yunhu Gao ,Zhihong Xu ,Kejing Wu ,Xiaolu Wang ,Zhaojun Yu ,Weiyang Fei
1 Jiangsu Huayi Technology Co.,Ltd.,Jiangsu 215522,China
2 State Key Laboratory of Chemical Engineering,Department of Chemical Engineering,Tsinghua University,Beijing 100084,China
3 China Construction Installation Engineering Co.Ltd,Jiangsu 210049,China
1.Introduction
The global demand for the high-purified18O water has been increasing with the rapid development of Positron Emission Tomography/Computed Tomography(PET/CT)technology,which has great potential for excellent early diagnosis of cancer[1-3].Generally,18O water is manufactured by water distillation[4],O2cryogenic distillation[5,6]and NO cryogenic distillation[7],among which the water distillation is so widely applied that it contributes to more than half of the world's production.Superior advantages over other separation process are obtained for the water distillation:(1)the low-cost and easily available feedstock of water,(2)little negative influence on environment,and(3)low-risk operation for safe process.But there existsome drawbacks,typically that the single-stage separation factor(α)of 1.006 between oxygen-16(16O)and18O is extremely small and the natural abundance of18O is only 0.204%.So,appropriately designed processes,especially cascade process,are required for efficient separation.
Nevertheless,more than 2000 theoretical plates are needed to produce 98%18O water through multi-tower cascade operation,and a great deal of energy consumption is observed for the continuous vaporization of water[8-10].Additionally,it takes really a long period to achieve stable operation for a well-designed water distillation cascade,as the initial abundance of18O is very small.Thus,the real cascade experiments for process optimization are high-cost and difficult to be carried out to observe the isotopic distribution in separation systems.However,better understanding of stable production and start-up procedure will significantly bene fit the production design and cost control.Therefore,steady-state and dynamic simulation for the water distillation cascade process is important for this promising industry.
The general theory of isotope separation in columns only solved the two-component separation problemin orderto calculate the theoretical number of the columns[11].Fraenkelet al.developed a plate-by-plate calculation method for the separation of16O and18O under steady state conditions[12].Other researchers employed Aspen Plus to resolve steady-state simulation of16O/18O separation[13,14].However,all these methods mentioned above ignored the deuterium(D)influence on16O/18O separation.In fact,the real isotope system of18O water is far more complex.
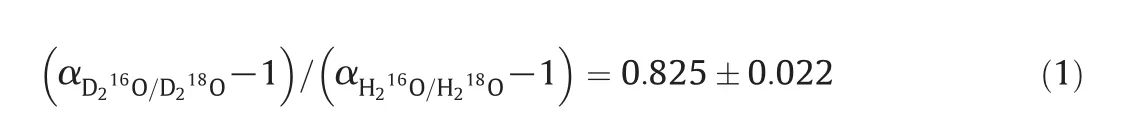
There are nine kinds of isotopic variants of water molecules[15],as shown in Table 1.Because the concentration of17O remains very low in18O production system,it is ignored in thepresent work.Thus,six main kinds of isotopic variants of water molecules are discussed here.Although the natural D abundance is about 0.015%,which is one order of magnitude lower than that of18O,large amount of D isotope get enriched in the product,because the typical α for protium/deuterium(H/D)is 1.04 and the effective separation factor,de fined as(α-1)/α,is much higher than that of16O/18O.Literatures available indicated that the D isotope will significantly reduce the separation factor of16O/18O as described in Eq.(1),which might significantly increase theoretical plates[17,18].Therefore,the separation of deuterium should be also considered to modeling the real distillation system.
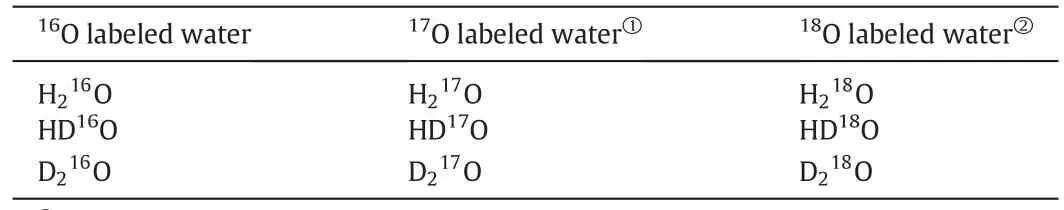
Table 1Nine kinds of isotopic variants of water molecule
Currently,to our best knowledge,there is no literature available for the dynamic simulation for18O production through water distillation.The researchers in Japan had development a dynamic model for the O2cryogenic distillation process.The systems are quite different because only O isotopes exist in O2distillation system,without complex isotope exchange reactions.However,there are mainly six kinds of isotopic molecules in H2O,leading to complex isotope exchange reaction network[19].Thus,the dynamic simulation for water distillation is much more complex and further work is required obviously.
In the present work,theoretical α expression of16O/18O and H/D is derived for the simulation with the existence and effect of18O and D.The equilibrium vapor concentration of18O and D is also obtained.Both steady-state and dynamic simulation models are established for the cascade separation system with five columns.Our previous work realized the steady-state simulation for the distribution of18O and D in water distillation system via lumping method[20],and the present steady-state result is compared with that of lumping method.This work provides a new approach for simulation of the18O separation via water distillation.
2.Model and Method
Herein,a classical method is applied to obtain the equations,such as mole balance,liquid-vapor equilibrium,and separation factors,for the steady-state and dynamic models.This classical method involves much less assumptions than lumping method as reported in our previous work.The detailed description on the models is presented as follow.
2.1.The steady-state model
Under steady-state conditions,the fraction and flow rate at certain point keep consistent in the separation system.As shown in Fig.1,a typical theoretical plate contains mole flow rate(LandG)and fraction(xandy)in liquid(downward)and vapor(upward)streams,as well as isotope exchange between the two streams.The mole balance from then-th theoretical plate to the product flow is expressed as below[21]:

whereLn-1andGn+1are the mole flow rates of liquid and vapor into then-th theoretical plate andLnandGnare the mole flow rates of corresponding outlet streams,whilePis the product flow rate;xn-1,yn,andxpare the mole fraction of the liquid streamLn-1,vapor streamGnand productP,respectively.In addition to these balance equations,phase equilibrium equations are required to determine all the variables.
Firstly,the physical and chemical properties of the six differenttypes of isotopic water are almost the same[22].Thus,the ideal gas and ideal liquid assumption are reasonable for this separation system[23].According to the Dalton's law of partial pressure and Raoult's law,we obtain:

wherepandp*is the vapor pressure and saturated vapor pressure,while the subscript M and total refers to certain isotopic variant and the systems,respectively.The saturated vapor pressure ofat different temperature is available from literatures[20,24].However,it's impossible to directly measure the saturated vapor pressure of pure HD16O and HD18O,and special calculation method is required to obtain these parameters.Herein,geometric mean rule is applied for this purpose and it is expressed as[25]:
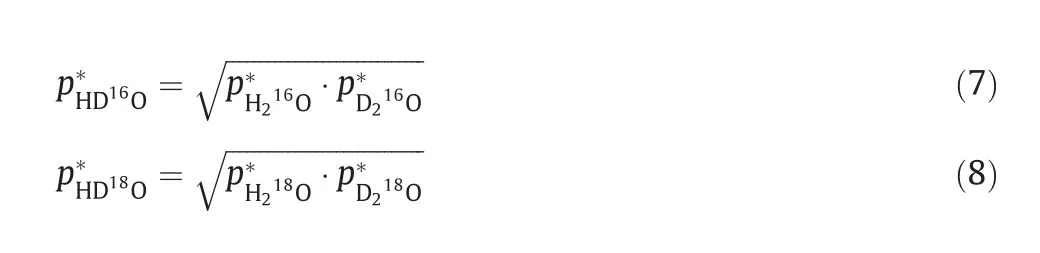
Based on this rule,the saturated vapor pressure of all variants is available for the simulation.
Secondly,a complicated reaction network of reversible isotope exchange exists in liquid phase[26].We assume that the distribution of D and18O atoms among the six isotopic variants of water molecule is random[25,27],and then,the mole concentration of each isotopic variant is determined by the mole concentration of H,D,16O and18O.

The rest equations for other isotopic variants are similar to Eqs.(9)-(10),except for the subscript.Considering the normalization of mole concentration,only two variables are required For the mole fraction of the six variants at certain stage and the number of variables is significantly reduced.

Finally,the separation factors play a key role in the separation performance.Based on the ideal consumption,they can be simply de fined as the ratio of saturated vapor pressures:

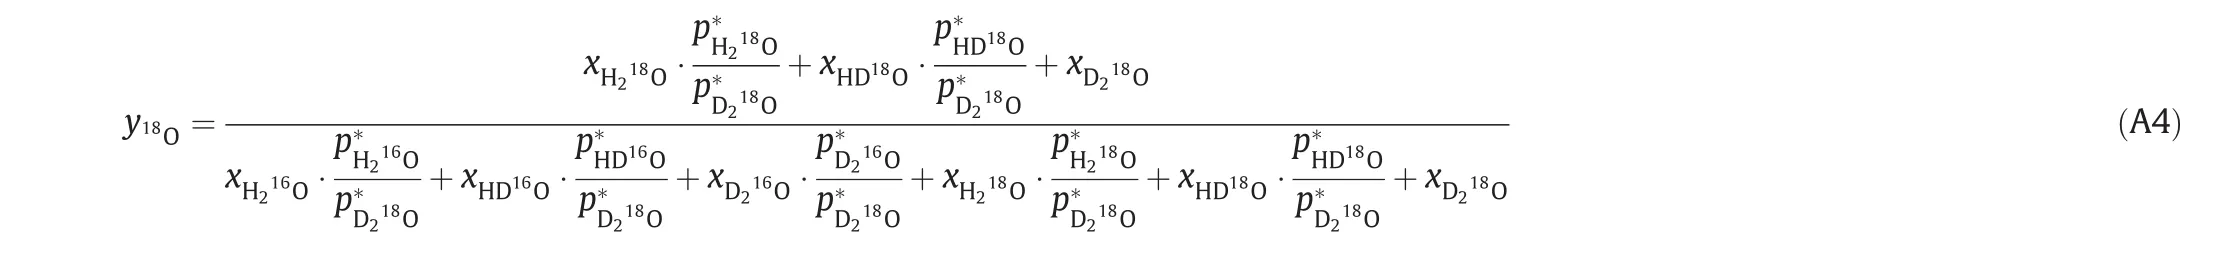
Considering Eqs.(5)to(15),the equilibrium mole fraction of18O and deuterium in vapor phase can be calculated and the expressions are as below:
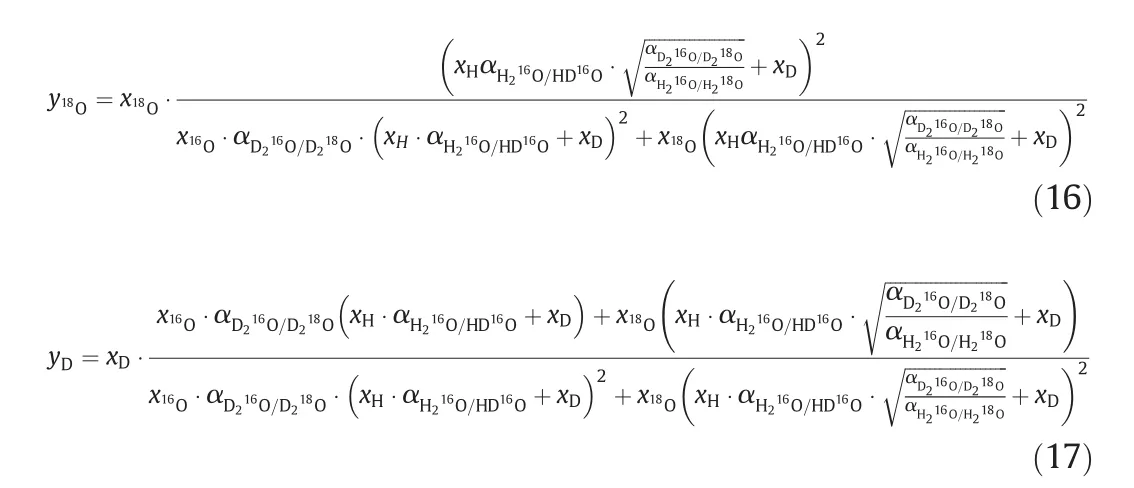
The detailed derivation is shown in Appendix Eqs.(A1)-(A12).In Eq.(16),the separation factors only depend on the temperatureT,and compared with Eqs.(11)and(12),it can be simplified as:

Similarly,the Eq.(17)can be also simplified as:

The simultaneous equations consist of Eqs.(2)-(4),(18)and(19)indicate that only liquid mole flow rate and the temperature are required to resolve all the equations at all theoretical plates when the product and feedstock conditions are given.Additionally,as the enthalpy of differentisotopic water is almost the same,constant mole flow assumption is reasonable.
2.2.The dynamic simulation model
The steady state is notestablished immediately butover a long startup period or equilibriumtime(isotope accumulation period).According to the mole balance in Fig.1,the change rate of mole fraction of18O and D at different timetin the liquid phase is:

whereHnis the liquid holdup of then-th theoretical plate.
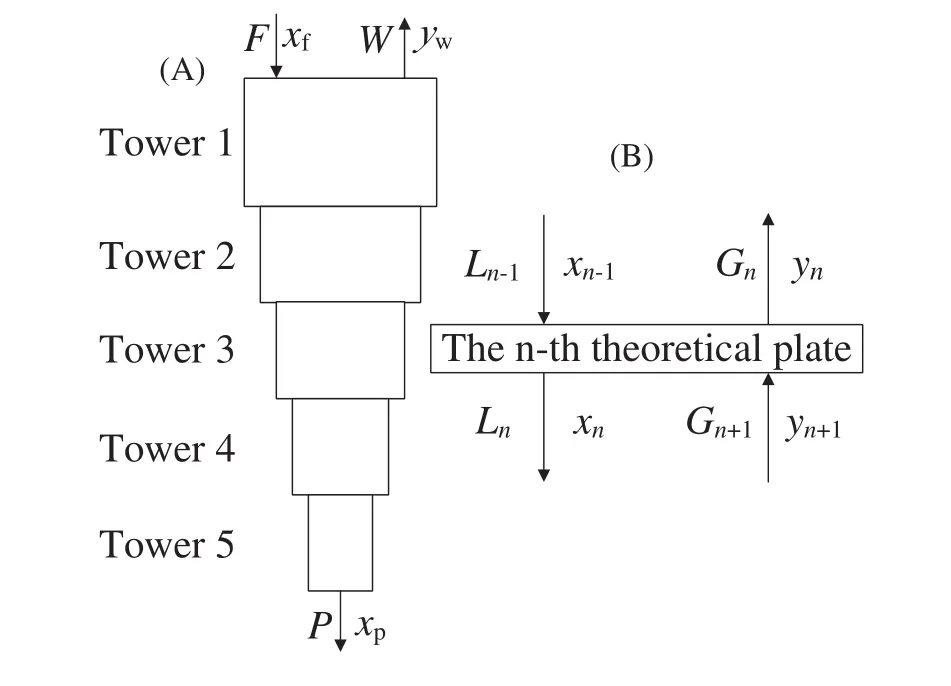
Fig.1.Schematic diagram of the cascade system and the material streams at n-th theoretical plate for the mole balance calculation.
Assuming that the liquid inside the overhead tank is homogeneous,change rate of mole fraction of18O and D in the liquid phase is:

where the subscript i and o refers to inlet and outlet for the tank.To keep a stable prolonged continuous operation,Lois 1.1 times the flow rate of the next distillation tower,and this will be discussed later.
To run the dynamic simulation,the liquid flow in each theoretical plate and in overhead tank is constant,but productionPdepends on the18O mole fraction of the product(stream leaving the last theoretical plate).Meanwhile,the vapor flow rate leaving then-th theoretical plateGnis determined by Eq.(4).
Before the product18O concentration reaches 98%,production flow ratePis 0.A PID algorithm is adopted in the dynamic simulation to determinePafter the product18O concentration reaches 98%by Eq.(24):

whereKandDiis the proportion coefficient and differential coefficient,respectively;tandt-1 refers to thet-th and the(t-1)-th day.The PID parameters are optimized as 0.011574 and 0.11574 forKandDi,respectively.
Because the mole concentration change rate of18O and D at each theoretical plate varies significantly,the dynamic model may suffer from a stiff differential equation group.To achieve better stability,accuracy and efficiency,transformation is introduced[28]:

The change rate of substitution variablezis comparable and the non stiff differential equations are easy to be resolved by ordinary integration algorithm.
2.3.Cascade process
To compare the steady-state and dynamic simulation,an open cascade process consisting of 5 distillation towers(T1 to T5)is designed for oxygen-18 production.As shown in Fig.2,the feedstock is directly fed into the top of T1,of which the liquid flow rate equals the feed,and pumps(P1 to P4)and condensers(E1 to E5)are used to connect the streams between towers.The vapor stream from the later tower is condensed in condenser,and subsequently,it goes back to the bottom of the former tower.To keep a stable and prolonged continuous operation,the flow rate,pumped to the overhead tank(V2 to V5),is 1.1 times of that in the next tower and the over flowing of 10%is mixed with the condensed stream back to the former tower.The final product is obtained at the bottom of T5 and its isotopic concentrations are the same with that at the last theoretical plate.The operation conditions,such as pressure, flow rate and liquid hold up,at each theoretical plate of each tower or in the overhead tank,are listed in Table 2.The pressure drop of each theoretical plate is equal,and then the pressure is determined.The temperature is estimated according to the empirical correlation between temperature and saturated vapor pressure of water.
In this cascade process,2043 theoretical plates are used and each theoretical plate has 2 independent variables,i.e.,the concentration of18O and D,according to Eqs.(2)-(4),(18)and(19).So,there're totally 4086 variables in the steady state simulation and Levenberg-Marquardt method is adopted to solve the simultaneous equations[29].

Fig.2.Process flowchart of water distillation system consisting of five columns for 18O water production.

Table 2Process operation conditions of each tower and overhead tank
As for the dynamic simulation,the initial concentration of18O and D in each theoretical plate and overhead tank is 0.204%and 0.015%,respectively.Beside 2043 theoretical plates,4 overhead tanks also have 8 independent variables.So,there're 4094 variables in the dynamic simulation.Herein,Adams-Bashforth-Moulton PECE Method is applied to solve the ordinary differential simultaneous equations[30].
The equations are resolved using MATLAB 2014a on a quad-core Intel CPU i7-2600 with a clock speed of 3.4 GHz and 12 GB of RAM.
3.Results and Discussion
3.1.Steady-state simulation
Given the product mole flow ratePto be 0.284531 mol·h-1,the mole concentration of18O and D at each theoretical plate is obtained based on the steady-state model in Section 2.1.The isotopic mole concentration at the bottomof each toweris listed in Table 3 and the results of lumping method,realized by Aspen Plus[20],are contained for comparison.It is obvious that the isotope distribution simulated via classical method agrees well with that by lumping method.Because of the less assumption in classical method than lumping method,the former should be more accurate.
The concentration distribution of18Oand Disotopes in each theoretical plate are present in Fig.3.A typical distribution curve is observed:the18O is enriched significantly from T3 and its concentration reaches98%at the bottom of T5.On the contrary,the D concentration increases slightly before T5 and it increase rapidly near the bottom of T5.This difference may result from the lower initial D concentration,but higher D separation factor than that of18O.At the beginning of the distillation,the low natural abundance is the main resistance.When the concentration increases to a considerable value,the separation factor plays a key role for further enrichment.Thus,the increase of18O concentration is much flatter than that of D isotope.
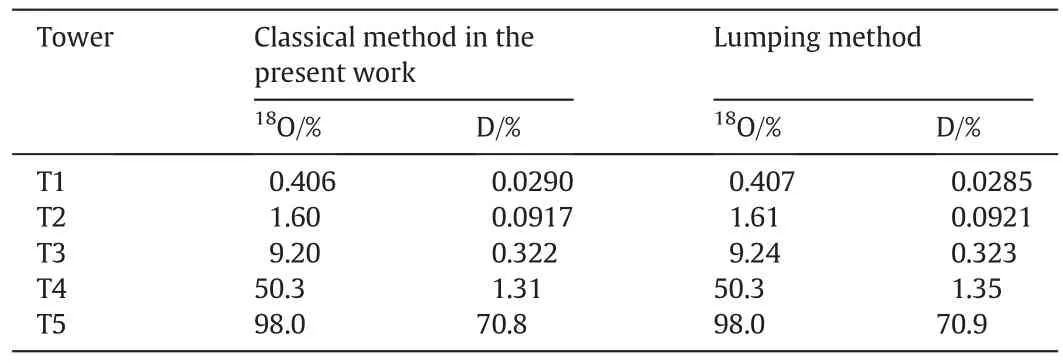
Table 3The 18Oand Dmole concentration at the bottom of each tower obtained from steady-state model and lumping method

Fig.3.Isotope distribution at each theoretical plate.
3.2.Dynamic simulation
Before the analysis of dynamic simulation,some variables should be de fined.Relative extraction ratio η is used to measure the ability for isotopes extraction from the inlet stream at the top of each tower:

whereIrefers to different isotopes,18O and D.The isotope transfer rates are de fined as:

wherexIfis the feed mole fraction to the tower,is in equilibrium withxIfat certain conditions andyIis the outlet vapor mole fraction,which is in equilibrium with the outlet liquid mole fraction leaving the first theoretical plate of the tower.Generally,at stable state,η is between 0 and 1,asyIgradually decrease towhen the theoretical plates increase to in finite.Another important variable is product withdraw and it is expressed as the mole flow rate of isotope in product:
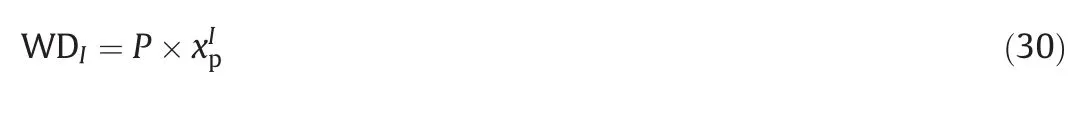
When the distillation process reaches stable state,WDIshould be equal tojIof each tower.
3.2.1.Global isotope distribution
The isotope distribution ateach plate in a time period of1000 days is presentin Fig.4.Ittakes 171 days to reach the desired18O mole fraction of 98%at the last theoretical plate,and subsequently,the PID control Eq.(24)is applied to slowly increase the product flow rate to maintain the18O concentration in the product.During this unsteady period,significant changes in18O and D concentration distribution of T3 to T5 are observed.
The18O concentration in T3 and T4 increases and reaches maximum directly following that in T5;after a long time at high concentration level,a considerable decrease is observed for T3 and T4;and subsequently,both towers remain constant.The T1 and T2 towers may experience similar increase and decrease procedure,but it is difficult to be observed because of the rather low concentration.Differently,the D concentration in T5 increases rapidly to about 100%at the bottom of the tower and that in T4 also increases quickly after the T5 reaches the highest concentration.Then,the D concentration in T4 gradually decreases to a very small value and remain constant.After that,D concentration in T5 suffers from a rapid decrease,and subsequently,a slight increase to reach the steady condition.T1,T2 and T3 seem to be more stable after a sharp increase at the beginning.
Totally,about 800 days are required to approach final steady state for all towers and it is really a long time for industry.However,it is only about 400 days for the product flow rate to reach 95%of the designed value and significant amount of product is obtained during the start-up period.Additionally,a detailed video of isotope distribution at different time is attached as an accessory.
3.2.2.Explanation of the concentration distribution
The isotope distribution evolution is mainly influenced by isotope transfer ratejinto the towers and product withdraw WD leaving the systems.Furthermore,jcomes from the bottom of the previous tower or the feedstock(Fig.2),and WD is determined by Eq.(30).Because the PID control Eq.(24)is applied,the product18O concentration is limited to(98±0.04)%and the increase trend of18O concentration results in the increase of product flow rate.Generally,this increase trend exists before the steady state and is enhanced by the improved separation factor of18O.In fact,the separation factor of16O/18O and H/D can be expressed as:
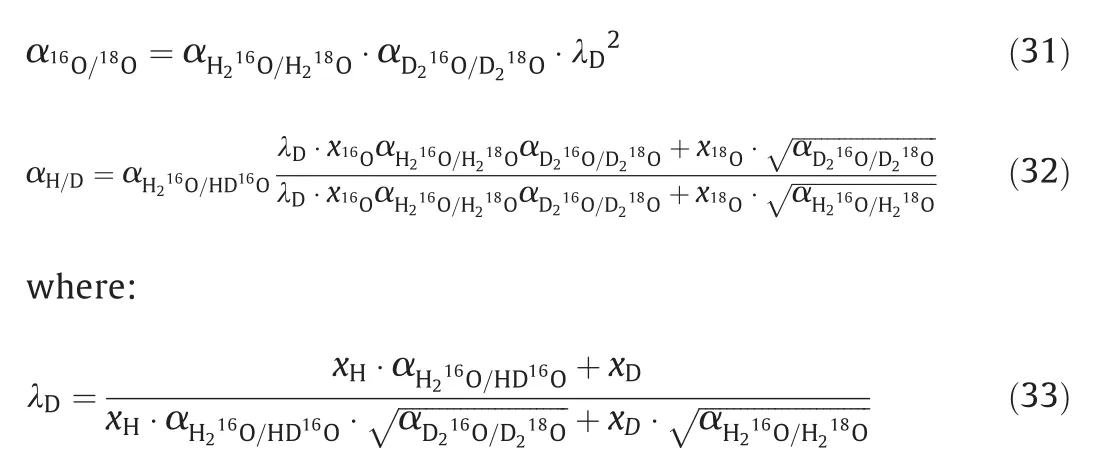
The effect of D concentration is observed in parameter λDand its value decrease with thexD,which should be responsible for the interesting change of isotope distribution.

Fig.4.Concentration distributions of18O(A)and D(B)at each plate during 1000 days.
Firstly,the isotope transfer rate at feedstock position and product withdraw of18O and D is shown in Fig.5A,and the relative extraction ratio at feedstock position is represent in Fig.5B.Due to the perfect ability for D separation,the ηDandjDis almost constant along the simulation period.According to the value of transfer rate and product withdraw, five stages are divided as listed in Table 4.

Fig.5.Isotope extraction and withdraw at different times.

Table 4The standard to divide the simulation period into five stages
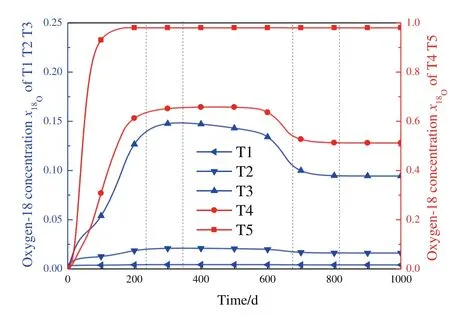
Fig.6.Oxygen-18 concentration at the bottom of each column versus time.
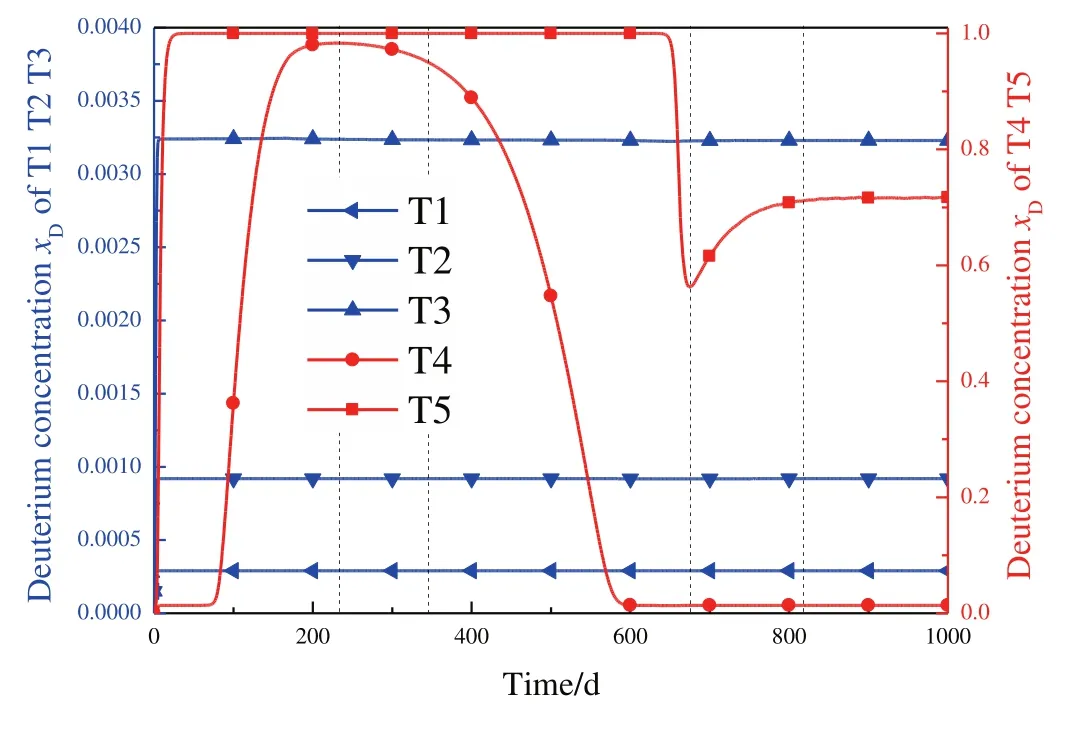
Fig.7.Deuterium concentration at the bottom of each column versus time.
The isotope concentration at the bottom of each tower for18O and D is exhibited in Figs.6 and 7,respectively.In stage 1,isotopes are accumulated in the towers and significant increase of18O and D concentration is observed until stage 2.The D concentration at T4 reaches the maximum when entering stage 2,and subsequently,decreases because of WDDis larger thanjD,while the18O concentration continue to increase.Early in stage 3,18O concentration decreases very slowly,due to the close value of WD18Oandj18O.Meanwhile,the D concentration in T4 still decrease rapidly.Later in stage 3,two opposite forces exist to affect the increase trend of18O concentration in the product.1)The decreased D concentration results in larger λDand then,higher separation factor of16O/18O is obtained,according to Eq.(31)and(33).Thus,increase trend of18O concentration is strengthened.2)The18O concentration at the bottom of T4 decrease in stage 3,resulting in decreased isotope transfer rates into T5.Then,there is no enough isotope in the tower to support the product withdraw and the increase trend of18O concentration is weakened.The increased separation factor forces the WD of18O and D to increase quickly and further decrease the D concentration.However,the separation factor is limited due to the finite value of λDand the weakened isotope transfer becomes significant to decrease the WD.Therefore,a peak value of WD is observed near 650 days,and then,WDDdecreases until the end of stage 3.The18O concentration and WD slowly decrease to realize a steady state in stage 4.But the D concentration in T5 slightly increases,because of a quite small value of WDDlower thanjD.In fact,a video attachment is available and it will exhibit the evaluation process much clear and comprehensible.
In summary,D concentration significantly influence the18O separation through the effect on separation factor of16O/18O and a product withdraw peak value is observed before the final steady state.The isotope transfer rate into the towers and product withdraw leaving the systems are coupled to determine the isotope concentration during the start-up procedure.
3.2.3.Low concentration zone in towers
At the beginning of start-up procedure,as shown in Fig.8,the18O relative extraction ratio η for T2-T5 exceed 1,namelyy<y*according to Eq.(27)to(29).Clearly in Fig.9,low concentration zones,namely that18O concentration in the middle is low than both the top and bottom of the towers,in T4 and T5 at the 10th day as an example are observed on the isotope concentration distribution curve,when the relative extraction ratio is larger than 1.In fact,the low18O concentration in the middle of the towers will results in vapor stream with low18O concentration;and this vapor stream rises upward to the top to exchange with the liquid stream.At the top of the towers,18O concentration of vapor streamy18Owill be smaller thany18O*,when the18O concentration in low concentration zones are small enough.Thus,that the relative extraction ratio is larger than 1 is obtained according to Eq.(27)to(29),indicating that the outlet liquid concentration of the first theoretical plate in the tower is smaller than the feed concentration to the towerxMf.However,this valley does not exist in T1 and its relative extraction ratio is smaller than 1.
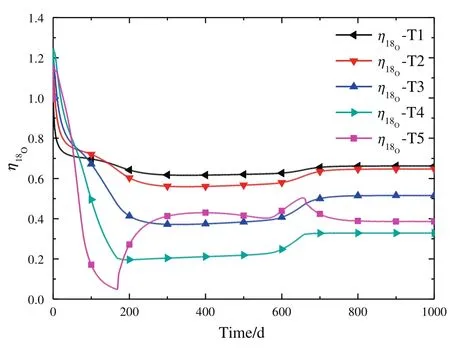
Fig.8.The change of isotope relative extraction ratio of each tower at different time.

Fig.9.Relative extraction ratio at the beginning of the simulation and 18O distribution at the 10th day.
One possible explanation for the low concentration zone is presented here:When there is no additional feed at the top of the tower,i.e.,in the case of total re flux,the separation effect will result in that18O concentration gradually decreases with time in the upper part of tower and increases in the bottom part.However,when a liquid stream with high18O concentration,accumulated in the previous tower,is fed at the top,the mixture effect will increase the concentration at this point,but it takes some time to transfer the enriched isotope to the middle of the tower.Thus,a low concentration zone is formed if the stream fed in is concentrated enough.
Meanwhile,this phenomenon is observed only at the beginning of the start-up procedure and in the latter towers(T2,T3,T4 and T5).Nevertheless,special attention should be paid to proof the existence of the low concentration zone when a new industrial production line goes to operation.
4.Conclusions
The steady-state and dynamic simulation models of18O isotope water separation in a cascade system are established and the effect of Deuterium isotope is presented.The steady-state simulation results indicate that the classical method and the lumping method corroborate mutually.The dynamic process of the example,which is significantly influenced by the D concentration,can be divided into 5 stages.The method shows prospective application of simulation and optimization of the oxygen-18 water,heavy water and deuterium depleted water production system.
Nomenclature

Acknowledgements
We would like to thank the support from State Key Laboratory of Chemical Engineering.
Appendix
A.1.The derivation of vapor phase equilibrium mole fraction for18O
The Dalton's law gives the vapor-phase18O fraction as below:

The Raoult's law is applied to exhibit the relationship with liquid phase:

where,p*is saturated vapor pressure and that of HD16O and HD18O is determined via geometric mean rule.Thus,it can be further expressed as:
and,
The saturated vapor pressure is related to the separation factor based on ideal consumptions and Eqs.(13)-(15)will be applied here:

thus:

A.2.The derivation of vapor phase equilibrium mole fraction for D
Similarly,Dalton's law and Raoult's law are used for the derivation:

And,

Replacing the saturated vapor pressure with separation factor gives the formation:
A.3.The derivation of separation factor for H/D and16O/18O
According to the definition of separation factor,the αH/Dis expressed as below:

and,

Replacing the vapor mole fraction gives the formation:

And finally:

Similarly,separation factor of16O/18O is derived

[1]Y.M.Miao,Production technologies and application of O-18 water and its market analysis,Shanghai Chem.Ind.36(9)(2011)31-33(in Chinese).
[2]G.H.Yang,W.J.Zhang,H.P.Shi,S.M.Xu,The separation and application of oxygen isotope,J.Isot.18(1/2)(2005)118-122(in Chinese).
[3]Z.D.Yang,J.X.Pang,Z.H.Wu,Technique for recycling used oxygen-18 water,Acad.J.Sec.Mil.Med.Univ.28(5)(2007)545-548(in Chinese).
[4]Zhao Z.M.,Luan J.W.,Xiao,H.E.,Ren,W.T.,“Apply water distillation technoloy to enrich18O″,Chem.Eng.,6,72-78(1983).(in Chinese)
[5]T.Kambe,H.Kihara,S.Hayashida,H.Kawakami,Development of oxygen-18 separation unit by oxygen distillation,Taiyo Nippon Sanso Corp.Q.23(2004)20-25.
[6]A.Koichi,Mass transfer:from fundamentals to modern industrial applications,Willey-VCH,Weinheim,2006.
[7]B.M.Andreev,E.P.Magomedbekov,A.A.Raitman,M.B.Pozenkevich,Y.A.Sakharovsky,A.V.Khoroshilov,Separation of isotopes of biogenic elements in two-phase system,Elsevier,Amsterdam,2007.
[8]H.L.Li,Production technology status and development trend of stable isotopes C,N and O,J.Isot.24(2011)7-14(in Chinese).
[9]G.H.Yang,Q.X.Zeng,Stable isotopes separation,Nuclear Energy Press,Beijing,1989(in Chinese).
[10]Z.J.Yu,Oxygen-18 isotope production by water distillation,Stable Isot.3(1987)1-5(in Chinese).
[11]A.M.Pozen,Theory of isotope separation in column,Atom Press,Moscow,1960.
[12]Z.Fraenkel,A.Paviv,Plate by plate calculations of multicomponent distillation columns using difference equations(I):Ideal cascades and constant flow columns operating at total re flux,Chem.Eng.Sci.18(1963)697-709.
[13]Y.Y.Jiang,Y.Y.Chen,C.J.Qin,Y.Liu,H.S.Gu,Simulation and optimization of stable isotope 18O separation by cascade distillation,J.Isot.24(B12)(2011)102-105(in Chinese).
[14]Y.Y.Chen,C.J.Qin,B.Xiao,J.Xu,Simulation and optimization of stable isotopes18O separation by water vacuum distillation,At.Energy Sci.Technol.46(5)(2012)533-536(in Chinese).
[15]Z.Y.Guo,Stable isotope chemistry,Science Press,Beijing,1984(in Chinese).
[16]I.Dostrovsky,M.Epstein,The production of stable isotopes of oxygen,Anal.Chem.Symp.Ser.11(1982)693-702.
[17]D.Wolf,H.Cohen,Process design consideration and steady-state operational data for separations of isotopes of oxygen,Can.J.Chem.Eng.50(5)(1972)621-627.
[18]M.Thürkauf,A.Narten,W.Kuhn,Trennung und konzentrationsverlauf der sauerstof fistopen 16O,17O und 18O bei der destillation von Wasser in einer präzisionsdestillationsanlage,Helv.Chim.Acta43(4)(1960)989-1004.
[19]W.A.V.Hook,Vapor pressures of the isotopic waters and ices,J.Phys.Chem.72(4)(1968)1234-1244.
[20]Y.H.Gao,Z.H.Xu,Z.J.Yu,W.Y.Fei,Concentration distribution of deuterium and oxygen-18 and its influence in heavy-oxygen water separation cascade,CIESC J.65(1)(2014)213-219(in Chinese).
[21]W.J.Jiang,Y.Y.Dai,H.J.Gu,Principles of chemical engineering,Tsinghua University Press,Beijing,1992.
[22]F.Steckel,S.Szapiro,Physical properties of heavy oxygen water.Part 1—Density and thermal expansion,Trans.Faraday Soc.59(1963)331-343.
[23]W.T.Zhu,Physical Chemistry,Tsinghua University Press,Beijing,1995.
[24]S.Szapiro,F.Steckel,Physical properties of heavy-oxygen water(II):Vapor pressure,Trans.Faraday Soc.63(4)(1967)883-894.
[25]S.Villani,Isotope separation,American Nuclear Society,Hinsdale,1976.
[26]N.Matsunaga,A.Nagashima,Saturation vapor pressure and critical constants of H2O,D2O,T2O and their isotopic mixture,Int.J.Thermophys.8(6)(1987)681-694.
[27]X.A.Xiao,Isotope separation,Atomic Energy Press,Beijing,1999.
[28]W.Q.Luo,Dynamic simulation of cryogenic distillation column with hydrogen system(Ph.D.Thesis)Tianjin Univ.,China,2003(in Chinese).
[29]J.M.Jorge,The Levenberg-Marquardtalgorithm:Implementation and theory,in:G.A.Watson(Ed.),Lecture Notes in mathematics,Springer,Berlin 1977,pp.105-116.
[30]F.S.Lawrence,K.G.Marilyn,Computer Solution of Ordinary Differential Equations:the Initial Value Problem,W.H.Freeman,San Francisco,1975.
 Chinese Journal of Chemical Engineering2016年8期
- Chinese Journal of Chemical Engineering的其它文章
- Computational chemical engineering - Towards thorough understanding and precise application☆
- A review of control loop monitoring and diagnosis:Prospects of controller maintenance in big data era☆
- Experimental and numerical investigations of scale-up effects on the hydrodynamics of slurry bubble columns☆
- The heat transfer optimization of conical fin by shape modification
- Experimental mass transfer coefficients in a pilot plant multistage column extractor
- Ligand assisted copper-catalyzed Ullmann cross coupling reaction of bromaminic acid with amines☆