
T1 and ECV Mapping in Myocardial Disease
2016-05-22 08:42:17EricOlaussonandErikSchelbertMDMS
Eric L. Olausson and Erik B. Schelbert, MD, MS
1Department of Clinical Physiology, Karolinska Institutet and Karolinska University Hospital, Stockholm, Sweden
2Department of Medicine, University of Pittsburgh School of Medicine, Pittsburgh, PA, USA
3UPMC Cardiovascular Magnetic Resonance Center, Heart and Vascular Institute, Pittsburgh, PA, USA
4Clinical and Translational Science Institute, University of Pittsburgh, Pittsburgh, PA, USA
Introduction
T1 mapping using cardiovascular magnetic resonance (CMR) introduces novel techniques for myocardial tissue characterization to detect and quantify disease processes occurring at the microscopic level. Rather than relying on nonspecific functional measures, T1 mapping focuses on intrinsic changes of myocardial composition that advances understanding about specific disease pathways. These changes in myocardial tissue composition inform diagnosis and prognosis.
T1 mapping encompasses two key parameters:native (i.e., precontrast) T1 and extracellular volume fraction (ECV) derived from additional postcontrast T1 and blood T1 measurements. Native T1 can re flect myocardial changes related to disease affecting the entire myocardium, whether intracellular or extracellular [1]. In contrast, ECV is more specific and mostly re flects myocardial changes limited to the extracellular interstitial space which includes the vascular compartment [1]. These two parameters appear to be robust for diagnosing specific disease processes [2]. These advances introduce new tools to detect focal and diffuse derangements in myocardial structure occurring in cardiac disease that can be otherwise difficult to detect [3–6].
Optimal diagnosis and prognosis promises optimal treatment whereby the patient’s therapy can be matched to the underlying disease process. Indeed,this important principle of myocardial tissue composition-guided therapy has already been demonstrated with other myocardial CMR parameters [i.e.,T2*(star)] whereby CMR guided care improved disease detection/severity measurement culminating in markedly improved patient outcomes [7]. It appears likely that T1 and ECV mapping will show similar impact in patient care. This review focuses on the emerging key principles involving the clinical application of T1 mapping.
Native T1, ECV, and Parametric Mapping
T1 is physical property of matter. The term “T1”refers to the exponentiated time constant representing the nonlinear recovery of longitudinal magnetization (spin-lattice relaxation) after a radiofrequency pulse. T1 is expressed in units of time (e.g., msec)and varies with temperature and chemical composition. Thus the accumulation of gadolinium based contrast agent, iron or glycosphingolipid can lower T1 in myocardium in proportion to severity. Practically, T1 is estimated by fitting the changes in signal intensity in T1 weighted images acquired at various time points following an inversion pulse. Modi fied Look Locker inversion (MOLLI) [8] is the most studied pulse sequence for myocardial T1 measurement, but other sequences also measure myocardial T1 [9–13]. Their relative merits and feasibility for clinical implementation remain areas of active investigation [14]. MOLLI uses a 3 parameter model to describe signal intensity(SI) as a function of exponentiated time after a 180 degree radiofrequency inversion pulse (TI):
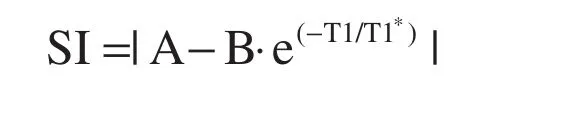
where T1=T1*((B/A)−1) [8, 15, 16].
If myocardial T1 is additionally measured post gadolinium contrast (Gd), typically between 10 and 20 min after 0.1–0.2 mmol/kg bolus, Gd concentrations in the plasma and interstitium are in equilibrium because renal clearance is slow relative to its dispersion through the body. The uptake of Gd in the myocardium relative to plasma is a direct measure of the interstitial space with minimal dependence of gadolinium concentration since Gd contrast is extracellular [17]. ECV exploits this characteristic and is de fined as:

where λ=[ΔR1myocardium]/[ΔR1bloodpool] pre and post gadolinium contrast (where R1=1/T1) [1].
The term “mapping” refers to the measurement of native T1 or ECV on a pixelwise basis. Mapping requires coregistration of component images from which the data are fit to generate the parameter estimates. Mapping permits visualization and spatial localization of T1 (Figure 1) or ECV (Figure 2).The signal intensity of regions of interest drawn on a T1 or ECV map by a reader yields the quantitative value of T1 or ECV. Color coding with look-up tables permits rapid qualitative interpretation based on visual inspection of the map.
Even though T1 mapping has limited spatial resolution, cellular and molecular changes occurring within each voxel can affect the aggregate T1 signal rendering them quanti fiable. The estimated T1-based parameters quanti fied on a T1 or ECV map demonstrate the spatial localization of these changes whereby each pixel expresses the quantitative value of that parameter. This quantitation permits detection of diffuse disease even if it is not directly visible (Figures 1 and 2).
These innovations are important because disease severity is quanti fied, and its spatial extent and distribution are also demonstrated on the map. Thus, myocardial disease can be rapidly detected regardless of whether focal or diffuse. Non quantitative “weighted”images, e.g., late gadolinium enhancement (LGE),are not robust for detecting diffuse disease and are not validated for this purpose [19]. LGE images are expressed in arbitrary units and can only detect spatial variation in myocardial fibrosis, e.g., “hot spots” relative to the most normal appearing myocardium which may not be normal at all. LGE cannot quantify the extent of diffuse interstitial expansion. Historically,diffuse myocardial disease has been difficult to measure or even appreciate noninvasively.
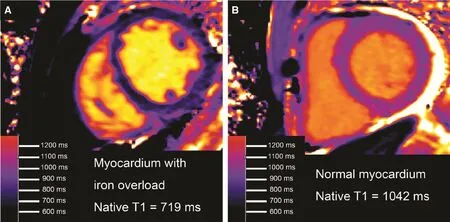
Figure 1 Native T1 in Human Myocardium Decreases with Excess Iron Content [18].Panel A shows native T1 map shown from a patient with hemochromatosis and iron overload, demonstrating a remarkably low myocardial T1. In comparison to a patient with normal myocardial T1 who also happened to have a small pericardial effusion(panel B), panel A provides an image that is immediately recognizable as abnormal.
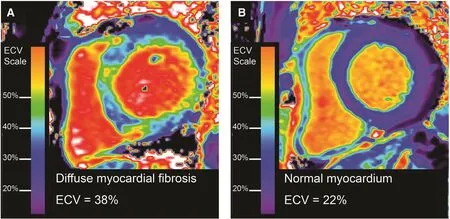
Figure 2 ECV mapping to depict and quantify diffuse myocardial fibrosis.Examples of an ECV map quantifying the spatial distribution and extent of mostly diffuse fibrosis in a patient with nonischemic cardiomyopathy (Panel A). The image contrasts significantly with a patient without myocardial fibrosis with normal ECV measures (Panel B).
Pitfalls in T1 and ECV Mapping
T1 and ECV mapping demand more technical complexity for accurate image generation than T1 weighted imaging. It is imperative that the CMR practitioner be intimately familiar with several potential problems in image acquisition. Since T1 measures are sensitive to scanner characteristics and specific parameters related to sampling of T1 recovery, normative data from healthy volunteers should be generatedfor each scannerwith minimal adjustment in the chosen T1 mapping pulse sequences thereafter; locking the T1 mapping protocols is recommended [1]. For the mathematical fitting of the T1 data, phase sensitive reconstruction [20]improves fitting of the data by removing a degree of freedom related to polarity and associated phase of the magnetization [i.e., SI=A−B·e(−TI/T1*)and the absolute value signs which previously introduced a degree of freedom are no longer present].
Creating the pixelwise map of T1 or ECV requires coregistration of all of the component images.Breath holding is therefore recommended to minimize misregistration for T1 and ECV mapping [1].Motion correction improves coregistration of the component images from which the pixelwise maps are derived because breath holding does not always remove all respiratory motion [21]. Error maps [22]depict subsequent problems with data fitting. These latter images can alert the CMR reader to technological problems and/or associated artifact which may necessitate repeat measurements. These innovations improve the robustness of the technique,and they can be extended to ECV mapping [22].In general, temporal and spatial resolution both must be sufficiently high to avoid artifact related to motion. Most protocols involve parallel imaging factors of 2 to maintain sufficiently high spatial and temporal resolution.
Partial volume averaging can corrupt myocardial T1 measures. The tissue from which T1 estimates are measured should be orthogonal to the imaging plane given the image slice thickness of 6–8 mm;obliquity and misregistration will in flate partial volume errors related to limited spatial resolution.Partial volume effects can be visualized as bands around the edges of the myocardium on T1 and ECV maps that depict pixels straddling the border between tissues (Figures 1 and 2). Partial volume error limits sampling of myocardial disease by T1 and/or ECV mapping to the mid myocardium since subendocardial and subepicardial pixels are “contaminated” by partial volume effects.
Off resonance can bias T1 measures significantly and represents a barrier to standardization between CMR sites, so optimal shimming is recommended to minimize off resonance [1]. These technical pitfalls are discussed in more detail in the consensus statement on myocardial T1 mapping and extracellular volume quanti fication from the Society for Cardiovascular Magnetic Resonance (SCMR) and CMR Working Group of the European Society of Cardiology [1].
Native T1 for Diagnosing Disease
Case control studies indicate that intracellular accumulation of iron in myocardial siderosis (iron overload) [18] or intracellular accumulation of glycosphingolipid in Anderson Fabry disease [23–25]lower native T1 in a diffuse fashion throughout the myocardium (Figure 1). Clinically, siderosis can present as a dilated cardiomyopathy phenotype whereas Anderson Fabry disease presents as a left ventricular hypertrophy phenotype. Neither of these two morphologic phenotypes (i.e., dilated cardiomyopathy or left ventricular hypertrophy) is sufficiently specific to inform the clinician of the underlying disease process. Thus, T1 measures add diagnostic specificity to these two morphologic phenotypes.
Since native T1 has the advantage of not requiring gadolinium based contrast, native T1 can be implemented as a rapid screening tool for Fabry’s disease or iron overload. For example, the TIC-TOC study demonstrated the clinical and economic advantages of an ultrafast magnetic resonance imaging protocol for detecting myocardial siderosis [26]. This study scanned 6 participantsper hourfor two 12-h days,reducing scanning costs by a factor of ≈4. Native T1 mapping analysis took minimal training, required<1 minute, and was reliable.
Native T1 can also decrease in highlyfocalmyocardial disease (i.e., not diffuse) such as the core of an acute myocardial infarction. [27,28]. Shorter native T1 in the core of an infarct typically indicates more severe disease including microvascular obstruction and greater risks of adverse outcomes [29]. Native T1 can also depict the area at risk that occurs with acute coronary artery occlusion [30, 31].
Native T1 can increase in other conditions. These include myocardial fibrosis [32], amyloidosis [33–36] acute myocarditis [30, 37–42], acute myocardial infarction [16, 27, 28], vasodilation [43], and hypertrophic cardiomyopathy [44–46]. The origins of increased native T1 likely re flect increased water content (edema) in these conditions. The excess water in these diverse conditions may challenge the concept of what constitutes myocardial “edema”in the setting of diffuse disease. Native T1 in the setting of cardiac amyloidosis becomes especially high, a feature which can assist in distinguishing amyloidosis from fibrosis [33, 34, 36, 47] and also assist in prognosis [34].
Since so many disease pathways can alter native myocardial T1, the clinical context must be known to inform the clinician about the nature and extent of disease, like many valuable parameters in clinical medicine. Therefore, it is entirely expected that increased native generally T1 lacks specificity.Native T1 is most diagnostic when it is significantly decreased diffusely re flecting either Anderson Fabry disease or iron overload. When the native T1 is severely elevated, one must consider amyloidosis, especially in the setting of left ventricular hypertrophy and other suggestive ancillary findings. Otherwise, native T1 derangements can alert the clinician to myocardial disease such as fibrosis or edema, depending on the clinical context spanning the range from ambulatory patients to hospitalized patients post cardiac arrest.
Current recommendations advise each center to establish normal reference ranges since many scanner related factors and pulse sequence related factors can in fluence resultant native T1 measures [1]. Care must be taken to optimize the scanning protocol and then avoid subsequent changes in parameters to avoid confounding native T1 measurements.
ECV for Diagnosing Intrinsic Myocardial Disease
Myocardial fibrosis re flects dysregulation of collagen homeostasis. It occurs in a spectrum from mild to severe where excess collagen (concentration) accumulates in the myocardial interstitium from excess production and/or decreased catabolism [48]. Since gadolinium contrast agents are extracellular, ECV measures interstitial expansion occurring with fibrosis, amyloidosis, vasodilation,or interstitial edema [3, 4, 49]. Similar to native T1,these conditions can generally be differentiated if the clinical context is known.
ECV dichotomizes the myocardium into its primarily cardiomyocyte compartment and predominantly interstitial compartment (including the myocardial vasculature) [1]. ECV simplyquanti fiesthe interstitial uptake of gadolinium contrast agents relative to the plasma (Figure 2). Accordingly, histologic validation data overall show best agreement with ECV compared to other T1 metrics based on R2values (i.e., the proportion of variation in a variable explained by another variable) [50, 51]. specifically,ECV is superior to native [17, 52–55] or post contrast T1 [17, 52, 53, 56] in terms of agreement with collagen volume fraction. ECV is also superior to native T1 [57] or post contrast T1 [57] for predicting outcomes in large cohorts. Despite the potential confounding effects of capillary rarefaction which occurs in myocardial fibrosis [58] (since myocardial gadolinium contrast uptake includes the myocardial vasculature), most validation studies report high R2values ≥0.6 when compared against the collagen volume fraction [17, 52–56, 59, 60].
ECV quanti fication of interstitial expansion represents a powerful tool to investigate myocardial remodeling, especially when combined with ancillary clinical data. While myocardial fibrosis may follow myocyte loss due to various types of injury,it also may occur with primary fibroblast activation[19]. The positive correlation between myocardial fibrosis (whether by ECV or histology) and left ventricular mass suggests significant prevalence of primary fibroblast activation since myocyte loss alone would decrease left ventricular mass [51].This information may be relevant when appraising potential therapeutic targets to reverse myocardial remodeling.
The heart is similar to the liver, lung, and kidney:excess collagen can culminate in profound organ dysfunction and associated vulnerability [61].Interstitial protein accumulation therefore re flects intrinsic organ disease. One need only consider the clinical example of cardiac amyloidosis to observe how disastrous interstitial protein accumulation can be for cardiac function, leading to symptoms and dismal survival. Thankfully, myocardial fibrosis exhibits at least some degree of plasticity, and various interventions can reverse it in humans [62–66].
“Interstitial heart disease” can affect microvascular, mechanical and electrical function as well as myocyte energetics [67], re flecting cardiomyocyteextracellular matrix interactions beyond the interstitium. These interactions include: (a) capillary rarefaction and perivascular fibrosis [58] that limit perfusion reserve [62, 68, 69]; (b) myocardial stiffening [70, 71] from increased amyloid proteins [72]or from titin and collagen expansion with increased cross-linking in MF that leads to systolic and diastolic dysfunction [48, 63, 65, 69] and increased filling pressures [70], (c) impaired electrical conduction from disarray in the collagen network architecture that predisposes to reentrant arrhythmia and sudden death; [72, 73] and d) likely impaired cardiomyocyte/mitochondrial energetics if interposing excess collagen isolates cardiomyocytes from capillaries in the setting of decreased perfusion reserve and myocardial stiffening [51]. These concepts are illustrated in Figure 3.
Emerging data reveal that many cardiac insults culminate in myocardial fibrosis as a final common pathway, and the extent of fibrosis can vary across disease categories [2]. Similar to older studies limited to histopathology, myocardial fibrosis quanti fied by ECV can be observed in a variety of disease states including myocarditis [41, 74], rheumatologic disease [75–77], hypertension [78, 79],diabetes [80], obesity [81], heart failure regardless of ejection fraction [19, 52, 70, 82], and hypertrophic cardiomyopathy [59, 83, 84]. ECV doesnotappear to elevated in “Athlete’s Heart,” suggesting that physiologic adaptation to exercise is primarily cellular (cardiomyocyte hypertrophy) rather than interstitial (myocardial fibrosis) [44].
Risk Strati fication with T1 Mapping and ECV
Increased ECV re flects intrinsic myocardial disease.Indeed, the extent of myocardial fibrosis appears to govern vulnerability to adverse outcomes (death or heart failure) regardless of cause or disease category[19, 34]. The literature on ECV strongly suggests that it is a powerful tool to assess risk of adverse events and poor outcomes. In fact, ECV appears to be a more robust risk strati fier than left ventricular ejection fraction, the prognostic benchmark that governs so many clinical decisions in cardiology.ECV also appears to be a stronger risk strati fier than late gadolinium enhancement [19, 85].
ECV can measure myocardial fibrosis reasonably well despite the manipulation of myocardial tissue that occurs during histologic processing prior to microscopy that can alter the original in vivo interstitial space between cells. This alteration can potentially perturb the correlation between ECV and the collagen volume fraction. In addition, the distribution of collagen can vary spatially in the myocardium which also can alter ECV-collagen correlations.Diffuse myocardial fibrosis may have a subendocardial predilection in ischemic heart disease [86]rendering its ultimate quanti fication challenging by ECV which preferentially samples the mid myocardium. Nonetheless, surveying the literature, it is important to note that despite these limitations:
• ECV has been extensively validated against collagen volume fraction as shown in Table 1 [17,52–56, 59, 87, 88]
• ECV is reproducible between separate CMR scans [11, 87, 89–93]; and
• ECV predicts outcomes [34, 80, 85, 94] to the extent that ECV can provide “added prognostic value” manifest by state of the art reclassi fication and discrimination metrics [19].Native T1 and ECV mapping have each shown promise for risk strati fication in cardiac amyloidosis [34].
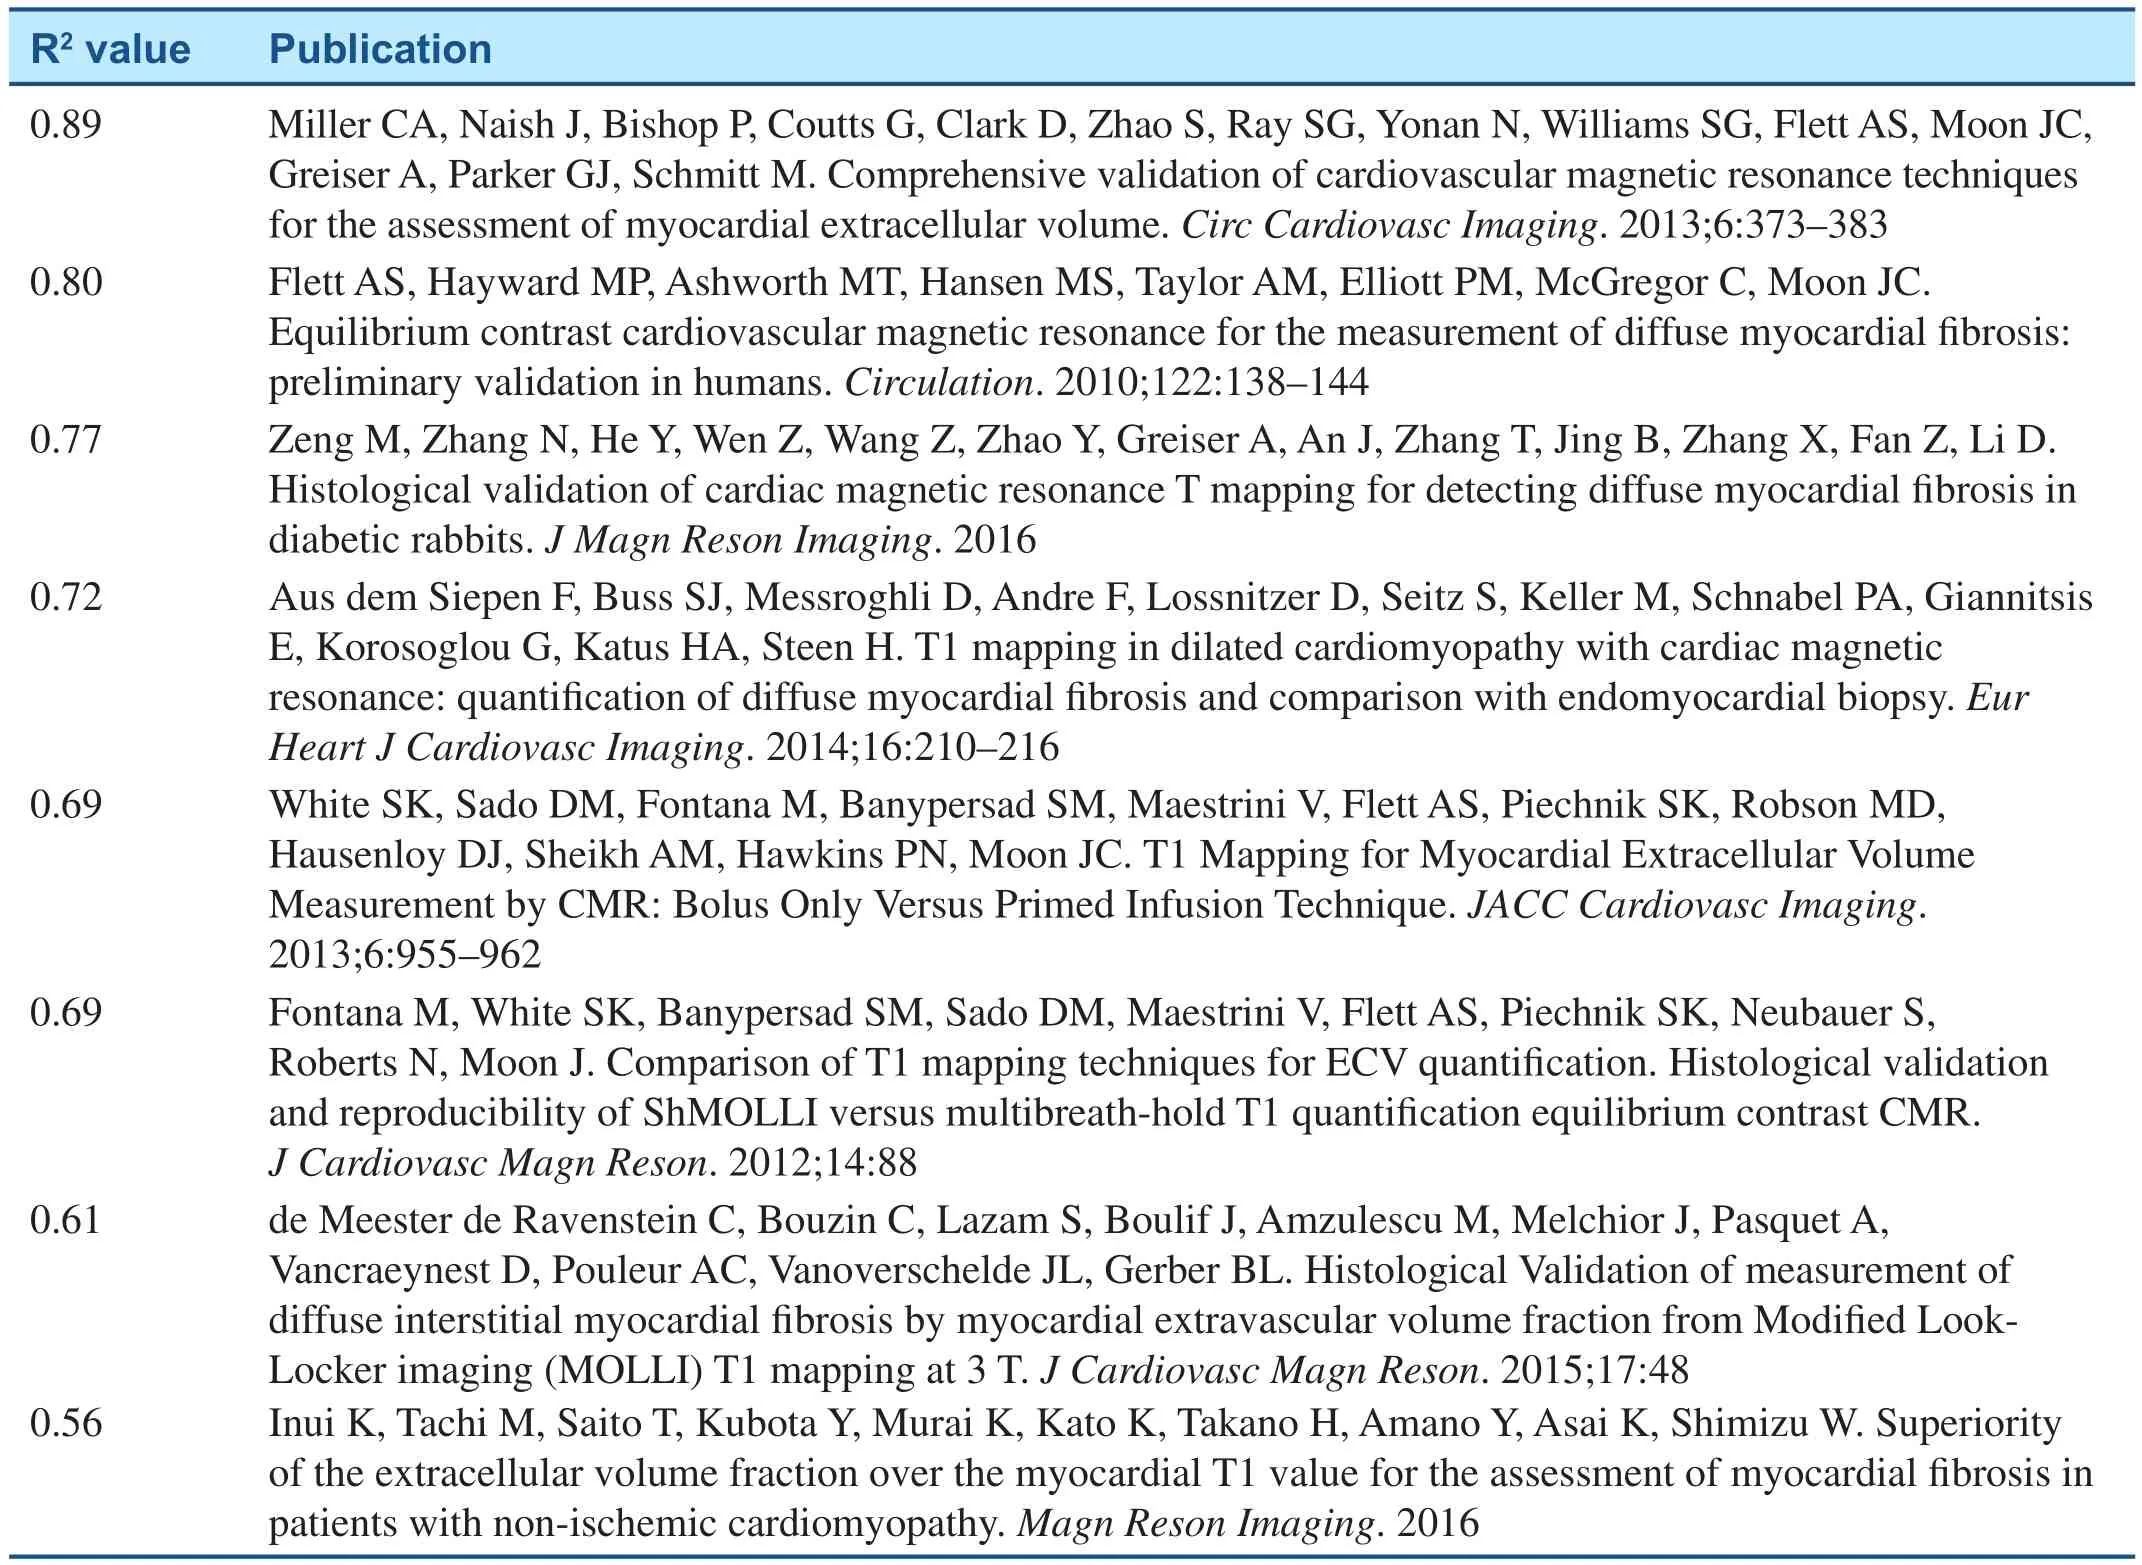
Table 1 Histologic validation studies of ECV measuring myocardial fibrosis according to R2 value. The R2 value describes the proportion of variation in collagen volume fraction explained by ECV.
T1 Mapping and ECV for Monitoring Therapeutic Response in Practice or Phase 2 Ef ficacy Trials
T1 and ECV mapping technology may act as a catalyst for therapeutic development for Phase 2 ef ficacy trials. Due to the ability to track specific disease processes such as intracellular diseases affecting the cardiomyocyte (e.g., iron overload,Anderson Fabry disease) and extracellular/interstitial disease processes (e.g., myocardial fibrosis and cardiac amyloidosis) affecting the myocardial interstitium, investigators and clinicians can now enjoy robust, reproducible techniques that quantify the extent of myocardial disease. Rather than relying on nonspecific measures like left ventricular shape or function or natriuretic peptide levels, all of which can be in fluenced by preload, afterload,and volume status, investigators and clinicians can now probe how the myocardium in an individual may respond to proposed treatment. This issue is enormously important given the aging population and the epidemic of heart failure where therapeutic progress has been slow [95–97]. In fact, whether the heart is the primary derangement in heart failure with preserved ejection fraction (“HFpEF”)is actively being debated. T1 and ECV mapping can now provide clear evidence of therapeutic response specifically located in the myocardium.Novel therapies targeting the interstitium are in development.
Conclusion
T1 and ECV mapping foster precision medicine and personalized care. Since T1 and ECV mapping elucidate specific disease pathways affecting myocardium, they promise to improve patient outcomes through targeted therapy. They are clinically robust and can easily be integrated into clinical scanning routines. Data thus far are promising, but further investigation is required to capitalize on the remarkable opportunities that T1 mapping and ECV introduce. These opportunities include improved understanding of disease mechanisms, therapeutic response to treatment, pharmacologic development,and optimizing therapeutic regimens through image guided care.
REFERENCES
1. Moon JC, Messroghli DR, Kellman P,Piechnik SK, Robson MD, Ugander M, et al. Myocardial T1 mapping and extracellular volume quanti fication: a Society for Cardiovascular Magnetic Resonance (SCMR) and CMR Working Group of the European Society of Cardiology consensus statement. J Cardiovasc Magn Reson 2013;15:92.
2. Schelbert EB, Messroghli DR.State of the art: clinical applications of cardiac T1 mapping. Radiology 2016;278:658–76.
3. Sado DM, Flett AS, Banypersad SM, White SK, Maestrini V,Quarta G, et al. Cardiovascular magnetic resonance measurement of myocardial extracellular volume in health and disease. Heart 2012;98:1436–41.
4. Ugander M, Oki AJ, Hsu LY,Kellman P, Greiser A, Aletras AH,et al. Extracellular volume imaging by magnetic resonance imaging provides insights into overt and sub-clinical myocardial pathology.Eur Heart J 2012;33:1268–78.
5. Puntmann VO, Peker E,Chandrashekhar Y, Nagel E. T1 Mapping in characterizing myocardial disease: a comprehensive review. Circ Res 2016;119:277–99.
6. Taylor AJ, Salerno M,Dharmakumar R, Jerosch-Herold M. T1 mapping: basic techniques and clinical applications. JACC Cardiovasc Imaging 2016;9:67–81.
7. Modell B, Khan M, Darlison M,Westwood MA, Ingram D, Pennell DJ. Improved survival of thalassaemia major in the UK and relation to T2* cardiovascular magnetic resonance. J Cardiovasc Magn Reson 2008;10:42.
8. Messroghli DR, Radjenovic A, Kozerke S, Higgins DM,Sivananthan MU, Ridgway JP.Modi fied Look-Locker inversion recovery (MOLLI) for high-resolution T1 mapping of the heart. Magn Reson Med 2004;52:141–6.
9. Roujol S, Weingartner S, Foppa M, Chow K, Kawaji K, Ngo LH,et al. Accuracy, precision, and reproducibility of four T1 mapping sequences: a head-to-head comparison of MOLLI, ShMOLLI,SASHA, and SAPPHIRE.Radiology 2014;272:683–9.
10. Piechnik SK, Ferreira VM,Dall’Armellina E, Cochlin LE,Greiser A, Neubauer S, et al.Shortened Modi fied Look-Locker Inversion recovery (ShMOLLI) for clinical myocardial T1-mapping at 1.5 and 3 T within a 9 heartbeat breathhold. J Cardiovasc Magn Reson 2010;12:69.
11. Schelbert EB, Testa SM, Meier CG,Ceyrolles WJ, Levenson JE, Blair AJ,et al. Myocardial extravascular extracellular volume fraction measurement by gadolinium cardiovascular magnetic resonance in humans: slow infusion versus bolus. J Cardiovasc Magn Reson 2011;13:16.
12. Chow K, Flewitt JA, Green JD, Pagano JJ, Friedrich MG,Thompson RB. Saturation recovery single-shot acquisition (SASHA) for myocardial T1 mapping. Magn Reson Med 2014;71:2082–95.
13. Salerno M, Janardhanan R, Jiji RS,Brooks J, Adenaw N, Mehta B,et al. Comparison of methods for determining the partition coef fi-cient of gadolinium in the myocardium using T(1) mapping. J Magn Reson Imaging 2013;38:217–24.
14. Robson MD, Piechnik SK,Tunnicliffe EM, Neubauer S. T1 measurements in the human myocardium: the effects of magnetization transfer on the SASHA and MOLLI sequences. Magn Reson Med 2013;70:664–70.
15. Deichmann R, Hasse A.Quanti fication of T1 values by SNAPSHOT-FLASH NMR imaging. J Magn Reson 1992;96:608–12.
16. Messroghli DR, Niendorf T,Schulz-Menger J, Dietz R,Friedrich MG. T1 mapping in patients with acute myocardial infarction. J Cardiovasc Magn Reson 2003;5:353–9.
17. Miller CA, Naish J, Bishop P,Coutts G, Clark D, Zhao S, et al.Comprehensive validation of cardiovascular magnetic resonance techniques for the assessment of myocardial extracellular volume. Circ Cardiovasc Imaging 2013;6:373–83.
18. Sado DM, Maestrini V, Piechnik SK, Banypersad SM, White SK,Flett AS, et al. Noncontrast myocardial T1 mapping using cardiovascular magnetic resonance for iron overload. J Magn Reson Imaging 2015;41:1505–11.
19. Schelbert EB, Piehler KM, Zareba KM, Moon JC, Ugander M,Messroghli DR, et al. Myocardial fibrosis quanti fied by extracellular volume is associated with subsequent hospitalization for heart failure, death, or both across the spectrum of ejection fraction and heart failure stage. J Am Heart Assoc 2015;4:e002613.
20. Xue H, Greiser A, Zuehlsdorff S,Jolly MP, Guehring J, Arai AE,et al. Phase-sensitive inversion recovery for myocardial T1 mapping with motion correction and parametric fitting. Magn Reson Med 2013;69:1408–20.
21. Xue H, Shah S, Greiser A, Guetter C, Littmann A, Jolly MP, et al.Motion correction for myocardial T1 mapping using image registration with synthetic image estimation. Magn Reson Med 2012;67:1644–55.
22. Kellman P, Arai AE, Xue H. T1 and extracellular volume mapping in the heart: estimation of error maps and the in fluence of noise on precision. J Cardiovasc Magn Reson 2013;15:56.
23. Thompson RB, Chow K, Khan A, Chan A, Shanks M, Paterson I, et al. T1 Mapping with CMR is highly sensitive for fabry disease independent of hypertrophy and gender. Circ Cardiovasc Imaging 2013;6:637–45.
24. Sado DM, White SK, Piechnik SK,Banypersad SM, Treibel T, Captur G, et al. Identi fication and assessment of anderson-fabry disease by cardiovascular magnetic resonance noncontrast myocardial t1 mapping. Circ Cardiovasc Imaging 2013;6:392–8.
25. Thompson RB, Chow K, Khan A,Chan A, Shanks M, Paterson I, et al.T(1) mapping with cardiovascular MRI is highly sensitive for Fabry disease independent of hypertrophy and sex. Circ Cardiovasc Imaging 2013;6:637–45.
26. Abdel-Gadir A, Vorasettakarnkij Y,Ngamkasem H, Nordin S, Ako EA,Tumkosit M, et al. Ultrafast magnetic resonance imaging for iron quanti fication in Thalassemia participants in the developing world:the TIC-TOC study (Thailand and UK International Collaboration in Thalassaemia Optimising Ultrafast CMR). Circulation 2016;134:432–4.
27. Dall’Armellina E, Ferreira VM,Kharbanda RK, Prendergast B, Piechnik SK, Robson MD,et al. Diagnostic value of precontrast T1 mapping in acute and chronic myocardial infarction. JACC Cardiovasc Imaging 2013;6:739–42.
28. Dall’Armellina E, Piechnik SK,Ferreira VM, Si QL, Robson MD,Francis JM, et al. Cardiovascular magnetic resonance by non contrast T1-mapping allows assessment of severity of injury in acute myocardial infarction. J Cardiovasc Magn Reson 2012;14:15.
29. Carberry J, Carrick D, Haig C, Rauhalammi SM, Ahmed N, Mordi I, et al. Remote zone extracellular volume and left ventricular remodeling in survivors of ST-elevation myocardial infarction. Hypertension 2016;68:385–91.
30. Ferreira VM, Piechnik SK,Dall’Armellina E, Karamitsos TD,Francis JM, Choudhury RP, et al.Non-contrast T1-mapping detects acute myocardial edema with high diagnostic accuracy: a comparison to T2-weighted cardiovascular magnetic resonance. J Cardiovasc Magn Reson 2012;14:42.
31. Ugander M, Bagi PS, Oki AJ,Chen B, Hsu LY, Aletras AH, et al.Myocardial edema as detected by pre-contrast T1 and T2 CMR delineates area at risk associated with acute myocardial infarction. JACC Cardiovasc Imaging 2012;5:596–603.
32. Bull S, White SK, Piechnik SK,Flett AS, Ferreira VM, Loudon M, et al. Human non-contrast T1 values and correlation with histology in diffuse fibrosis. Heart 2013;99:932–7.
33. Fontana M, Banypersad SM,Treibel TA, Maestrini V, Sado DM, White SK, et al. Native T1 mapping in transthyretin amyloidosis. JACC Cardiovasc Imaging 2014;7:157–65.
34. Banypersad SM, Fontana M,Maestrini V, Sado DM, Captur G, Petrie A, et al. T1 mapping and survival in systemic light-chain amyloidosis. Eur Heart J 2014;36:244–51.
35. Karamitsos TD, Piechnik SK,Banypersad SM, Fontana M,Ntusi NB, Ferreira VM, et al.Noncontrast T1 mapping for the diagnosis of cardiac amyloidosis. JACC Cardiovasc Imaging 2013;6:488–97.
36. Robbers LF, Baars EN, Brouwer WP, Beek AM, Hofman MB,Niessen HW. T1 mapping shows increased extracellular matrix size in the myocardium due to amyloid depositions. Circ Cardiovasc Imaging 2012;5:423–6.
37. Ferreira VM, Piechnik SK,Dall’armellina E, Karamitsos TD, Francis JM, Ntusi N, et al.T Mapping for the diagnosis of acute myocarditis using CMR:comparison to T-weighted and late gadolinium enhanced imaging. JACC Cardiovasc Imaging 2013;6:1048–58.
38. Ferreira VM, Piechnik SK,Dall’Armellina E, Karamitsos TD,Francis JM, Ntusi N, et al. Native T1-mapping detects the location,extent and patterns of acute myocarditis without the need for gadolinium contrast agents. J Cardiovasc Magn Reson 2014;16:36.
39. Hinojar R, Foote L, Sangle S,Marber M, Mayr M, Carr-White G, et al. Native T1 and T2 mapping by CMR in lupus myocarditis: disease recognition and response to treatment. Int J Cardiol 2016;222:717–26.
40. Luetkens JA, Homsi R, Dabir D,Kuetting DL, Marx C, Doerner J,et al. Comprehensive cardiac magnetic resonance for short-term follow-up in acute myocarditis. J Am Heart Assoc 2016;5:e003603.
41. Lurz P, Luecke C, Eitel I,Fohrenbach F, Frank C, Grothoff M, et al. Comprehensive cardiac magnetic resonance imaging in patients with suspected myocarditis: the MyoRacer-Trial. J Am Coll Cardiol 2016;67:1800–11.
42. Bohnen S, Radunski UK, Lund GK, Kandolf R, Stehning C, Schnackenburg B, et al.Performance of t1 and t2 mapping cardiovascular magnetic resonance to detect active myocarditis in patients with recent-onset heart failure. Circ Cardiovasc Imaging 2015;8:e003073.
43. Mahmod M, Piechnik SK, Levelt E, Ferreira VM, Francis JM, Lewis A, et al. Adenosine stress native T1 mapping in severe aortic stenosis:evidence for a role of the intravascular compartment on myocardial T1 values. J Cardiovasc Magn Reson 2014;16:92.
44. Swoboda PP, McDiarmid AK,Erhayiem B, Broadbent DA,Dobson LE, Garg P, et al. Assessing myocardial extracellular volume by T1 mapping to distinguish hypertrophic cardiomyopathy from athlete’s heart. J Am Coll Cardiol 2016;67:2189–90.
45. Hinojar R, Varma N, Child N,Goodman B, Jabbour A, Yu C-Y, et al. T1 mapping in discrimination of hypertrophic phenotypes - hypertensive heart disease and hypertrophic cardiomyopathy: findings from the International T1 Multicenter CMR study. Circ Cardiovasc Imaging 2015;8:e003285.
46. Puntmann VO, Voigt T, Chen Z,Mayr M, Karim R, Rhode K, et al.Native T1 mapping in differentiation of normal myocardium from diffuse disease in hypertrophic and dilated cardiomyopathy. JACC Cardiovasc Imaging 2013;6:475–84.
47. Mongeon FP, Jerosch-Herold M,Coelho-Filho OR, Blankstein R,Falk RH, Kwong RY. Quanti fication of extracellular matrix expansion by CMR in in filtrative heart disease. JACC Cardiovasc Imaging 2012;5:897–907.
48. Weber KT, Brilla CG. Pathological hypertrophy and cardiac interstitium. Fibrosis and renin-angiotensin-aldosterone system. Circulation 1991;83:1849–65.
49. Kellman P, Wilson JR, Xue H,Bandettini WP, Shanbhag SM,Druey KM, et al. Extracellular volume fraction mapping in the myocardium, part 2: initial clinical experience. J Cardiovasc Magn Reson 2012;14:64.
50. Salerno M, Kramer CM. Advances in parametric mapping with CMR imaging. JACC Cardiovasc Imaging 2013;6:806–22.
51. Schelbert EB, Fonarow GC,Bonow RO, Butler J, Gheorghiade M. Therapeutic targets in heart failure: refocusing on the myocardial interstitium. J Am Coll Cardiol 2014;63:2188–98.
52. Inui K, Tachi M, Saito T, Kubota Y,Murai K, Kato K, et al. Superiority of the extracellular volume fraction over the myocardial T1 value for the assessment of myocardial fibrosis in patients with non-ischemic cardiomyopathy. Magn Reson Imaging 2016;34:1141–5.
53. Zeng M, Zhang N, He Y, Wen Z,Wang Z, Zhao Y, et al. Histological validation of cardiac magnetic resonance T1 mapping for detecting diffuse myocardial fibrosis in diabetic rabbits. J Magn Reson Imaging 2016 (e-pub PMID:27061226).
54. Aus dem Siepen F, Buss SJ,Messroghli D, Andre F, Lossnitzer D, Seitz S, et al. T1 mapping in dilated cardiomyopathy with cardiac magnetic resonance: quanti fi-cation of diffuse myocardial fibrosis and comparison with endomyocardial biopsy. Eur Heart J Cardiovasc Imaging 2014;16:210–6.
55. de Meester de Ravenstein C, Bouzin C, Lazam S, Boulif J, Amzulescu M, Melchior J, et al. Histological Validation of measurement of diffuse interstitial myocardial fibrosis by myocardial extravascular volume fraction from Modi fied Look-Locker imaging (MOLLI) T1 mapping at 3 T. J Cardiovasc Magn Reson 2015;17:48.
56. White SK, Sado DM, Fontana M, Banypersad SM, Maestrini V, Flett AS, et al. T1 mapping for myocardial extracellular volume measurement by CMR: bolus only versus primed infusion technique. JACC Cardiovasc Imaging 2013;6:955–62.
57. Treibel TA, Fridman Y, Hackman B, Kadakkal A, Sayeed A, Maanja M, et al. Extracellular volume associates with outcomes more strongly than native or post-contrast myocardial T1. Eur Heart J Cardiovasc Imaging Supplement 2016;17:i1–i80.
58. Mohammed SF, Hussain S,Mirzoyev SA, Edwards WD,Maleszewski JJ, Red field MM.Coronary microvascular rarefaction and myocardial fibrosis in heart failure with preserved ejection fraction. Circulation 2015;131:550–9.
59. Flett AS, Hayward MP, Ashworth MT, Hansen MS, Taylor AM, Elliott PM, et al. Equilibrium contrast cardiovascular magnetic resonance for the measurement of diffuse myocardial fibrosis: preliminary validation in humans. Circulation 2010;122:138–44.
60. Fontana M, White SK, Banypersad SM, Sado DM, Maestrini V, Flett AS, et al. Comparison of T1 mapping techniques for ECV quantification. Histological validation and reproducibility of ShMOLLI versus multibreath-hold T1 quanti fication equilibrium contrast CMR. J Cardiovasc Magn Reson 2012;14:88.
61. Rockey DC, Bell PD, Hill JA.Fibrosis–a common pathway to organ injury and failure. N Engl J Med 2015;372:1138–49.
62. Schwartzkopff B, Brehm M,Mundhenke M, Strauer BE. Repair of coronary arterioles after treatment with perindopril in hypertensive heart disease. Hypertension 2000;36:220–5.
63. Brilla CG, Funck RC, Rupp H.Lisinopril-mediated regression of myocardial fibrosis in patients with hypertensive heart disease.Circulation 2000;102:1388–93.
64. Izawa H, Murohara T, Nagata K,Isobe S, Asano H, Amano T, et al.Mineralocorticoid receptor antagonism ameliorates left ventricular diastolic dysfunction and myocardial fibrosis in mildly symptomatic patients with idiopathic dilated cardiomyopathy: a pilot study.Circulation 2005;112:2940–5.
65. Diez J, Querejeta R, Lopez B,Gonzalez A, Larman M, Martinez Ubago JL. Losartan-dependent regression of myocardial fibrosis is associated with reduction of left ventricular chamber stiffness in hypertensive patients. Circulation 2002;105:2512–7.
66. Heydari B, Abdullah S, Pottala JV,Shah R, Abbasi S, Mandry D, et al.Effect of omega-3 acid ethyl esters on left ventricular remodeling after acute myocardial infarction:the OMEGA-REMODEL randomized clinical trial. Circulation 2016;134:378–91.
67. Schelbert EB, Wong TC,Gheorghiade M. Think small and examine the constituents of left ventricular hypertrophy and heart failure: cardiomyocytes versus fibroblasts, collagen, and capillaries in the interstitium. J Am Heart Assoc 2015;4:e002491.
68. Kato S, Saito N, Kirigaya H,Gyotoku D, Iinuma N, Kusakawa Y,et al. Impairment of coronary flow reserve evaluated by phase contrast cine-magnetic resonance imaging in patients with heart failure with preserved ejection fraction. J Am Heart Assoc 2016;5:e002649.
69. Brilla CG, Janicki JS, Weber KT.Cardioreparative effects of lisinopril in rats with genetic hypertension and left ventricular hypertrophy.Circulation 1991;83:1771–9.
70. Rommel KP, von Roeder M,Latuscynski K, Oberueck C, Blazek S, Fengler K, et al. Extracellular volume fraction for characterization of patients with heart failure and preserved ejection fraction. J Am Coll Cardiol 2016;67:1815–25.
71. Zile MR, Baicu CF, J SI, Stroud RE, Nietert PJ, Bradshaw AD, et al.Myocardial stiffness in patients with heart failure and a preserved ejection fraction: contributions of collagen and titin. Circulation 2015;131:1247–59
72. Banypersad SM, Moon JC, Whelan C, Hawkins PN, Wechalekar AD.Updates in cardiac amyloidosis: a review. J Am Heart Assoc 2012;1:e000364.
73. Tamarappoo BK, John BT, Reinier K, Teodorescu C, Uy-Evanado A,Gunson K, et al. Vulnerable myocardial interstitium in patients with isolated left ventricular hypertrophy and sudden cardiac death: a postmortem histological evaluation. J Am Heart Assoc 2012;1:e001511.
74. Nadjiri J, Nieberler H, Hendrich E, et al. Performance of native and contrast-enhanced T1 mapping to detect myocardial damage in patients with suspected myocarditis: a head-to-head comparison of different cardiovascular magnetic resonance techniques.Int J Cardiovasc Imaging 2016.doi:10.1007/s10554-016-1029-3.
75. Ntusi NA, Piechnik SK, Francis JM, Ferreira VM, Matthews PM, Robson MD, et al. Diffuse myocardial fibrosis and in flammation in rheumatoid arthritis:insights from CMR T1 mapping.JACC Cardiovasc Imaging 2015;8:526–36.
76. Salazar G, Bellocchi C, Todoerti K, Saporiti F, Piacentini L, Scorza R, et al. Gene expression pro filing reveals novel protective effects of Aminaphtone on ECV304 endothelial cells. Eur J Pharmacol 2016;782:59–69.
77. Barison A, Gargani L, De Marchi D, Aquaro GD, Guiducci S, Picano E, et al. Early myocardial and skeletal muscle interstitial remodelling in systemic sclerosis: insights from extracellular volume quanti fication using cardiovascular magnetic resonance. Eur Heart J Cardiovasc Imaging 2015;16:74–80.
78. Treibel TA, Zemrak F, Sado DM, Banypersad SM, White SK,Maestrini V, et al. Extracellular volume quanti fication in isolated hypertension - changes at the detectable limits? J Cardiovasc Magn Reson 2015;17:74.
79. Coelho-Filho OR, Mongeon FP,Mitchell R, Moreno H, Jr, Nadruz W, Jr, Kwong R, et al. Role of transcytolemmal water-exchange in magnetic resonance measurements of diffuse myocardial fibrosis in hypertensive heart disease. Circ Cardiovasc Imaging 2013;6:134–41.
80. Wong TC, Piehler K, Kang IA,Kadakkal A, Kellman P, et al.Myocardial extracellular volume fraction quanti fied by cardiovascular magnetic resonance is increased in diabetes and associated with mortality and incident heart failure admission. Eur Heart J 2014;35:657–64.
81. Shah RV, Abbasi SA, Neilan TG,Hulten E, Coelho-Filho O, Hoppin A, et al. Myocardial tissue remodeling in adolescent obesity. J Am Heart Assoc 2013;2:e000279.
82. Su MY, Lin LY, Tseng YH, Chang CC, Wu CK, Lin JL, et al. CMR-veri fied diffuse myocardial fibrosis is associated with diastolic dysfunction in HFpEF. JACC Cardiovasc Imaging 2014;7:991–7.
83. Wong TC. Cardiovascular magnetic resonance imaging of myocardial interstitial expansion in hypertrophic cardiomyopathy.Curr Cardiovasc Imaging Rep 2014;7:9267.
84. Ho CY, Abbasi SA, Neilan TG,Shah RV, Chen Y, Heydari B,et al. T1 measurements identify extracellular volume expansion in hypertrophic cardiomyopathy sarcomere mutation carriers with and without left ventricular hypertrophy. Circ Cardiovasc Imaging 2013;6:415–22.
85. Wong TC, Piehler K, Meier CG,Testa SM, Klock AM, Aneizi AA,et al. Association between extracellular matrix expansion quantified by cardiovascular magnetic resonance and short-term mortality.Circulation 2012;126:1206–16.
86. Beltrami CA, Finato N, Rocco M,Feruglio GA, Puricelli C, Cigola E, et al. Structural basis of endstage failure in ischemic cardiomyopathy in humans. Circulation 1994;89:151–63.
87. Fontana M, White SK, Banypersad SM, Sado DM, Maestrini V, Flett AS, et al. Comparison of T1 mapping techniques for ECV quantification. Histological validation and reproducibility of ShMOLLI versus multibreath-hold T1 quanti fication equilibrium contrast CMR. J Cardiovasc Magn Reson 2012;14:88.
88. Duca F, Kammerlander AA,Zotter-Tufaro C, Aschauer S,Schwaiger ML, Marzluf BA, et al.Interstitial fibrosis, functional status, and outcomes in heart failure with preserved ejection fraction:insights from a prospective Cardiac Magnetic Resonance Imaging Study. Circ Cardiovasc Imaging 2016;9:e005277.
89. McDiarmid AK, Swoboda PP,Erhayiem B, Ripley DP, Kidambi A, Broadbent DA, et al. Single bolus versus split dose gadolinium administration in extra-cellular volume calculation at 3 Tesla. J Cardiovasc Magn Reson 2015;17:6.
90. Kawel N, Nacif M, Zavodni A, Jones J, Liu S, Sibley CT, et al. T1 mapping of the myocardium: intra-individual assessment of post-contrast T1 time evolution and extracellular volume fraction at 3T for Gd-DTPA and Gd-BOPTA. J Cardiovasc Magn Reson 2012;14:26.
91. Chin CW, Semple S, Malley T,White AC, Mirsadraee S, Weale PJ,et al. Optimization and comparison of myocardial T1 techniques at 3T in patients with aortic stenosis.Eur Heart J Cardiovasc Imaging 2014;15:556–65.
92. Singh A, Hors field MA, Bekele S,Khan J, Greiser A, McCann GP.Myocardial T1 and extracellular volume fraction measurement in asymptomatic patients with aortic stenosis: reproducibility and comparison with age-matched controls.Eur Heart J Cardiovasc Imaging 2015;16:763–70.
93. Liu S, Han J, Nacif MS, Jones J,Kawel N, Kellman P, et al. Diffuse myocardial fibrosis evaluation using cardiac magnetic resonance T1 mapping: sample size considerations for clinical trials. J Cardiovasc Magn Reson 2012;14:90.
94. Ghosn MG, Pickett S, Brunner G,Nabi F, Zoghbi W, Quinones M,et al. Association of myocardial extracellular volume and clinical outcome: a cardiac magnetic resonance study (Abstract). J Am Coll Cardiol 2015;65:A1077.
95. Butler J, Fonarow GC, Zile MR,Lam CS, Roessig L, Schelbert EB, et al. Developing therapies for heart failure with preserved ejection fraction: current state and future directions. JACC Heart Fail 2014;2:97–112.
96. Senni M, Paulus WJ, Gavazzi A,Fraser AG, Diez J, Solomon SD,et al. New strategies for heart failure with preserved ejection fraction:the importance of targeted therapies for heart failure phenotypes.Eur Heart J 2014;35:2797–815.
97. Vaduganathan M, Greene SJ,Ambrosy AP, Gheorghiade M,Butler J. The disconnect between phase II and phase III trials of drugs for heart failure. Nat Rev Cardiol 2013;10:85–97.
 Cardiovascular Innovations and Applications2016年4期
- Cardiovascular Innovations and Applications的其它文章
- Do Modern Imaging Studies Trump Cardiovascular Physical Exam in Cardiac Patients?
- Fractional Flow Reserve Measurement by Coronary Computed Tomography Angiography:A Review with Future Directions
- Novel Approaches for the Use of Cardiac/ Coronary Computed Tomography Angiography
- Coronary Calcium Scoring in 2017
- Magnetic Resonance Imaging of Coronary Arteries: Latest Technical Innovations and Clinical Experiences
- The Role of Clinical Cardiac Magnetic Resonance Imaging in China: Current Status and the Future