开口型管道内瓦斯爆炸冲击波动压的数值模拟*
洪溢都,林柏泉,朱传杰
(中国矿业大学安全工程学院煤炭资源与安全开采国家重点实验室,江苏 徐州 221116)
开口型管道内瓦斯爆炸冲击波动压的数值模拟*
洪溢都,林柏泉,朱传杰
(中国矿业大学安全工程学院煤炭资源与安全开采国家重点实验室,江苏 徐州 221116)
为了研究瓦斯爆炸冲击波的动压演化规律,利用数值模拟软件模拟开口型管道内的爆炸。结果表明:动压与流速在时间上存在较好的对应关系,基本同时出现正向和反向的峰值;动压在3个方向上不仅伴随传播距离的增大而不断增大,也伴随传播时间的延长而增大;沿管道方向(火焰传播方向)上的最大动压值是其他2个方向(管道径向)上的数千倍;相比爆炸超压而言,管道径向上的动压对爆炸破坏效应的影响较小,而沿管道方向上的动压造成的破坏效应不能忽视;验证了动压与流速的平方呈正比关系,同时通过分析给出了动压基于管道几何尺寸和流速的经验公式。
爆炸力学;动压;管道尺寸;瓦斯爆炸;开口型管道;流速
煤炭作为主要能源,在国民经济的发展中占据着至关重要的地位。在众多的煤矿安全事故中,瓦斯爆炸事故无论是死亡人数、经济损失还是发生次数,都一直占据较大比重[1-5]。因此,煤矿瓦斯爆炸事故防治仍将是未来很长一段时间煤矿安全的重点。当前,对瓦斯爆炸的研究主要集中于对冲击波超压,波前瞬态流速和火焰传播速度的研究,而对动压缺乏足够的研究[6-10]。过去通常只考虑冲击波超压造成的爆炸伤害,而忽略了动压所造成的伤害。在此前的研究中,发现动压事实上和冲击波超压具有同等数量级的危害效果。因此,本文想要就动压的演化规律进行一些有益的探讨。应该说明的是,本文中研究的动压是指流体在流动过程中受阻时,由于动能转变为压力能而引起的超过流体静压力部分的压力[11]。S.Glasstone[12],G.F.Kinney等[13],L.D.Landau等[14]和M.J.Zucrow等[15]通过研究得到了动压的计算公式以及动压变化规律的主要影响因素。这些公式均基于爆炸冲击波的质量、动量和能量守恒假设,并依据Rankine-Hugoniot条件为基础而得出。朱传杰[16]通过数值模拟的方法研究瓦斯爆炸,得到了动压在管道系统内的一些基本演化特征。这些研究或仅基于理论推导,或爆炸环境只考虑了不受限环境,或对动压只进行了定性的描述,而且在煤矿井下,其巷道系统类似于开口型管道系统。因而,有必要完善动压的研究,观察其在受限空间内的变化规律,并给出相应的定量描述。
针对瓦斯爆炸的研究中主要是矿井实验、管道实验和数值模拟。矿井实验由于准备繁复,耗资巨大,无法反复进行;而利用管道进行实验时,由于目前测量手段的局限性,测点的设置无形中改变了管壁粗糙度,对气体的流动状态有很大的影响,进而改变了瓦斯爆炸参数的变化规律;但是用数值模拟的方法可以避免以上情况的出现。目前应用较多的计算软件主要是AutoReaGas和FLACS,这2种软件广泛应用于石油、化工和天然气的危险评估当中,而且有些学者也将其应用于煤矿瓦斯爆炸研究中,并取得一些很好的成果[17-21]。AutoReaGas和FLACS相比较而言,AutoReaGas的预测值稍微偏高,但是设计煤矿瓦斯爆炸的保护措施应该保留一定的安全余量,因此选用AutoReaGas进行数值模拟。
本文中拟通过AutoReaGas软件模拟开口型巷道系统内爆燃波的传播过程,得到动压的传播演化规律,以期为全面了解瓦斯爆炸参数的演化规律提供参考。
1 数值模型及其验证
1.1 数值模型
AutoReaGas是三维计算流体分析软件,主要用来模拟气体爆炸与由此引发的冲击波效应。 专门设计用在那些非常拥塞(如管道工程管和设备)和限制(由于建筑物/结构,包括通风口等)的场所,这些场所对燃烧加速有很重要的影响,从而引起超压。AutoReaGas软件在模拟气体爆炸方面,其可靠性得到了多方的验证和认可[22-24]。数值模型中的气体动力学过程用质量、动量和能量守恒方程来表示。湍流作为气体燃烧爆炸的重要因素,采用k-ε模型。燃烧反应过程简化成基元反应,即甲烷与氧气直接生成二氧化碳和水。燃烧速率Rc表示为[25]:
(1)
式中:Ct为量纲一因数,ρ为可燃混合气体的密度,kg/m3;Γ是湍流扩散系数,Rmin可燃物、氧气和燃烧产物各自所占的质量分数中的最小值。
湍流燃烧速度St表示为[26]:
St=1.8ut0.412Lt0.196Sl0.784ν-0.196
(2)
式中:ut为湍流强度,Lt为湍流的特征长度,m;Sl为层流火焰燃烧速度,m/s;ν是运动黏度,N·s/m2。数值模拟中的其余设置参数参考A.C.Van den Berg等[27]的研究。
初始阶段的层流燃烧速率按照准层流模型处理。Fs是另外一个重要的修正系数,主要是为了修正压力、温度和火焰前沿褶皱对层流燃烧速度的影响。St是湍流火焰速度,其和Fs、火焰半径r和理论层流火焰速度Sl的关系表示为[28]:
St=Sl(1+Fsr)
(3)
数值计算相关的初始参数可详见文献[29]。
1.2 实验验证
有学者曾利用实验矿井进行了大量实验,以提高数值模拟的可靠程度,研究中发现只要数值模拟结果与实际实验误差值在±47%以内时,数值模拟的结果就能够满足工程现场的需要[30-31]。C.J.Lea等[32]也通过实验证实了AutoReaGas软件的模拟可靠性。因此,为了保证数值计算结果的准确性,通过相关实验进行验证,利用实验数据与数值计算结果的对比来验证网格划分的合理性以及模型的选取合理性。模型验证实验选取的实验管道长为5 m,横截面为8 cm×8 cm。在对比参数的选取上,采用实验方法易于获得的爆炸超压值[33]。
1.2.1 实验设备
实验管道示意图如图1所示。管道左端为封闭端,也是点火端,管道右端开放;压力测点自管道左端0.5 m开始布置,每隔0.5 m安置1个,总共9个,火焰测点安装在管道左端0.25 m处,起触发开关用,采用电点火方式,点火能量是2 J 。实验气体体积分数为9.5%,环境温度约25 ℃,管道内壁光滑,粗糙度可视为零。这些参数在数值模拟当中也以相同数值设定,包括点火方式的选择。

图1 实验管道示意图Fig.1 Schematic of the experimental pipe

图2 爆炸超压数值模拟与实验结果对比 Fig.2 Comparison of explosion overpressure between simulation and experiment
1.2.2 实验结果和数值模拟的结果的对比
数值模拟中选取2种网格进行对比。一种是每个网格尺寸为2 cm×2 cm×2 cm,另一种每个网格的尺寸为4 cm×4 cm×4 cm,2种不同网格所得的模拟结果与实验结果对比如表1所示。从表1中可以清晰地发现,尺寸为2 cm×2 cm×2 cm的网格划分所得的数值模拟结果与实际吻合更好。进而,利用2 cm×2 cm×2 cm的网格划分法进行了更深入的研究。图2所示的是爆炸超压的数值模拟结果与实验数据的对比,从中可以看出数值模拟结果能与实验数据吻合较好,数值模拟与实验数据之间的最大偏差绝对值是8.35%,明显小于47%。因此,认为数值模型和网格划分具有较大的可靠性。

表1 不同网格划分方法下的数值模拟结果与实验结果对比Table 1 Comparison between experimental data and simulation results by different methods of grid partitioning
2 结果与分析
2.1 动压随时间的演化规律
动压作为气体流动的直观体现,其产生和变化被气体运动情况所控制。由于动压随时间的演化规律在不同管道中具有一致的变化特征,此处只选取横截面为8 cm×8 cm、管长为20 m内的部分测点情况进行比较,如图3所示。由图3可以看出,动压随时间的变化规律与流速的变化规律在不同测点都基本一致。应该说明的是,本文中所指的流速是冲击波速度,不是火焰传播速度。以10.5 m处的情况为例,前驱冲击波的到来使得流速出现首个正向峰值,与此同时,动压也对应出现首个正向峰值。而后,前驱冲击波过后,流速出现回落,动压也相应回落。接着,火焰锋面的到来使得流速再次出现正向峰值,而动压也同时出现第2个正向峰值。火焰锋面过后,测点附近的气流呈现反向流动,因而流速出现反向峰值,而动压也相应地出现反向峰值,但是其值较小。最后,波阵面以对外做功和热传递的方式不断损耗能量,最终气体不再运动,动压和流速也趋于零。

图3(a) 0.5 m处动压与流速的时间对应关系Fig.3(a) Relationship between dynamic pressure and gas velocity at the point of 0.5 m

图3(b) 2.5 m处动压与流速的时间对应关系Fig.3(b) Relationship between dynamic pressure and gas velocity at the point of 2.5 m

图3(c) 4.5 m处动压与流速的时间对应关系Fig.3(c) Relationship between dynamic pressure and gas velocity at the point of 4.5 m

图3(d) 6.5 m处动压与流速的时间对应关系Fig.3(d) Relationship between dynamic pressure and gas velocity at the point of 6.5 m

图3(e) 8.5 m处动压与流速的时间对应关系Fig.3(e) Relationship between dynamic pressure and gas velocity at the point of 8.5 m

图3(f) 10.5 m处动压与流速的时间对应关系Fig.3(f) Relationship between dynamic pressure and gas velocity at the point of 10.5 m

图3(g) 12.5 m处动压与流速的时间对应关系Fig.3(g) Relationship between dynamic pressure and gas velocity at the point of 12.5 m

图3(h) 14.5 m处动压与流速的时间对应关系Fig.3(h) Relationship between dynamic pressure and gas velocity at the point of 14.5 m

图3(i) 16.5 m处动压与流速的时间对应关系Fig.3(i) Relationship between dynamic pressure and gas velocity at the point of 16.5 m

图3(j) 18.5 m处动压与流速的时间对应关系Fig.3(j) Relationship between dynamic pressure and gas velocity at the point of 18.5 m

图4 动压的正向峰值与传播距离的关系Fig.4 Relationship between dynamic pressure peak and propagation distance
从图3中也可看出,动压的首个正向峰值总是比第2个正向峰值大。0.5 m处,首个正向峰值是4.00 kPa,第2个正向峰值是0.16 kPa;2.5 m处,首个正向峰值是25.28 kPa,第2个正向峰值是5.68 kPa;4.5 m处,首个正向峰值是55.67 kPa,第2个正向峰值是15.72 kPa;6.5m处,首个正向峰值是90.10 kPa,第2个正向峰值是26.90 kPa;8.5 m处,首个正向峰值是122.77 kPa,第2个正向峰值是37.67 kPa;10.5 m处,首个正向峰值是158.34 kPa,第2个正向峰值是47.67 kPa;12.5 m处,首个正向峰值是197.25 kPa,第2个正向峰值是56.56 kPa;14.5 m处,首个正向峰值是239.46 kPa,第2个正向峰值是64.24 kPa;16.5 m处,首个正向峰值是286.69 kPa,第2个正向峰值是70.46 kPa;18.5 m处,首个正向峰值是343.04 kPa,第2个正向峰值是74.9 kPa。除了0.5 m处,动压的首个峰值是第2个峰值的25倍,其余测点位置的动压的首个正向峰值基本上是第2个正向峰值的3~4倍。这或许可说明前驱冲击波对动压的影响要大于火焰锋面对动压的影响。而且首个正向峰值和第2个正向峰值伴随传播距离的增大而不断增大,原因在于动压与流速的二次方呈正比关系,而流速伴随传播距离的增大不断增大的,如图4所示。通过拟合得到动压首个正向峰值和第2个正向峰值与传播距离x的关系方程:
(4)

(5)


图5(a) 动压在x方向随时间的变化规律 Fig.5(a) Dynamic pressure in x direction varying with time
2.2 动压在的3个方向的演化规律


图5(b) 动压在y方向随时间的变化规律Fig.5(b) Dynamic pressure in y direction varying with time

图5(c) 动压在z方向随时间的变化规律Fig.5(c) Dynamic pressure in z direction varying with time
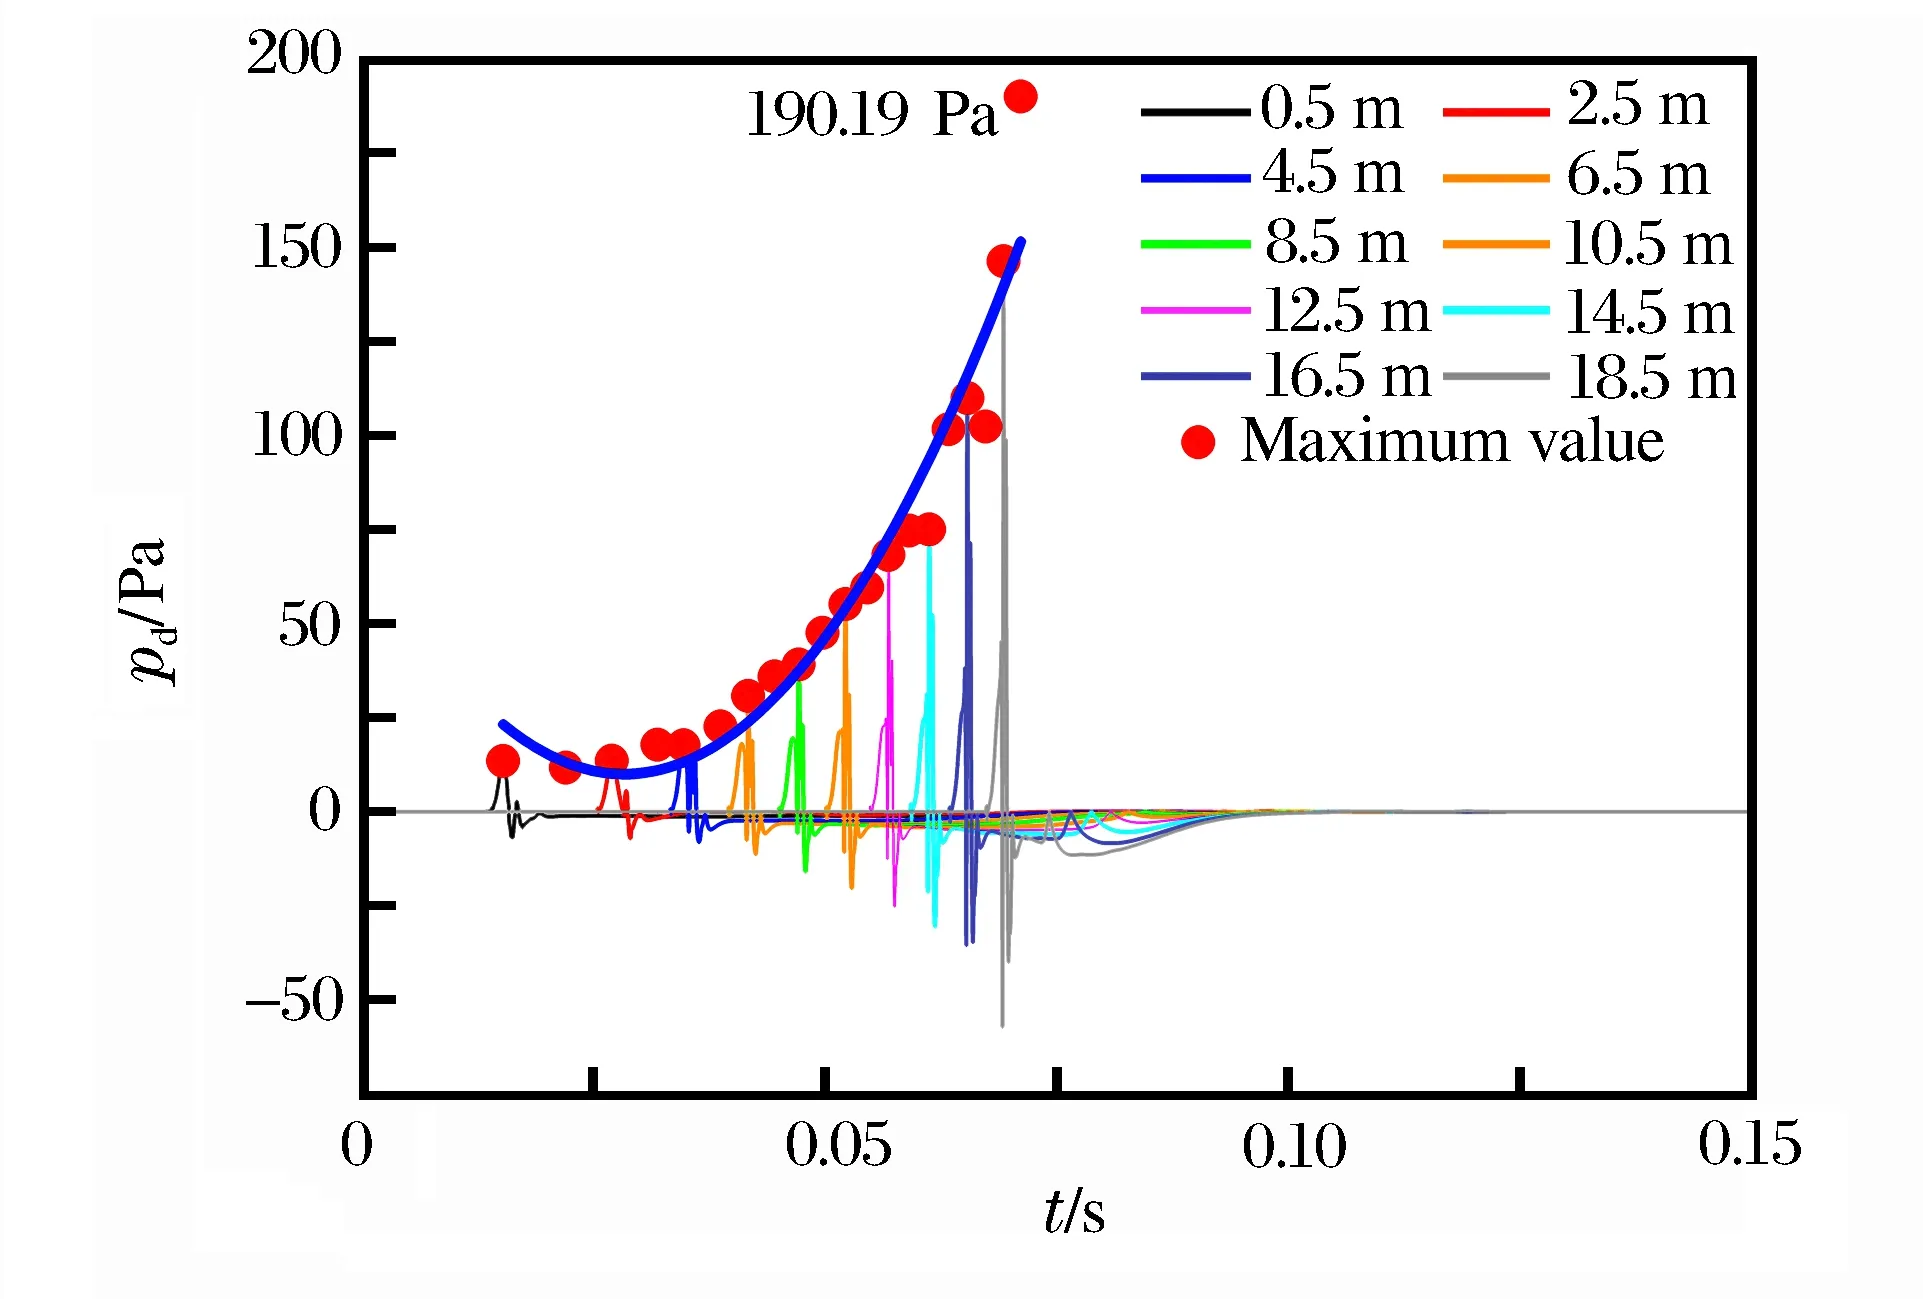
通过数值模拟可以直接获得动压的变化规律。在管道横截面为8 cm×8 cm,管长为20 m的情况下模拟得到的3个方向(x、y、z)的爆炸动压如图5所示。应该说明的是,x方向指的是管道的纵向方向,即爆燃波的传播方向;而y和z方向是管道的径向上的2个方向。由于我们关心压力大小,因而在研究动压在3个向的变化时并不考虑正负。从图中可清晰看出,动压的变化规律分为前后2个部分,结合图3可知,后一部分的动压产生源于火焰锋面的影响。相较而言,前一部分的动压值要大得多,因而只关注前一部分的动压在3个方向演化规律。由图5可知,动压的最大值在3个方向上都随爆炸传播距离的增大而逐渐变大。此外,动压最大值也是伴随传播时间的增大而不断增大。换而言之,前一部分动压直观体现了前驱冲击波在管道内传播过程中伴随时间的变化规律。在通过拟合最大动压值和传播时间关系中可清晰看出两者呈明显的正相关,各个方向上的最大动压值随时间的拟合方程:
pd,x=35.78-3 496.18t+117 289.30t2R2=0.997 3
(6)
pd,y=74.52-4 541.67t+79 672.25t2R2=0.940 3
(7)
pd,z=72.27-4 389.59t+77 441.29t2R2=0.940 3
(8)
式中:pd,x(kPa)、pd,y(Pa)和pd,z(Pa)为x、y和z方向上的最大动压值。
在爆炸传播方向(x方向)上的最大动压值要远大于其他方向(y、z)上的最大动压值,以19.5 m处测点为例,x方向上为381.13 kPa,y方向上为190.29 Pa,z方向上为190.19 Pa,这说明x方向上的最大动压值是其他2个方向上的最大动压值的数千倍。与爆炸超压(静压)相较而言,y和z方向上的动压显然小几个数量级。因此,在探究开口型系统内的爆炸破坏效应时,y和z方向的动压影响基本可以不考虑。但是x方向上的动压则较大,所以探究爆炸破坏效应时需将它的影响考虑在内。
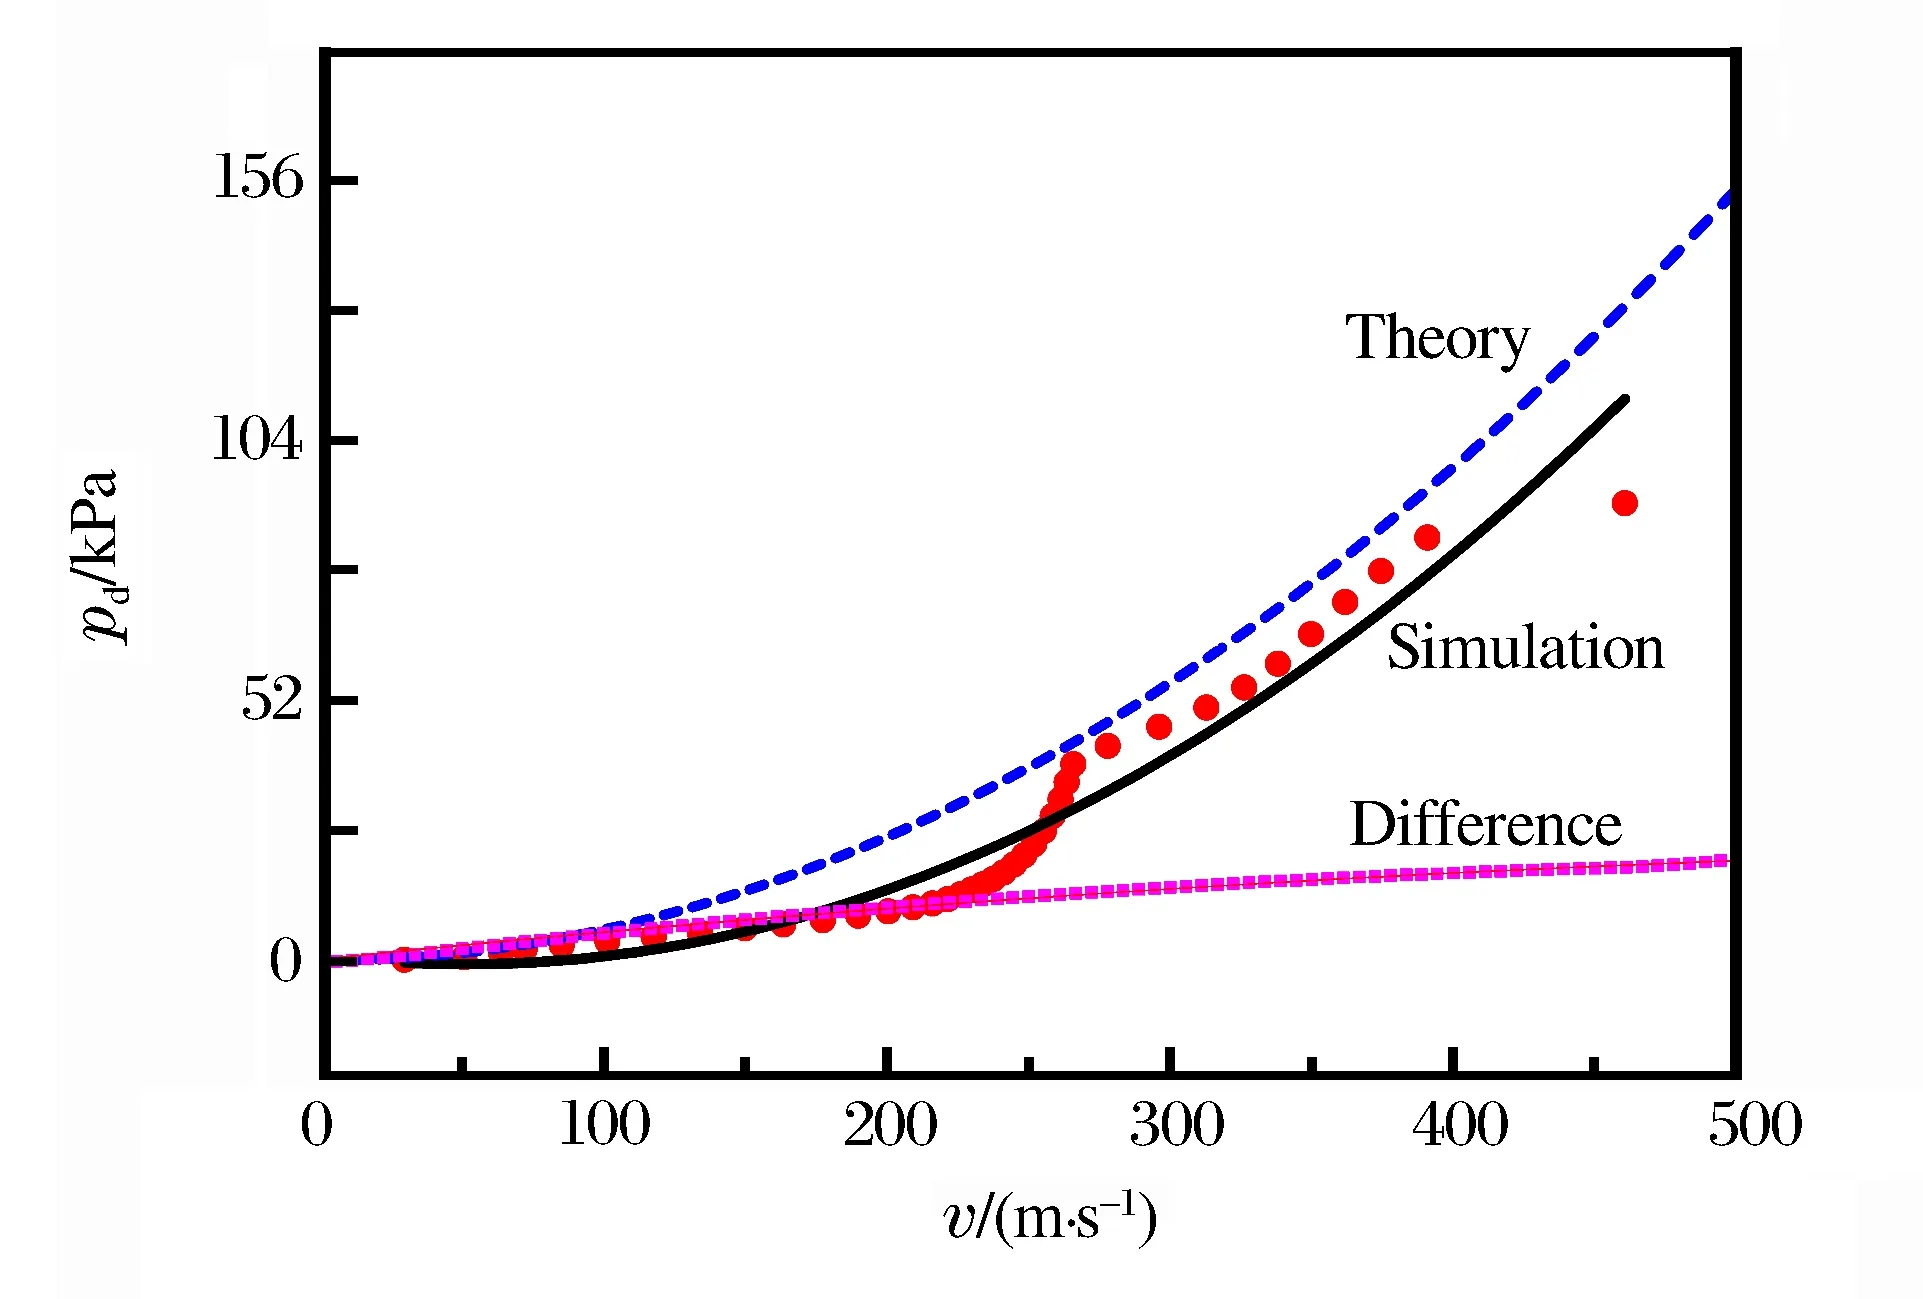
2.3 动压和流速的定量关系

图6(a) 在管道尺寸L/a=16.7时动压与流速的定量关系Fig.6(a) Relationship between dynamic pressure and gas velocity behind the shock wave in the pipe with a geometrical size L/a=16.7

图6(b) 在管道尺寸L/a=25时动压与流速的定量关系Fig.6(b) Relationship between dynamic pressure and gas velocity behind the shock wave in the pipe with a geometrical size L/a=25

图6(c) 在管道尺寸L/a=33.3时动压与流速的定量关系Fig.6(c) Relationship between dynamic pressure and gas velocity behind the shock wave in the pipe with a geometrical size L/a=33.3

图6(d) 在管道尺寸L/a=50时动压与流速的定量关系Fig.6(d) Relationship between dynamic pressure and gas velocity behind the shock wave in the pipe with a geometrical size L/a=50

图6(e) 在管道尺寸L/a=50时动压与流速的定量关系Fig.6(e) Relationship between dynamic pressure and gas velocity behind the shock wave in the pipe with a geometrical size L/a=50

图6(f) 在管道尺寸L/a=62.5时动压与流速的定量关系Fig.6(f) Relationship between dynamic pressure and gas velocity behind the shock wave in the pipe with a geometrical size L/a=62.5

图6(g) 在管道尺寸L/a=66.7时动压与流速的定量关系Fig.6(g) Relationship between dynamic pressure and gas velocity behind the shock wave in the pipe with a geometrical size L/a=66.7

图6(h) 在管道尺寸L/a=75时动压与流速的定量关系Fig.6(h) Relationship between dynamic pressure and gas velocity behind the shock wave in the pipe with a geometrical size L/a=75

图6(i) 在管道尺寸L/a=100时动压与流速的定量关系Fig.6(i) Relationship between dynamic pressure and gas velocity behind the shock wave in the pipe with a geometrical size L/a=100

图6(j) 在管道尺寸L/a=125时动压与流速的定量关系Fig.6(j) Relationship between dynamic pressure and gas velocity behind the shock wave in the pipe with a geometrical size L/a=125

图6(k) 在管道尺寸L/a=187.5时动压与流速的定量关系Fig.6(k) Relationship between dynamic pressure and gas velocity behind the shock wave in the pipe with a geometrical size L/a=187.5

图6(l) 在管道尺寸L/a=250时动压与流速的定量关系Fig.6(l) Relationship between dynamic pressure and gas velocity behind the shock wave in the pipe with a geometrical size L/a=250
图6中管道尺寸相关参量L/a下各条偏差曲线均为二次函数,设二次函数为:y=Ax2+Bx+C,则当L/a=16.7时,偏差曲线方程为y=1 143.33-25.3x+0.408x2;当L/a=25时,偏差曲线方程为y=2 177.87-46.58x+0.433x2;当L/a=33.3时,偏差曲线方程为y=2 694.04-50.63x+0.36x2;当L=10 m、a=20 cm,L/a=50时,偏差曲线方程为y=2 890.10-22.49x+0.2x2,改变L和a的值,当L=15 m、a=30 cm时,L/a仍为50, 偏差曲线方程为y=5 822.06-65.5x+0.31x2;当L/a=62.5时,偏差曲线方程为y=-18 075.87-207.66x-0.083x2;当L/a=66.7时,偏差曲线方程为y=229.22-58.11x-0.037x2;当L/a=75时,偏差曲线方程为y=-3 853.72+113.67x-0.133x2;当L/a=100时,偏差曲线方程为y=-16 261.77+251.21x-0.322x2;当L/a=125时,偏差曲线方程为y=-13 434.32+57.42x+0.23x2;当L/a=187.5时,偏差曲线方程为y=-3 959.33-38.65x+0.287x2;当L/a=250时,偏差曲线方程为y=-12 902.61+25.43x+0.106x2。
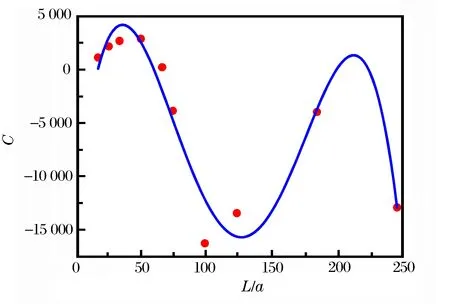
将所有偏差曲线的二次项系数A提取出来,与相对应的L/a值结合,分别得到12个离散点:(16.7,0.408)、(25,0.433)、(33.3,0.360)、(50,0.200)、(50,0.310)、(62.5,-0.083)、(66.7,-0.037)、(75,-0.133)、(100,-0.322)、(125,0.230)、(187,0.287)、(250,0.106);将一次项系数B提取出来,与相对应的L/a值结合,分别得到12个离散点:(16.7,-25.30)、(25,-46.58)、(33.3,-50.63)、(50,-22.49)、(50,-65.50)、(62.5,207.66)、(66.7,58.11)、(75,113.67)、(100,251.21)、(125,57.42)、(187.5,-38.65)、(250,25.43);最后再将常数项C提取出来,又得到12个离散点:(16.7,1143.33)、(25,2 177.87)、(33.3,2 694.04)、(50,2 890.10)、(50,5 822.06)、(62.5,-18 075.87)、(66.7,229.22)、(75,-3 853.72)、(100,-16 261.77)、(125,-13 434.32)、(187,-3 959.33)、(250,-12 902.61)。
将这些点拟合可以得到3条曲线,如图7所示,得到关于二次项系数A的方程为:

R2=0.827
(9)
关于一次项系数B的方程为:

R2=0.692
(10)
关于常数项C的方程为:

R2=0.885
(11)

(12)

图7(a) 偏差曲线方程中二次项系数与管道尺寸拟合关系Fig.7(a) Relationship between quadratic coefficient and pipe size

图7(b) 偏差曲线方程中一次项系数与管道尺寸拟合关系 Fig.7(b) Relationship between monomial coefficient and pipe size

图7(c) 偏差曲线方程中常数项与管道尺寸拟合关系Fig.7(c) Relationship between constant and pipe size
3 结 论
(1)动压与流速在时间上存在较好的对应关系,基本同时出现正向和反向的峰值。而且动压的首个正向峰值总是比第2个正向峰值大数倍,这说明前驱冲击波对动压的影响要大于火焰锋面对动压的影响。此外,还给出了动压的首个正向峰值和第2个正向峰值基于传播距离的预测方程。
(2)动压在管道的纵向和管道径向上的变化规律较为简单,都伴随这传播距离的增大而不断增大,同时也伴随传播时间的增大而增大。火焰传播方向(管道纵向)上的最大动压值要比其他2个方向上的最大动压值大数千倍。相较爆炸超压而言,管道径向上动压对爆炸破坏效应的影响极其有限,但是火焰传播方向上的动压对爆炸破坏效应的影响不可忽略。此外,还给出了各个方向上最大动压值基于传播时间的预测方程。
(3)在对动压与流速的关系的研究中,验证了动压与流速的平方呈正比关系。此外,由于实际密度小于理论密度,是故所得实验曲线会低于理论曲线。同时通过分析给出了动压基于长径比和流速的经验公式,可为下一步管道实验内的动压研究提供参考。
[1] 李波,王凯,魏建平,等.2001-2012年我国煤与瓦斯突出事故基本特征及发生规律研究[J].安全与环境学报,2013,13(3):274-278. Li Bo, Wang Kai, Wei Jianping, et al. On the basic characteristic features and incidental regularity of coal and gas outbursts in China since from 2001 to 2012[J]. Journal of Safety and Environment, 2013,13(3):274-278.
[2] 殷文韬,傅贵,袁沙沙,等.2001-2012年我国重特大瓦斯爆炸事故特征及发生规律研究[J].中国安全科学学报,2013(2):141-147. Yin Wentao, Fu Gui, Yuan Shasha, et al. Study on basic characteristics and occurrence regularity of major gas explosion accidents in Chinese coal mines during 2001-2012[J]. China Safety Science Journal, 2013(2):141-147.
[3] 黄平,李晋杰,杨珊.中国煤矿安全生产事故统计分析[C]∥国际安全科学与技术学术研讨会.沈阳,2012.
[4] 朱月敏.煤矿安全事故统计分析[D].阜新:辽宁工程技术大学,2011.
[5] 王佑安,王震宇,梁运涛.中国煤炭工业发展和安全事故总貌的统计分析和建议[C]∥全国煤矿安全学术年会.广州,2012.
[6] 林柏泉,周世宁,张仁贵.障碍物对瓦斯爆炸过程中火焰和爆炸波的影响[J].中国矿业大学学报,1999(2):6-9. Lin Baiquan, Zhou Shining, Zhang Rengui. Influence of barriers on flame transmission and explosion wave in gas explosion[J]. Journal of China University of Mining and Technology, 1999(2):6-9.
[7] Klemens R, Zydak P, Kaluzny M, et al. Dynamics of dust dispersion from the layer behind the propagating shock wave[J]. Journal of Loss Prevention in the Process Industries, 2006, 19(2/3):200-209.
[8] Ciccarelli G, Johansen C T, Parravani M. The role of shock-flame interactions on flame acceleration in an obstacle laden channel[J]. Combustion and Flame, 2010,157(11):2125-2136.
[9] Johansen C T, Ciccarelli G. Visualization of the unburned gas flow field ahead of an accelerating flame in an obstructed square channel[J]. Combustion and Flame, 2009,156(2):405-416.
[10] Ciccarelli G, Dorofeev S. Flame acceleration and transition to detonation in ducts[J]. Progress in Energy and Combustion Science, 2008,34(4):499-550.
[11] 吴望一.流体力学[M].北京:北京大学出版社,2010.
[12] Glasstone S. The effects of nuclear weapons[R]. US Department of Defense, 1964.
[13] Kinney G F, Graham K J. Explosive shocks in air[M]. Berlin and New York: Springer-Verlag, 1985:282.
[14] Landau L D, Lifshitz E M. Fluid mechanics[J]. Course of Theoretical Physics, 1987,46(10):346-369.
[15] Zucrow M J, Hoffman J D. Gas dynamics[M]. New York: John Wiley and Sons, Inc, 1976.
[16] 朱传杰.爆炸冲击波前流场扬尘特征及其多相破坏效应[D].徐州:中国矿业大学,2011.
[17] Jiang Bingyou, Lin Baiquan, Shi Shulei, et al. A numerical simulation of the influence initial temperature has on the propagation characteristics of, and safe distance from, a gas explosion[J]. International Journal of Mining Science and Technology, 2012,22(3):307-310.
[18] Maremonti M, Russo G, Salzano E, et al. Numerical simulation of gas explosions in linked vessels[J]. Journal of Loss Prevention in the Process Industries, 1999,12(3):189-194.
[19] Pang L, Zhang Q, Wang T, et al. Influence of laneway support spacing on methane/air explosion shock wave[J]. Safety Science, 2012,50(1):83-89.
[20] Janovsky B, Selesovsky P, Horkel J, et al. Vented confined explosions in stramberk experimental mine and AutoReaGas simulation[J]. Journal of Loss Prevention in the Process Industries, 2006,19(2):280-287.
[21] Popat N R, Catlin C A, Arntzen B J, et al. Investigations to improve and assess the accuracy of computational fluid dynamic based explosion models[J]. Journal of Hazardous Materials, 1996,45(1):1-25.
[22] Zhu C J, Lin B Q, Jiang B Y. Flame acceleration of premixed methane/air explosion in parallel pipes[J]. Journal of Loss Prevention in the Process Industries, 2012,25(2):383-390.
[23] 朱传杰,林柏泉,江丙友,等.受限空间内爆燃波瞬态流速与超压的耦合关系[J].燃烧科学与技术,2012,18(4):326-330. Zhu Chuanjie, Lin Baiquan, Jiang Bingyou, et al. Coupled relationship between gas velocity and peak overpressure of deflagration wave in confined space[J]. Journal of Combustion Science and Technology, 2012,18(4):326-330.
[24] 朱传杰,林柏泉,江丙友,等.瓦斯爆炸在封闭管道内冲击波振荡特征的数值模拟[J].振动与冲击, 2012,31(16):8-12. Zhu Chuanjie, Lin Baiquan, Jiang Bingyou, et al. Numerical simulation on oscillation and shock of gas explosion in a closed end pipe[J]. Journal of Vibration and Shock, 2012,31(16):8-12.
[25] Zipf R K, , Sapko M J, Brune J F. Explosion pressure design criteria for new seals in U S coal mines[S]. Pittsburgh, Pennsylvania: The National Institute for Occupational Safety and Health (NIOSH), 2007.
[26] Bray K N C. Studies of the turbulent burning velocity[C]∥Proceedings of the Royal Society of London, Series A: Mathematical and Physical Sciences, 1990(431):315-335.
[27] Van Den Berg A C, Mercx W P M, Mouilleau Y V, et al. AutoReaGas: A CFD tool for gas explosion hazard analysis[C]∥International Conference and Exhibition Offshore Structure Design, Hazards, Safety & Engineering. London, UK, 1994.
[28] Bakke J R. Numerical simulation of gas explosions in two-dimensional geometries[R]. Christian Michelsen Institute, 1986.
[29] AutoReaGas user manual version 3.1[M]. Century Dynamic Inc, 2002.
[30] Oran E S, Boris J P, Young T, et al. Numerical simulations of detonations in hydrogen-air and methane-air mixtures[J]. Symposium on Combustion, 1981,18(1):1641-1649.
[31] Zipf R K, Gamezob V N, Sapkoa M J, et al. Methane-air detonation experiments at NIOSH Lake Lynn Laboratory[J]. Journal of Loss Prevention in the Process Industries, 2013,26(2):295-301.
[32] Lea C J, Ledin H S. A review of the state of the art in gas explosion modelling: HSL-CM-00/04[R]. Health & Safety Laboratory, Buxton, UK, 2002.
[33] Salzano E, Marra F S, Russo G, et al. Numerical simulation of turbulent gas flames in tubes[J]. Journal of Hazardous Materials, 2002,95(3):233-247.
[34] Zhu C J, Lin B Q, Hong Y D, et al. Numerical simulations on relationships between gas velocity and overpressure of gas explosions in ducts[J]. Disaster Advances, 2013,6(S1):217-227.
[35] Lin B Q, Hong Y D, Zhu C J, et al. Effect of length on the relationships between the gas velocity and peak overpressure of gas explosion disasters in closed-end pipes[J]. Disaster Advances, 2013,6(S2):176-184.
(责任编辑 王易难)
Simulation on dynamic pressure of premixed methane/air explosion in open-end pipes
Hong Yidu, Lin Baiquan, Zhu Chuanjie
(StateKeyLaboratoryofCoalResourcesandSafeMining,FacultyofSafetyEngineering,ChinaUniversityofMiningandTechnology,Xuzhou221116,Jiangsu,China)
In order to study the evolution of dynamic overpressure of deflagration, a simulation was carried out in an open end pipe. It was found that the dynamic pressure was closely correlated with the gas velocity so that they always arrive at the peak value at the same time. In addition, the first positive peak of the dynamic pressure was almost several times greater than that of the second. This may indicate that the blast wave has a greater influence on the dynamic pressure than the flame does. An empirical prediction equation was given to calculate the first and second positive peaks based on the propagation time. Maximum dynamic pressures were increased with the propagation distance in all the three directions (x,yandz), and so was with time. The maximum dynamic pressure value in thexdirection was almost several thousand times greater than those in the other two directions. Compared with the explosive overpressure, the influence on the explosive damage by the dynamic pressure in theyandzdirection was quite small. Three empirical formulas were given to calculate the maximum dynamic pressures in different directions. The relationship between the dynamic pressure and the square of the gas velocity was verified. An empirical formula of the dynamic overpressure was also given based on the length-diameter ratio and the gas velocity. The results may provide a reference for the study on the gas explosion in the limited spaces.
mechanics of explosion; dynamic pressure; pipe size; methane/air explosion; open-end pipes; gas velocity
10.11883/1001-1455(2016)02-0198-12
2014-08-18;
国家自然科学基金项目(51204174);中央高校基本科研业务费专项项目(2012QNB01)
洪溢都(1989— ),男,博士研究生,hongyidu@163.com。
O383 国标学科代码: 13035
A
修回日期: 2014-10-24

