基于欧氏距离最佳K均值聚类的超级电容组故障在线鉴别方法
于 鹏,杨仁刚(1.中国农业大学信息与电气工程学院,北京100083;2.渤海大学工学院,锦州 121013)
基于欧氏距离最佳K均值聚类的超级电容组故障在线鉴别方法
于鹏1,2,杨仁刚1※
(1.中国农业大学信息与电气工程学院,北京100083;2.渤海大学工学院,锦州 121013)
摘要:为了提高超级电容组运行可靠性需要对故障电容进行在线鉴别,针对现有超级电容故障鉴别方法参数识别难度高和采集数据量大的问题,该文采用最佳K均值聚类方法在线检测故障超级电容器,并提出了最佳聚类的欧氏距离指标。该方法首先对在线电压信号数据进行预处理,采用奇异值分解提取特征值进行K-Means动态聚类并计算相应的欧氏距离指标,由最佳聚类结果鉴别出故障单体。针对该文提出方法设计了超级电容组充放电仿真试验进行验证。试验结果表明基于欧氏距离指标最佳K均值动态聚类的超级电容组故障在线鉴别方法可以根据串联单体电压信号进行故障检测。该文可为超级电容在线故障检测系统的开发与研制提供参考。
关键词:故障检测;信号分析;模型;超级电容;动态聚类;有效性指标
于鹏,杨仁刚. 基于欧氏距离最佳K均值聚类的超级电容组故障在线鉴别方法[J]. 农业工程学报,2016,32(2):186-192. doi:10.11975/j.issn.1002-6819.2016.02.027http://www.tcsae.org
Yu Peng, Yang Rengang. Online fault identification method for supercapacitor group of optimal K-means cluster based on Euclidean distance[J]. Transactions of the Chinese Society of Agricultural Engineering (Transactions of the CSAE), 2016, 32(2): 186-192. (in Chinese with English abstract)doi:10.11975/j.issn.1002-6819.2016.02.027http://www.tcsae.org
0 引 言
超级电容规模化使用是一种具有前景的电能规模化存储技术,对于清洁能源的使用和增加可再生能源在电网能源构成中的比例具有重要作用。超级电容具有总储能成本低和功率密度大的优点。由于超级电容单体耐压水平低,在规模化使用时需多组单体串联构成模组[1]。实时检测模组中故障电容器,适时安排检修是提高超级电容规模化串联模组整体可靠性的重要手段,也是影响目前超级电容规模化集成应用的瓶颈问题之一。
电路故障分为硬故障和软故障,超级电容的缓变故障属于软故障,主要包括电热击穿、容量衰减和外壳软化等劣化失效或损伤累积失效模式[2]。从故障检测的目的来看,对超级电容的故障检测研究[3]可分为对超级电容生命周期预测和健康状态检测两大类,对超级电容生命周期的预测主要目的是评估超级电容的实际寿命,而健康状态检测主要目的是在线检测出故障电容器,本文主要涉及后者。从检测方法来看,主要有直接测量法和参数估计法。直接法[4]是通过实时测量超级电容电压电流以及环境温度,然后根据端电压与寿命经验曲线或比较电容能量储存变化来诊断超级电容的健康状况。优点在于有可能在线应用,其缺点在于需要与初始状态进行比较才能做出判断。实际应用中,模组单体初始状态的测量会增加生产的难度与成本。
较为普遍的研究方法是采用参数估计法,利用在线测量信息估计超级电容单体的容值和串并联电阻。参数估计法又分为频域参数估计和时域参数估计。频域参数估计优点为可分辨参数在频率域的更多细节;缺点为测量较为复杂在线实施难度大[5]。时域参数估计则是通过测量信号与超级电容容值、串联和并联电阻参数的数学模型,采用数学估计的方法获得参数进而判断超级电容健康状况。Akram Eddahech[6]提出了一种基于遗忘因子的最小二乘回归计算超级电容内阻参数的方法,其优点为可以在线估计内阻参数,其缺点为选用模型不同将影响结果且其原理存在建模简化与最小二乘法所造成的误差。Shi Zhihao[7]设计了扩展卡尔曼观测器,通过观测器计算超级电容参数的估计值,包括电容值和串并联电阻,主要缺点是需要在充电电流中叠加信号,增加了系统成本。
现有方法大多侧重于超级电容参数的在线辨识,辨识的基础是超级电容数学模型,但超级电容精确建模以及对失效模式的量化分析难度较大;基于对单体电容器特性的分析,需对电容单体逐个参数识别,识别工作量较大。基于聚类法的非线性系统故障检测已有研究[8],具有无需建立精确数学模型的优点。因此,本文提出了基于欧氏距离指标最佳K均值动态聚类的超级电容组故障在线鉴别新方法。该方法无需建立每个超级电容单体数学模型,通过对单体电容电压测量信息中提取样本特征向量进行最佳K均值聚类,可同时检出多个失效电容器。
本文首先介绍样本特征向量计算方法并简要介绍K均值聚类数学模型,然后介绍本文提出的判定最佳聚类数的欧氏距离指标和超级电容串联组故障在线鉴别的动态聚类方法,最后通过仿真试验验证动态聚类方法与欧氏距离指标的正确性,以期为超级电容在线故障检测系统的开发与研制提供参考。
1 电容模组状态最佳K均值聚类
采用聚类方法鉴别串联超级电容模组中的故障组,需解决2个问题:1)提取表征模组状态的特征作为聚类样本[9-11];2)确定最佳聚类数目和判断失效模组。
1.1电容模组状态聚类数学模型
单体超级电容等值电路由电容、串联电阻和并联电阻构成,由此形成的串联模组经典电路模型如图1所示。
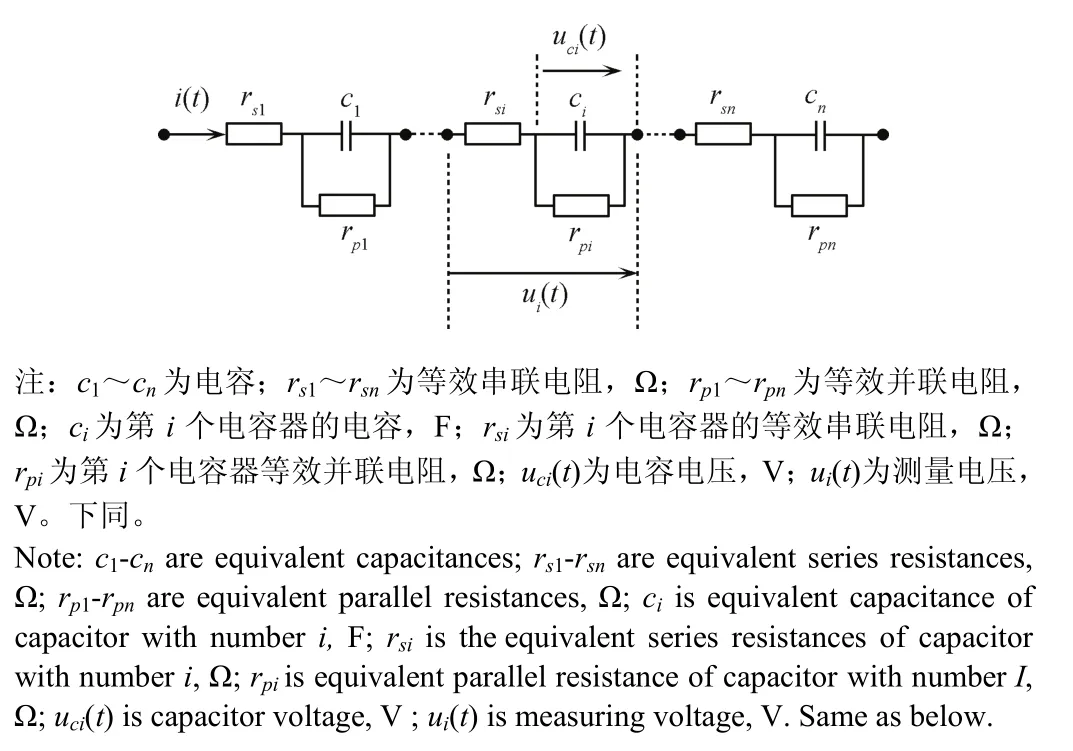
图1 串联电容器等值电路Fig.1 Equivalent circuit of series capacitors
设ui(t-Δt)和ui(t)分别为2个相邻时刻(t-Δt)和t,第i个电容器端电压在线测量值。则有

式中uci(t)为电容电压,V;角标i为电容编号,A;i(t)为电容器电流,A;rsi为第i个电容器的等效串联内阻,Ω;ui(t)为测量电压,V;Δt为采样时间间隔,s;t为采样时刻,s。
忽略电容器漏电流,相邻时刻电容器端电压差值与电容器电流有以下关系成立

式中ci为第i个电容器的电容,F。
值得指出的是,忽略电容器漏电流后,串联各单体的电流近似相等,在采样间隔Δt内电容模组串联电路中的电流不会因某个单体电容值的变化而变化。即在Δt内,对任意第i个电容器而言,电容值ci与该采样间隔相邻时刻电容电压差成反比。
由此可见,相邻时刻电容器端电压测量值之差[ui( t)- ui( t-Δ t )]可以反映超级电容的电容量与内阻特征,即可作为检测第i个超级电容单体的状态变量。这里将检测第i个超级电容单体的状态变量定义为

设总采样时间为T=m·Δt,其中m为采样总数。对n个串联单体端电压采样结果可以得到系统的状态矩阵

式(4)矩阵A的行向量表征了相应单体电容值的状态,为了提取其特征值对矩阵An× m进行奇异值分解(singular value decomposition, SVD),有

式中Rn× n、Qm× m分别为正交阵,其列向量分别称为A阵的左、右奇异向量;Λn× m为A阵的奇异值对角阵。
奇异值对角阵Λn× m=diag,…,0… 0),其中,...为从大到小排列的矩阵特征值。,...为前n列对角元奇异值,满足≥≥ ...≥。
等式(5)两边右乘正交阵Qm× m,有

Rn× nΛn×m称为矩阵A在Qm× m上的投影,选取较大奇异值对应投影方向得到的投影变换,可以较好地保留原向量表示的信息[12]。因此,本文提取Rn× nΛn×m中对应的第1列向量作为n个超级电容串联模组端电压状态特征值,即模组状态样本特征向量

式中[x1, x2,..., xn]T为模组状态样本特征向量。
针对式(7)所提取的特征向量进行K均值聚类就可以获得模组状态的分类。设给定聚类数为k,则K均值聚类目标函数为

式中k为聚类数;Γi为第i个聚类子集,xj为Γi中的样本,mi为Γi中样本的平均值,即

式中Ni为子集Γi中的样本点数。
1.2最佳聚类数判定指标
所谓最佳K均值(K-Means)聚类算法是通过不断给定聚类的聚类数k进行聚类计算,然后用最佳聚类数判定指标来确定其中最佳聚类结果K。以下介绍K-Means聚类方法和聚类数判定指标。
大部分聚类算法需要预先给定聚类数,因而如何得到最佳聚类数,一直是聚类有效性研究的重要课题。现有方法通常是通过聚类有效性指标对给定不同聚类数k的聚类结果进行评价以确定样本集最佳聚类数和最合适的聚类结果[13-15]。研究表明[16-17],没有一种有效性指标能够在任何情况下都具有普遍适用性。较为常用的4种有效性指标有Hartigan(Ht)指标[18]、Homogeneity-Separation(HS)指标[19]、Calinski-Harabasz(CH)指标[20]、Krzanowski-Lai(KL)指标[21]。
采用聚类方法检测失效超级电容器,首先应当将参数异常电容与参数正常电容区分开;其次要求参数能够区分异常电容与正常电容分入同组的情况。分组数不可过多,否则无法区分正常电容与异常电容。指标应在一定范围内可以调节以适应不同具体情况。根据这一概念,本文提出一种新的最佳K值聚类判定指标,称为欧氏距离(euclid distance,ED)指标。
欧氏距离指标是基于类内样本点距离和聚类中心点距离的判定指标,即

式中VEDk为聚类数等于k时欧氏距离聚类有效性指标;Dgroup为类内样本距离,等于全部类内点之间欧氏距离之和;DCmax和DCmin分别为最大中心距离和最小中心距离;p为分子试验校正参数、q为分母试验校正参数。
欧氏距离指标定义式(10)中选取试验校正参数p、q时应使该定义式的分子分母数量级一致,满足

本文采用的经验值为p=1,q=1。类内样本距离为

式中Γl为第l个分类子集。
最大中心距离和最小中心距离DCmax和DCmin为

显然,最佳聚类是希望同类子集内的样本点越集中越好,即Dgroup越小越好;聚类数不要太多则希望最大中心距离DCmax越小越好;同时,希望各类之间区分度越大越好,即DCmin越大越好。因此,最佳聚类的欧氏距离指标越小越好,即最佳聚类的欧氏距离指标为

式中VED为欧氏距离指标,k*为最佳聚类数。
2 电容模组故障状态在线鉴别方法
基于最佳K均值聚类的超级电容模组故障状态在线鉴别需要在每一个采样周期获得样本后,首先对模组总体状态进行评估,判断是否存在失效单体,进而对存在失效电容的样本特征向量进行聚类分析,鉴别出参数劣化单体电容。
在每一个采样周期通过式(1)~式(6)获得模组状态样本特征向量X=[ x1, x2... xn]T,计算特征向量的方差σ2[22]。若方差σ2大于给定阈值ε,则特征向量中包含故障电容状态特征样本;反之则说明特征向量结果合格。
在特征向量的方差大于给定阈值的情况下,求解式(8)聚类问题,得到不同聚类数k对应的分类子集;然后对不同k值的聚类结果按照式(10)计算欧氏距离指标VEDk;由式(14)判定最佳聚类结果;在最佳聚类子集中,样本点数目最多子集所对应的单体电容集合确定为正常电容子集,剩余子集判定为非正常子集。故障状态在线鉴别方法计算流程如图2所示。
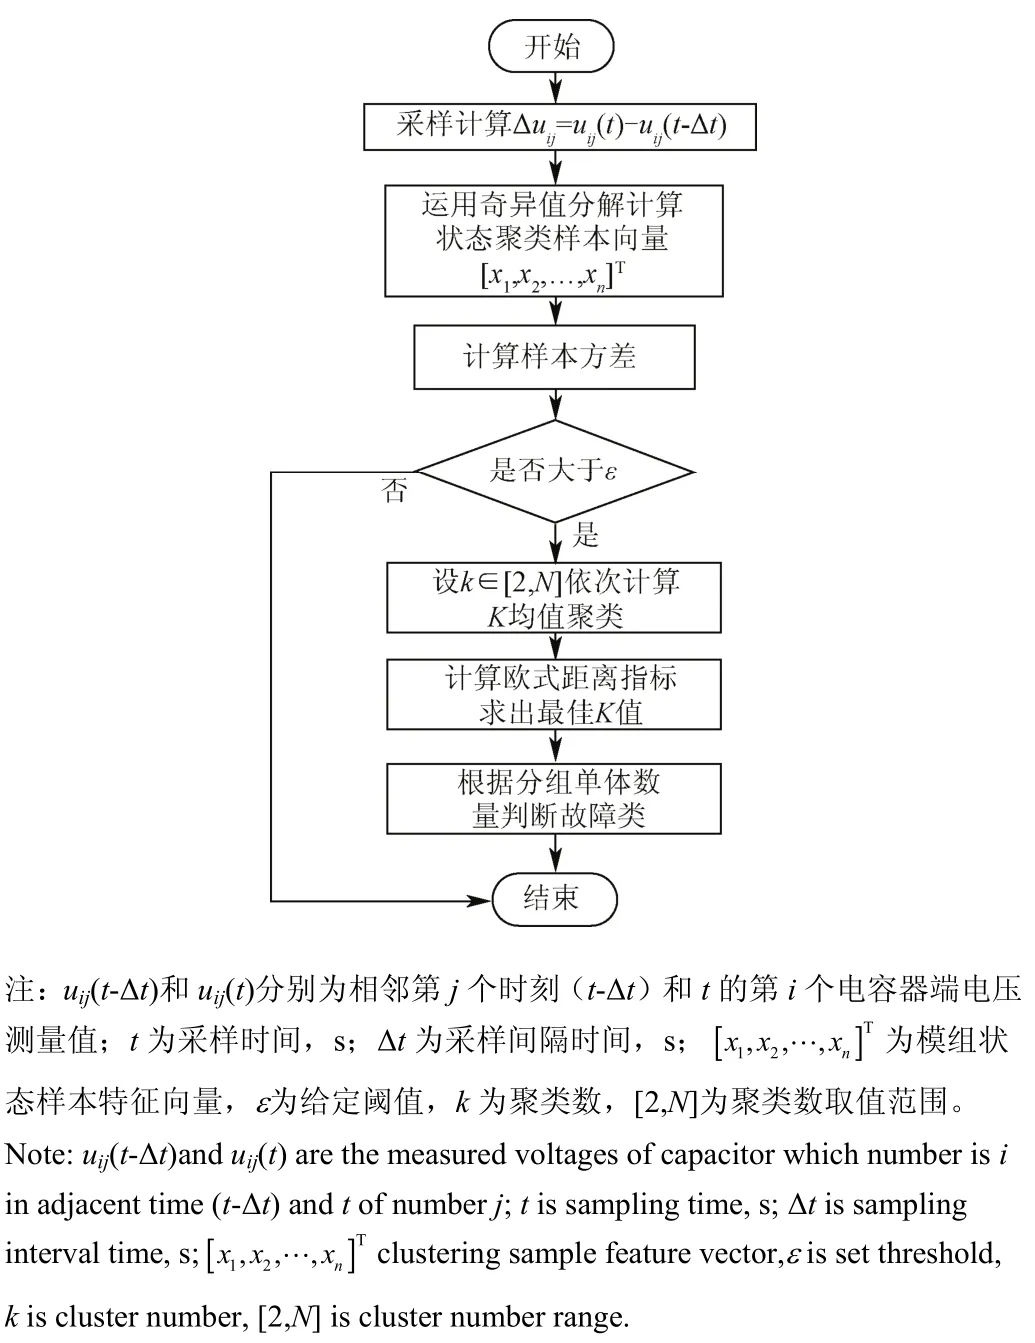
图2 故障状态在线鉴别方法流程Fig.2 Workflow of online fault state identification method
3 仿真试验
为了验证提出的超级电容模组故障状态在线鉴别方法的有效性,本文设计了一个9单体电容器串联的超级电容储能试验系统,并基于MATLAB-simulink环境设计了2组试验。其中,试验一为最佳聚类指标效果对比试验,在相同工况和相同采样值的条件下,采用本文提出的最佳聚类指标和目前常用Hartigan(Ht)、Homogeneity-Separation(HS)、Calinski-Harabasz(CH)和Krzanowski-Lai(KL)指标进行故障状态检测并对结果进行对比,以验证本文欧氏距离指标(式(13))的有效性;试验二为多工况条件下聚类指标有效性试验,为了验证本文的故障检测方法在不同情况下都能有效地检出故障电容器,对超级电容储能仿真系统在不同工况条件下进行了检测验证。
3.1系统及参数
本文设计的超级电容模组试验系统为9个单体超级电容串联形成的储能系统,模组系统采用如图1所示经典模型,超级电容额定参数:电容c=10 F,串联电阻rs=0.1 Ω,并联电阻rp=27 kΩ。仿真试验按照随机误差生成电容数据,设计其中电容器c1、c3和c5为非健康状态的故障电容器,相应电容值的偏差大于20%,系统参数表1所示。
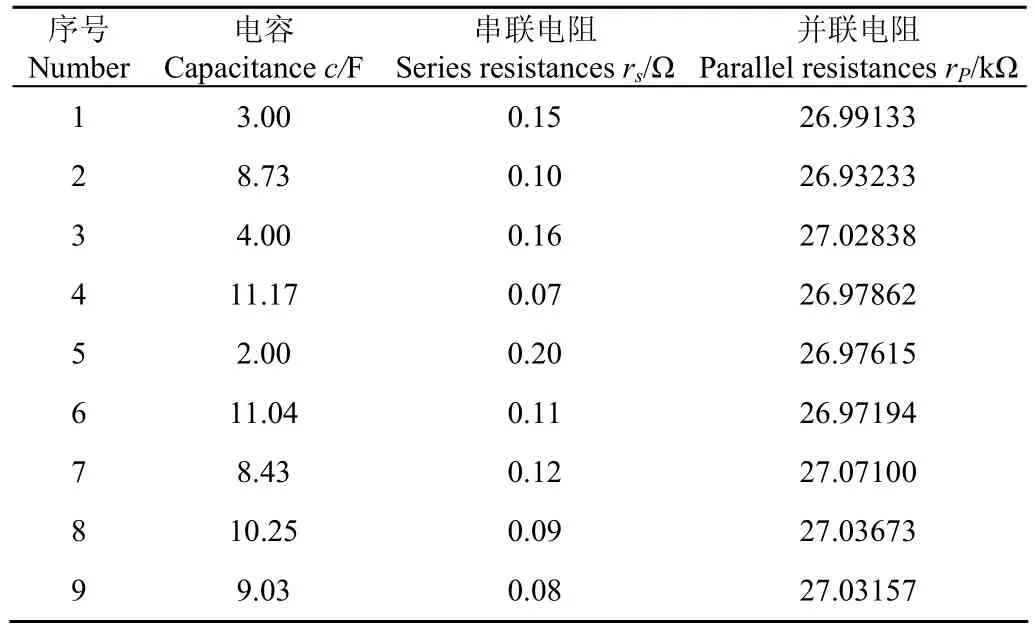
表1 系统参数Table 1 Dataset of experiment system
3.2试验及结果
3.2.1最佳聚类指标效果对比试验
聚类指标对比试验是在储能系统随机充放电工况下进行的,随机充放电工况通过随机事件发生器控制充电电源和放电电阻来实现,电容器端电压采样周期10 s、采样间隔1 s。
在随机充放电工况下,各电容器端电压的变化曲线如图3。任选储能仿真系统的一个周期样本方差大于阕值ε=0.01的采样值,由式(4)~式(7)得到样本特征向量为

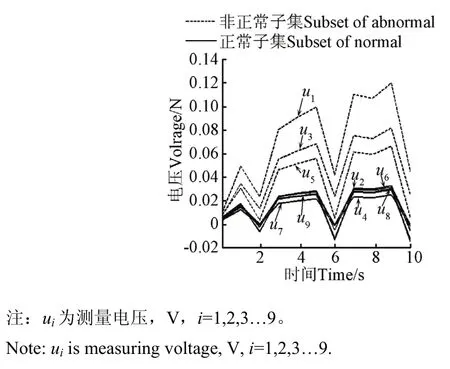
图3 电容器端电压Fig.3 Curves of capacitor’s voltage
1)本文欧氏距离指标计算结果
对式(15)样本进行动态聚类计算,得到欧氏距离指标关于聚类数k的变化曲线VED(k)如图4所示,由式(14)得最佳聚类数k*=2。
最佳聚类数k*=2对应的2个聚类子集分别为


图4 欧氏距离指标VED(k)曲线Fig.4 Curves of Euclidean distance Index
根据样本点多的聚类子集为正常子集的判据,样本点少的Γ2为故障电容子集。对比给定参数表1可知,故障集Γ2中3个故障电容与给定一致。上述结果表明,在随机充放电运行工况下本文的方法能够有效地检出故障电容器。
2)常用的4种聚类指标计算结果
对相同的特征向量式(15)采用4种常用最佳聚类Ht、HS、CH和KL指标得到各指标关于聚类数k的变化曲线如图5所示。
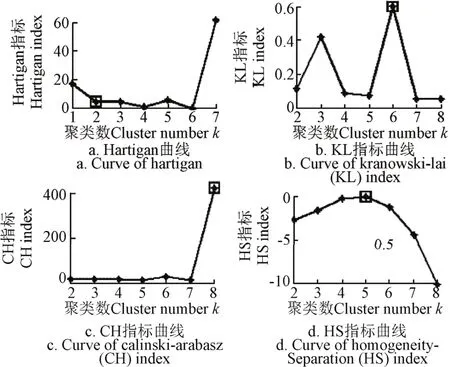
图5 现有有效性指标曲线Fig.5 Curves of existing efficient index
HS、CH和KL指标都是取值最大的聚类数为最佳聚类数k*,Hartigan指标是取指标小于等于10的最小类数为最佳聚类数k*。由图5可见,KL指标得到的最佳聚类数k*=6,CH指标得到的最佳聚类数k*=8,HS指标得到的最佳聚类数k*=5,显然对电容器故障状态聚类问题失效;Hartigan指标得到最佳聚类数与本文欧氏距离指标一致k*=2,但是其计算方法相对复杂、评估性能和通用性不强[23-25]。
3.2.2多工况条件下聚类指标有效性试验
为了进一步验证本文故障电容器鉴别方法的有效性和合理性,对超级电容储能试验系统进行了多工况运行条件下故障电容器检测仿真试验。在储能系统充电、放电和随机充放电运行工况下完成了8组试验,其中第1组和第2组试验为不同电压初值的放电试验,其中第1组试验超级电容单体初始电压设置为1.8 V,第2组试验超级电容单体初始电压设置为2.5 V。第3和第4组为不同充电电流的充电试验,其中第3组试验充电电流设置为1 A,第4组试验充电电流设置为0.5 A。第5到第8组为随机充放电试验,为满足其随机充放电条件,设置其充电电流为0.1 A,放电电阻为10 Ω。
采用与3.2.1所述试验相同的方法采样并获得特征向量,对特征向量应用本文方法进行动态聚类得到各运行工况下最佳的聚类结果列于表2。
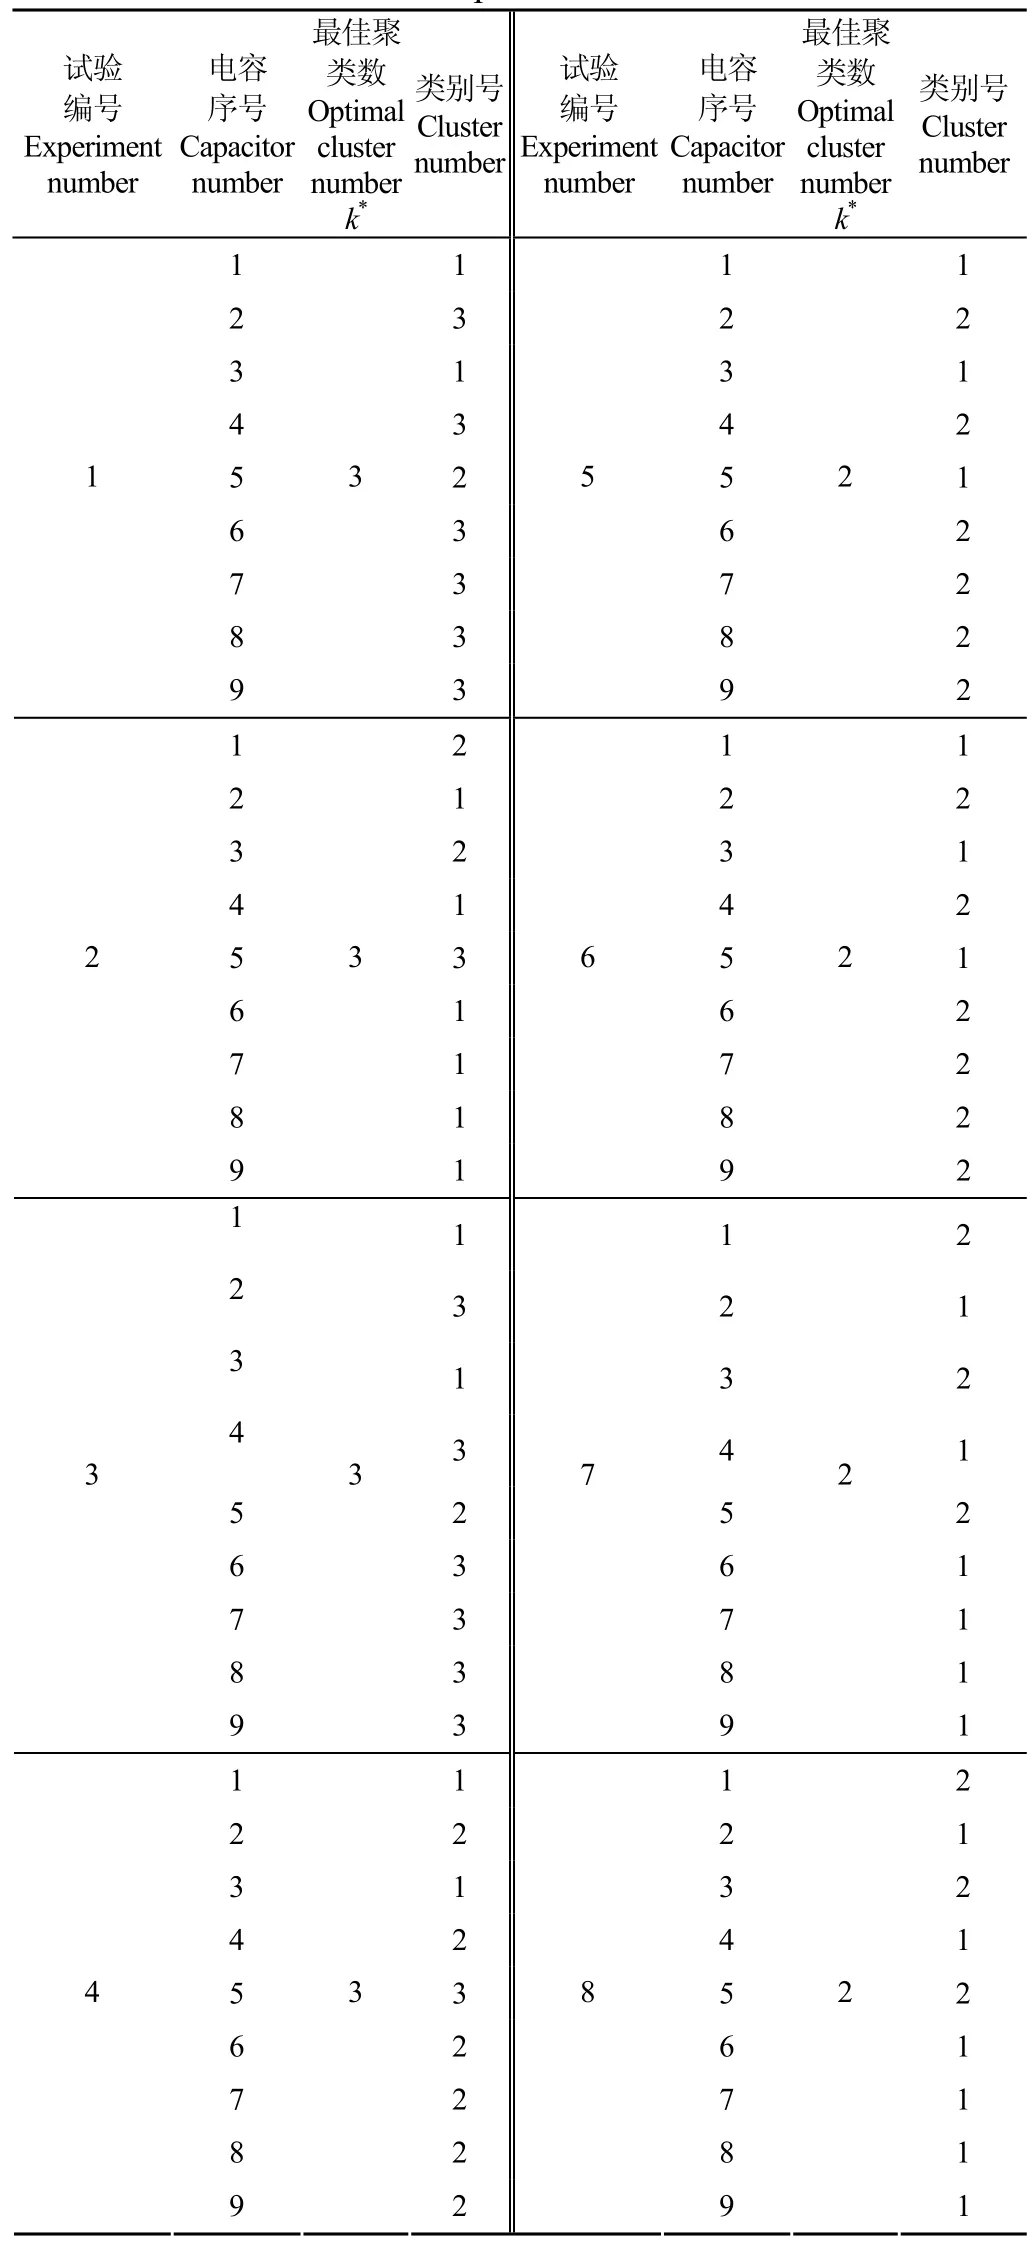
表2 电容序号与聚类表Table2 Dataset of capacitor numbers and clusters
由试验结果表2可见,第1组~第4组试验样本的最佳聚类数都是3,各组试验对应的3个聚类子集元素完全相同,将其元素重新整理为3组

根据样本点多的子集为正常子集判据,式(17)中1为正常电容器集,而Γ2和Γ3为非正常集,即检出c1、c3和c5为故障电容器与预设结果一致。
试验结果表2中第5组~第8组试验样本的最佳聚类数都是2,各组试验对应的2个聚类子集与试验一式(16)完全相同,均正确地检出了故障电容器。
由此可见,本文提出的最佳K均值聚类检测故障电容器的方法能够在各种运行工况下正确地检出故障电容器。
4 结 论
1)本文提出的基于欧氏距离最佳K均值聚类的超级电容模组故障状态在线检测方法是根据在线测量超级电容单体电压信息来判断串联模组内的故障电容器,与以往方法相比避免了超级电容容值参数的计算,因此对传感器数据要求低,便于工程实现。
2)建立了电容模组状态K均值聚类数学模型,提出了电容模组状态样本特征向量的计算方法和最佳聚类数判定的欧氏距离指标。
3)设计了超级电容串联模组系统的充放电仿真试验,并采用本文的模型和算法对试验采样数据进行故障电容器检测计算,计算结果区分了超级电容单体健康状态,验证了方法和模型的有效性。
[参考文献]
[1] 于鹏,杨仁刚. 超级电容串联储能系统的并联电容均压方法[J]. 农业工程学报,2014,30(24):133-140. Yu Peng, Yang Rengang. Voltage equalizing method of energy storage system based on series connected supercapacitros[J]. Transactions of the Chinese Society of Agricultural Engineering(Transactions of the CSAE), 2014,30(24): 133-140.
[2] 李忠学,陈杰. 碳基超级电容器的快速充放电性能及失效模式[J]. 兰州交通大学学报:自然科学版,2006,25(6):8-11. Li Zhongxue, Chen Jie. Failure modes and rapid charging/ discharging characteristics of carbon-based supercapacitors[J]. Journal of Lanzhou Jiaotong University: Natural Sciences,2006, 25(6): 8-11. (in Chinese with English abstract)
[3] Lystianingrum V. State of health and life estimation methods for supercapacitors[C]//Australasian Universities Power Engineering Conference, Hobart: IEEE, 2013: 1-7.
[4] Amrane O, Boubekeur T. Calendar ageing and health diagnosis of supercapacitor[J]. Electric Power Systems Research, 2013, 95(2): 330-338.
[5] Wei Tongzhen. Deterioration diagnosis of ultracapacitor for power electronics applications[C]//International Conference on Sustainable Power Generation and Supply, Nanjing: IEEE,2009: 1-6.
[6] Akram E. Online parameter identification for real-time supercapacitor performance estimation in automotive applications[J]. International Journal of Electrical Power &Energy Systems, 2013, 51(10): 162-167.
[7] Shi Zhihao. Interconnected observers for online supercapacitor ageing monitoring[C]// Annual Conference of Industrial Electronics Society, Vienna: IEEE, 2013: 6746-6751.
[8] 赵琦,周东华. 一种非线性动态系统的故障检测与分类方法[J]. 电工技术学报,2001,16(4):65-70. Zhao Qi, Zhou Donghua. Fault detection and classification of a class of nonlinear dynamic systems[J].Transactions of China Electrotechnical Society, 2001, 16(4): 65-70. (in Chinese with English abstract)
[9] 张菁,杨明皓. 基于模糊聚类的电力系统载荷能力安全预警方法[J]. 电力系统自动化,2007,31(22):31-33. Zhang Jing. Yang Minghao. Security forewarning method of maximum load capacity based on fuzzy clutering[J]. Automation of Electric Power Systems, 2007, 31(22): 31-33. (in Chinese with English abstract)
[10] 张红斌,贺仁睦,刘应梅. 基于KOHONEN 神经网络的电力系统负荷动特性聚类与综合[J]. 中国电机工程学报,2003,23(5):2-3. Zhang Hongbin, He Renmu, Liu Yingmei. The characteristice clustering and synthesis of electric dynamic loads based on KOHONEN neural network[J]. Proceedings of the CSEE,2003, 23(5): 2-3. (in Chinese with English abstract)
[11] 方正文,王年,江晋剑. 一种基于低维足底压力特征的静态步态聚类算法术[J]. 计算机应用研究,2015,32(7):2177-2178. Fang Zhengwen, Wang Nian, Jiang Jinjian. Clustering algorithm for static gait recognition based on low-dimensional plantar pressure features[J]. Application Research of Computers, 2015, 32(7): 2177-2178. (in Chinese with English abstract)
[12] 尹芳黎,杨雁莹,王传栋. 矩阵奇异值分解及其在高维数据处理中的应用[J]. 数学的实践与认识,2011,41(15):171-176. Yin Fangli, Yang Yanying, Wang Chuandong. Research on the advances of singular value decomposition and its application in the high dimensional data mining[J]. Mathematics in Practice and Theory, 2011, 41(15): 171-176. (in Chinese with English abstract)
[13] Macqueen J. Some methods for classification and analysis of multivariate observations[C]//Proceedings of 5th Berkeley Symposium on Mathematical Statistics and Probability, Berkeley: University of California Press,1967: 281-297.
[14] 王莉. 数据挖掘中聚类方法的研究[D]. 天津:天津大学,2004:5-8. Wang Li. Study on Clustering Algorithm in Data Mining[D]. Tianjin: Tiajin University, 2004: 5-8. (in Chinese with English abstract)
[15] 杨小兵. 聚类分析中若干关键技术的研究[D]. 杭州:浙江大学,2005:24-25. Yang Xiaobing. Research of Key Techniques in Cluster Analysis[D]. Hangzhou: Zhejiang University, 2005: 24-25. (in Chinese with English abstract)
[16] 周世兵. 聚类分析中的最佳聚类数确定方法研究及应用[D].无锡:江南大学,2011. Zhou Shibing. Research and Application on Determining Optimal Number of Cluster in Cluster Analysis[D].Wuxi: Jiangnan University, 2011. (in Chinese with English abstract)
[17] 王开军,李健. 聚类分析中类数估计方法的实验比较[J].计算机工程,2008,34(9):198-202. Wang Kaijun, Li Jian. Experimental comparison of clusters number estimation for cluster analysis[J]. Computer Engineering, 2008, 34(9): 198-202. (in Chinese with English abstract)
[18] Hartigan J A, Wong M A. A K-Means clustering algorithm[J]. Applied Statistics,1979, 28(1): 100-108.
[19] Chen Gengxin. Evaluation and comparison of clustering algorithms in analyzing ES cell gene expression data[J]. Statistica Sinica, 2002, 12(1): 241-262.
[20] Calinski R B, Harabasz J. A dendrite method for cluster analysis[J]. Communications in Statistics, 1974, 3(1): 1-27.
[21] Krzanowski W, Lai Y. A criterion for determining the number of groups in a data set using sum-of-squares clustering[J]. Biometrics, 1988, 44(1): 23-34.
[22] 庄楚强,何春雄. 应用数理统计基础[M]. 广州:华南理工大学出版社,2009:34-35.
[23] Peterson A R. Visual Data Mining: Using Parallel Coordinate Plots with K-Means Clustering and Color to Find Correlations in a Multidimensional Dataset[D]. Kutztown: Kutztown University of Pennsylvania, 2009: 27-29.
[24] 周世兵,徐振源,唐旭清. 基于近邻传播算法的最佳聚类数确定方法比较研究[J]. 计算机科学,2011,38(2):225-228. Zhou Shibin, Xu Zhenyuanl, Tang Xuqing. Comparative study on method for determining optimal number of clusters based on affinity propagation clustering[J]. Computer Science,2011, 38(2): 225-228. (in Chinese with English abstract)
[25] Albalate A, Suendermann D. A combination approach to cluster validation based on statistical quantiles[C]// International Joint Conference on Bioinformatics, Systems Biology and Intelligent Computing, Shanghai: IEEE, 2009: 549-555.
·农业生物环境与能源工程·
Online fault identification method for supercapacitor group of optimal K-means cluster based on Euclidean distance
Yu Peng1,2, Yang Rengang1※
(1. College of Informɑtion ɑnd Electricɑl Engineering, Chinɑ Agriculruɑl University, Beijing 100083, Chinɑ; 2. College of Engineering, Bohɑi University, Jinzhou 121013, Chinɑ)
Abstract:In order to keep the energy storage system which is based on supercapacitor group with series connection work reliably, the fault groups of supercapacitors are necessary to be identified. A fault state identification method of K-means cluster was presented in this paper. A Euclidean distance index was proposed to choose K value automatically. In this method,the voltage signal data are preprocessed to form the sample array. The singular value decomposition is applied to project out a shadow subset of the sample array. The K-means method is used to cluster the shadow subset for fault state identification. The fault subsets are detected in the cluster result. The largest cluster is identified as normal state and the others are abnormal state. The Euclidean distance index was proposed to decide the optimal K value automatically after enumeration of all possible K. This index is based on the Euclidean distance of pairwise data points and pairwise cluster centers. The minimize value of index is bonded to the optimal K value. Adjustable coefficients are used to improve the adaptability of this index. Based on the principle of K-means cluster method and Euclidean distance index, the fault state identification process was introduced. In this process, after sampling the voltage of supercapacitor cells, the difference voltage array is established to form the feature space. The singular value decomposition is used on the difference voltage array to form the sample subset. The variance of sample subset is compared to set limitation. If the variance overrides the limitation, K-means algorithm will be used to cluster the sample subset, and the Euclidean distance index will be used to decide the optimal K value. By counting the group amount of sample subset, the fault state capacitors can be distinguished. An experiment system was designed to verify the efficiency and validity of the method and index. The experiment environment was MATLAB-Simulink. Two experiments were carried out based on the experiment system. The first experiment was for the comparison of different indices. This experiment was set in randomly charging and discharging situation to approach the actual situations. The optimal K value was picked out from the enumerated values by searching the minimum value of Euclidean distance index. The result collections distinguished the normal and abnormal sets. As this result was the same with the given situation, the effective of Euclidean distance index was proved. The result showed that the proposed character vector exacting method correctly reflected the characteristics of supercapacitor state. Other existing indices were computed out. The comparison of efficiencies among different indices was made. The homogeneity-separation (HS), Calinski-Harabasz (CH) and Krzanowski-Lai (KL) index failed to identify the right group of this case. Hartigan index got the right result. But the Hartigan index also had its drawback in utilities, efficiency and complexity. The second experiment was designed to prove the correctness of the method and index in different working scenarios. In this experiment, 3 groups were set. The 1stgroup included 2 subsets of samples in which the capacitors were charged with different current, the 2ndgroup included 2 subsets of samples in which the capacitors were discharged with different starting voltage, and the 3rdgroup of data included 4 subset of samples in which the capacitors were charged and discharged randomly. The Euclidean distance index indicated that the 1stand the 2ndgroup got the results of 3 subsets. The largest subset was the normal set and the other 2 subsets were abnormal set. The Euclidean distance index showed that the 3rdgroup got the correct results of 2 subsets. All of the experiment groups got the expected result. The results showed that the fault state could be identified correctly through the dynamic cluster method according to the voltage signal of supercapacitor cell. The validity of Euclidean distance index to select the optimal K value of clusters for fault identification was proved. Two main conclusions were drawn in this paper. The first is that the fault state identification method based on K-means cluster can distinguish the normal and abnormal set of serial connected supercapacitors. The second is that the Euclidean distance index can select the optimal K value automatically. The fault identification method proposed in this paper has 2 advantages. The first advantage is that identification of capacitor parameters is avoided. The second advantage is that this method has low dependency on precise of acquisition data.
Keywords:fault detection; signal analysis; models; supercapacitor; dynamic cluster; validity index
通信作者:※杨仁刚,男,辽宁省大连市人,教授,博导。研究方向为供配电技术。北京中国农业大学信电学院,100083。Email:yrg@cau.edu.cn
作者简介:于鹏,男,辽宁省锦州市人,讲师,博士,研究方向为电力电子。锦州渤海大学工学院,121013。Email:22419705@qq.com
基金项目:国家863高技术基金项目(2012AA050217)。
收稿日期:2015-03-06
修订日期:2015-12-25
中图分类号:TM53
文献标志码:A
文章编号:1002-6819(2016)-02-0186-07
doi:10.11975/j.issn.1002-6819.2016.02.027

