
Prediction and Analysis of O3 based on the ARIMA Model
2015-12-14 08:32:02ShuangjinLINingYANGYiqiYANXudongCAODegangJI
Agricultural Science & Technology 2015年10期
Shuangjin LI, Ning YANG, Yiqi YAN, Xudong CAO, Degang JI*
1. Institute of Modern Science and Technology, Hebei Agricultural University, Baoding 071000, China;
2. Faculty of Science Department of Mathematics, Hebei Agricultural University, Baoding 071000, China
Air is life foundation and air quality decides livelihood quality of people. In practice, photochemical smog significantly influences the quality of summer air. It is known that ozone layer in the stratosphere prevents damages from ultraviolet light on life forms.However,ozone near the surface proves a major source of photochemical smog, which would potentially damage crops,trees,and other plants, as well as cause asthma of children[1]. Currently, much more researches have been conducted on prediction on air quality.For example, Si performed prediction on air quality with improved grey neural network combination model(IGNNM),but the effects of pollution source intensity on pollutant concentration are not taken into consideration. Therefore, the prediction is not so precise if air quality changes dramatically. On the other hand,FA-GNNM concerns complicated work and the obtaining of data is much difficult[2].In contrast,Analysis of time series[3]is suitable for middle or short-term prediction with high accuracy.The research made prediction on air quality in following two weeks in Baoding City as per analysis of time series and concluded change rules of pollutants based on prediction results,as well as proposed some suggestions and countermeasures.
Data Source
The research data referred to data monitored by China National Environmental Monitoring Centre[4]and the major pollution index was O3.
Establishment of Model
Data and processing
Some data were missing and replaced by averages of neighboring values.
According to one-sample Kolmogorov-Smirnov test, the detection value of O3was 0.303, which was higher relative to significant level of 0.05. Hence, the sample data were normally distributed and can be used for analysis of time series.
Stabilization of sequence
As shown in Fig.1, the sequence of xt4were unstable, the sequence of yt4was concluded by firstorder difference.
Because sequence yt4tended to be volatile around average, autocorrelation function and partial autocorrelation function were within confidence interval, without regularity. Assuming significance level of α=0.05, it is be-lieved that yt4was relatively stable.Therefore, the model of ARIMA(p,d,q)was establsihed with sequence xt4.
According to changes of autocorrelation function, the data showed periodicity and seasonal differences should be conducted on the sequence.Therefore,ARIMA(p,d,q)(P,D,Q)7 was established with xt4.
As shown in Fig.3,autocorrelation function of xt4was censored with k=1,and partial autocorrelation function censored with k=5. It can be concluded that and non-seasonal model was applied with ARIMA(5,1,1).As shown in Fig.4, both of autocorrelation function and partial autocorrelation function of the first-order difference of xt4were censored with k=2. Therefore, ARIMA(2,1,2) was applied. Meanwhile, data fitting should be considered of ARIMA(1,1,1) (2,1,3) and ARIMA (5,1,1)(2,1,3).
It can be concluded from indices above that it is optimal for fitting and prediction with ARIMA (5,1,1)(2,1,2)models.The research performed fitting on O3in following 14 days with SPSS,as follows:
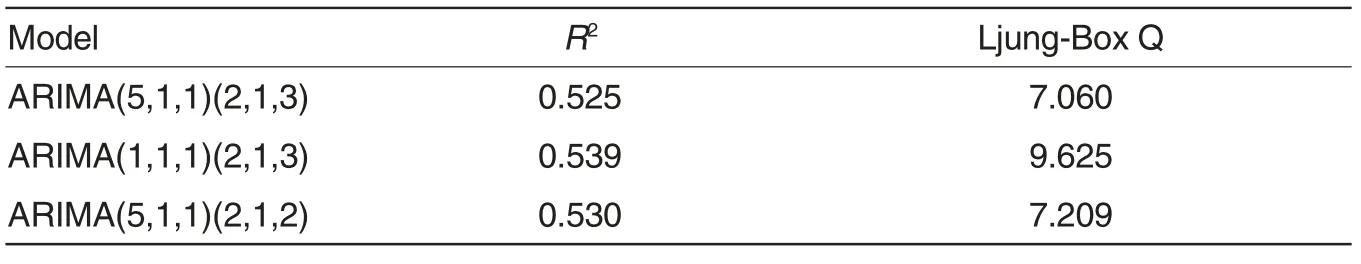
Table 1 Comparisons of O3 model
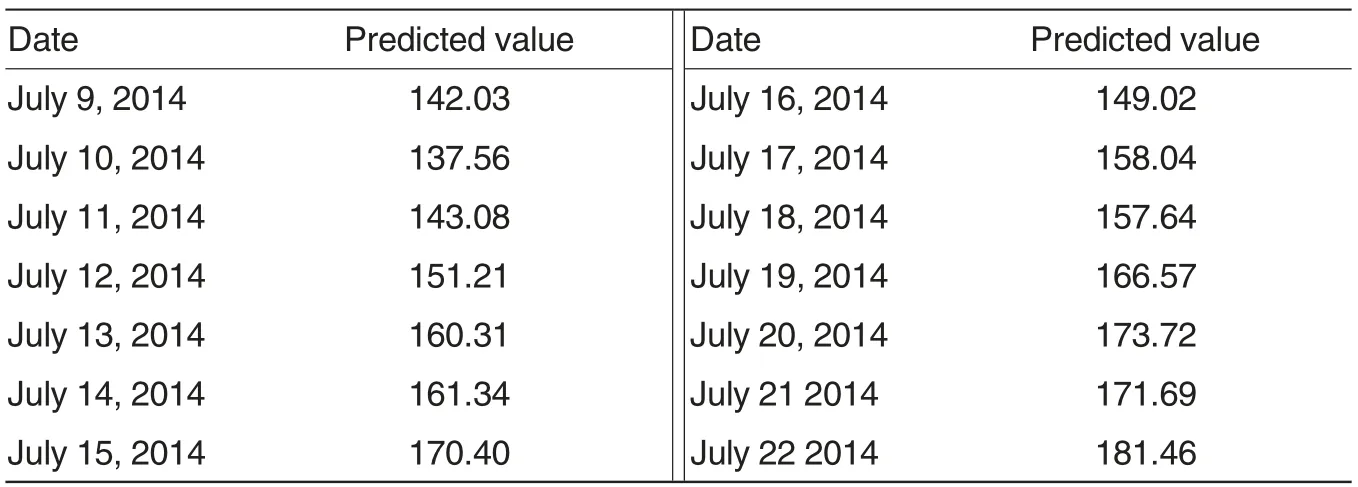
Table 2 The predicted values of O3 in following 14 days in Baoding
Model evaluation
An autoregressive integrated moving average (ARIMA) model is a common and effective way in time series analysis and it is fitted to time series data to predict future points in the series,with time (t) as a random variable[5]. The autocorrelation of such random variables indicates extension of predicted objects’ trend and once the autocorrelation is described by mathematical model, future points can be predicted from the past and present values. The research performed analysis on relative errors based on data issued by national environmental monitoring website[4]and concluded the error range was in 5%-15%, so that the prediction model and data were reliable.
Analysis on results
As shown in Fig.5, O3kept increasing in a fluctuated way and it canbe concluded from the predicted values that the concentration of O3was higher. The causes can be concluded as follows:
With economy development, motor vehicles and population keep growing, increasing O3concentrations in Baoding, deteriorated by pollutants from industry, transportation and urban non-point pollution.
O3discharged in urban suburbs is increasing by winds, resulting in high concentration of O3in Baoding.
The lower wind speed on ground in hot summer is conductive to production of photochemical smog and accumulation of pollutants[6].
Conclusion
The research described trends of pollutants in Baoding with analysis of time series and made predictions on future pollutants.
Pollutant concentrations have been linked to some meteorological factors. For instance, the concentration tends to be volatile upon season factors[6].
High temperature and low wind speed are adverse for expansion of pollutants, but conductive to O3accumulation[7]. Therefore, O3is a major pollutant in summer.
In spring, O3concentration keeps lower relative to summer and it can be concluded that high illumination is a leading factor of high-concentrated O3[8].
[1]SHEN Y(沈琰),YANG WF(杨卫芬),CAI HW (蔡惠文), et al. Analysis on typical case and cause of ozone pollution phenomena in Changzhou (常州市典型臭氧污染天气过程及成因分析研究) [J].Environmental Science and Management (环境科学与管理),2013,38(12):173-177.
[2]SI ZJ (司志娟). Prediction of air quality based on grey neural network model(基于灰色神经网络组合模型的空气质量预测)[D].2014,08:1-5.
[3]ZHANG SJ (张树京), QI LX (齐立心).Brief course of time series analysis (时间序列分析简明教程)[M].Baoding:Beijing Jiaotong University Press (保定:北方交通大学出版社).2003.9.
[4]The monitored data of national air quality(全国空气质量监测数据),http://www.cnemc.cn/publish/totalWebSite/hjjc_index. html HYPERLINK "html% 5bOL"HYPERLINK "html% 5bOL" HYPERLINK"html%5bOL"[OL],2014/11/25.
[5]WU HC (吴昊澄), XU XQ (徐旭卿),WANG Z (王臻), et al. Application of ARIMA model for estimating the incidence of bacillary dysentery (浙江省细菌性痢疾月发病率ARIMA 模型建立及预测分析)[J].2012,24(1):14-16.
[6]ZHOU ZY (周兆媛),ZHANG SH (张时煌),GAO QX(高庆先),et al.The impact of meteorological factors on air quality in the Beijing-Tianjin-Hebei region and trend analysis (京津冀地区气象要素对空气质量的影响及未来变化趋势分析)[J].Resources Science ( 资源科学),2014,36(1):191-199.
[7]WANG XS (王雪松).Ozone source attribution during a severe photochemical smog episode in Beijing(北京地区臭氧的来源分析)[J].Science in China (中国科学),2009,39(6):548-559.
[8]XU JL(徐家骝),ZHU YX(朱毓秀).Effects of the meteorological factors on the ozone pollution near the ground (气象因子对近地面臭氧污染影响的研究)[J],Chinese Journal of Atmospheric Sciences (大气科学), 1994,18 (6): 751-755.
猜你喜欢
煤气与热力(2021年10期)2021-12-02 05:11:46
中学生数理化·八年级物理人教版(2017年12期)2017-04-18 12:59:46
环境保护与循环经济(2017年3期)2017-03-03 20:08:30
中国蔬菜(2016年8期)2017-01-15 14:23:43
汽车与安全(2016年5期)2016-12-01 05:22:14
汽车与安全(2016年5期)2016-12-01 05:22:13
中国环境监察(2016年11期)2016-10-24 05:25:12
中国卫生(2015年10期)2015-11-10 03:14:32
少儿科学周刊·少年版(2015年1期)2015-07-07 21:57:30
中国卫生(2014年12期)2014-11-12 13:12:34
 Agricultural Science & Technology2015年10期
- Agricultural Science & Technology的其它文章
- Research Advances in Gene Regulation and Genetic Improvement of Fish Feeding
- Instrucions for Authors
- Cambridge Scientific Abstracts (CSA)
- Overview of Pharmaceutical Research on the Poria with Hostwood of Traditional Chinese Medicine
- Molecular Marker Assisted Selection for Fusarium Wilt Resistance Breeding in Watermelon(Citrullus lanatus)
- Study on Relative Soil and Water Conservation Benefits of Ridge Tillage in Different Terrain Conditions in the Black Soil Area of Northeast China