
Meta-analysis of the relationship of peripheral retinal nerve fiber layer thickness to Alzheimer’s disease and mild cognitive impairment
2015-12-08 12:26MeijuanWANGYingboZHUZhongyongSHIChunboLIYuanSHEN
上海精神医学 2015年5期
Meijuan WANG, Yingbo ZHU, Zhongyong SHI Chunbo LI, Yuan SHEN*
•Systematic review and meta-analysis•
Meta-analysis of the relationship of peripheral retinal nerve fiber layer thickness to Alzheimer’s disease and mild cognitive impairment
Meijuan WANG1,#, Yingbo ZHU1,#, Zhongyong SHI1, Chunbo LI2, Yuan SHEN1,*
Alzheimer’s disease; mild cognitive impairment; retinal nerve fiber layer; meta-analysis
1. Introduction
Alzheimer’s disease (AD) is one of the most common types of dementia.[1]In 2015 there were more than 46 million individuals with AD in the world and, based on expected increases in life expectancy, by 2050 the number of individuals with AD will surpass 100 million.[2]AD has an insidious onset that makes it difficult to diagnose in the early stages. There are, moreover, no effective treatments once the disease has become clinically evident,[3]so early recognition, diagnosis, and preemptive treatment is one of the best potential options for delaying the development of AD. However, there is, as yet, no biomarker that can accurately identify prodromal AD.[4]
The visual cortex is the part of the brain that controls some of the earliest clinical manifestations of AD.[5,6]Abnormalities in visual-related functions, such as difficulty with reading and searching for targets,depth perception disabilities, and decline of spatial contrast sensitivity, are evident in individuals in the early stages of AD.[7]Moreover, throughout the course of AD, the retina experiences neurodegenerative changes,including loss of retinal ganglion cells and nerve fibers,macular degeneration, and increases in optic disc cupping.[5]The retina and the central nervous system(CNS) are homologous during embryonic development,so the retina is the only part of the CNS that can be directly observed in living individuals. Thus, the thickness of the retinal nerve fiber layer (RNFL) may act as a window to assess ongoing changes in the CNS.[8]
Previous methods for measuring RNFL thickness,such as fundus photography, scanning laser ophthalmoscopy (SLO), and nerve fiber analysis (NFA),depended to some extent on subjective factors, so results tended to be unreliable between different raters.The current gold standard measurement method, optic coherence tomography (OCT), can accurately delineate the 10 layers of fiber structures in the optic nerve,and it is fast, noninvasive, and economical. In the past decade studies using OCT have generally reported that the thickness of the peripheral RNFL among individuals with AD and mild cognitive impairment-which is often an early transitional state prior to dementiawere significantly thinner than the peripheral RNFL thicknesses of age-matched normal controls.[9-11]But there were significant differences in results for the four different quadrants of the optic nerve. Some studies showed a significant change in the superior quadrant;[11-15]others showed significant changes in the inferior quadrant;[11,14,15]while still others showed significant changes in the temporal quadrant.[14,16,17]Moreover, there were inconsistent findings about differences of RNFL thickness between individuals with AD and those with MCI; some studies showed that individuals with AD had significantly thinner RNFL than individuals with MCI,[14,17]but other studies did not support this fi nding.[11,15,18]
To clarify the relative importance of RNFL in different optic nerve quadrants and to summarize results comparing RNFL results for persons with AD versus those for persons with MCI, this systematic review and meta-analysis pools data about RNFL thickness from studies that meet rigorous inclusion criteria. The results are used to assess the potential usefulness of RNFL thickness as a biomarker for early AD.
2. Methods
2.1 Data retrieval
The article retrieval process is depicted in Figure 1.English databases considered include PubMed (1977-2015), Embase (1971-2015), ISI web of knowledge(1955-2015), Ovid/MEDLINE (1967-2015), Science Direct(1965-2015), and the Cochrane Library (1967-2015).Chinese databases considered include the Chinese National Knowledge Infrastructure (CNKI) database(1980-2015), the Chongqing VIP database for Chinese Technical Periodicals (VIP) (1996-2015), WANFANG DATA (1977-2015), and the China BioMedical Literature Service System (SinoMed) (1995-2015). The English search keywords were ‘retinal’, ‘retinal thickness’, ‘retinal nerve fiber layer’, ‘RNFL’, ‘AD’, ‘Alzheimer disease’, ‘MCI’,‘mild cognitive impairment’, ‘cognitive’, ‘dementia’,and ‘neurodegenerative disease’. The Chinese search terms included both the English terms and their Chinese equivalents. The electronic search for articles was completed before February 20, 2015.
We imported identified articles into Endnote X5 and deleted the duplicates. Two authors (MW and ZS) individually read the remaining article titles and abstracts in order to filter out articles which were not related to the present study. When they both judged an article suitable for inclusion or when they could not decide whether or not an article met the inclusion criteria, the full text was obtained for further screening.Reference lists of the selected full text articles were reviewed to identify other articles that may be suitable for inclusion, and the full text of these articles were also downloaded. The two authors then individually read the full texts and decided the fi nal selection of articles based on the pre-determined inclusion and exclusion criteria. If the two authors disagreed about an article,they discussed it together to make a fi nal decision.
2.2 Inclusion and exclusion criteria
The inclusion criteria were as follows: a) cross-sectional research related to RNFL thickness in individuals with AD or MCI; b) provides mean (sd) values for peripheral RNFL thickness; c) uses internationally recognized criteria for diagnosing AD and MCI, such as the criteria established by the National Institute of Neurologic and Communicative Disorders and Stroke-Alzheimer’s Disease and Related Disorders Association (NINCDSADRDA),[19]the Diagnostic and Statistical Manual of Mental Disorders (DSM),[20]the Petersen criteria,[21]and so forth; and d) published in English or Chinese.
The exclusion criteria were as follows: a) articles that were not related to humans, b) systematic reviews,c) case reports, and d) duplicate reports.
2.3 Data acquisition and evaluation
Two authors (MW and ZS) individually gathered and evaluated the data. The results are shown in Tables 1 and 2. Recorded information included: name of the first author, publication date, location of the research,sample size, age, type of condition considered (AD or MCI), diagnostic criteria used, mini-mental state examination (MMSE) score, RNFL thicknesses (including total, and superior, inferior, nasal and temporal quadrant RNFL thicknesses), measurement methods for RNFL thickness, and the eyes tested (single or both).
Two authors (MW and ZS) independently assessed the quality of the included studies using the Newcastle-Ottawa Scale (NOS).[22]The scale has 8 items that are sub-divided into 3 dimensions: selection of case and control groups, comparability of case and control groups, and confirmation of exposure. The scale’s overall score ranges from 0-9. The inter-rater reliability of the two raters’ independent assessments of study quality was excellent (intraclass correlation coefficient[ICC]=0.96).
2.4 Statistical analysis
We built a database and analyzed the data using RevMan 5.3. Extraction of the data in each study about RNFL thickness included means (weighted mean difference, [WMD]) and standard deviations(95% confidence intervals, 95% CI). When I2≤50% and p>0.10 (I2is the measure of the degree of heterogeneity between different studies), the included studies wereconsidered homogeneous so a fixed effect model was used to assess the pooled results; when 50%

Figure 1. Identification of studies included in the analysis
3. Results
3.1. Characteristics of included studies
As shown in Figure 1, 22 of the 3749 non-duplicated studies identified in the electronic search met the inclusion and exclusion criteria. Of the included studies, 18 were published in English-language journals[9-12,14-16,18,25-34](of which 5 were conducted in China[12,14,25-27]) and 4 were published in Chineselanguage journals.[13,17,23,24]Three pairs of studies (Shen[25]and Shi[26]; Min[24]and Lu[27]; and Deng[23]and Chen[13])were based on the same databases, so only one of each pair was retained. Thus there were 19 studies included in the analysis, all of which were cross-sectional studies.One of these studies was only available as an abstract;[28]we tried to contact the corresponding and fi rst authors of the article to get a copy of the full text, but received no reply.
The characteristics of the 19 studies published between 2001 and 2015 are shown in Table 1 and the crude results used in the analyses are shown in Table 2. The studies were conducted in nine countries:6 were from China;[12-14,17,24,25]3 from Turkey;[9,18,29]3 from Spain;[16,30,31]2 from Italy;[10,28]and 1 each from Singapore,[15]France,[32]Canada,[33]the United Kingdom,[34]and Israel.[11]The pooled sample size of the 19 studies was 1455 subjects, including 508 with AD,299 with MCI, and 718 controls.
Twelve of the 19 studies included individuals with mild or moderate AD.[9-14,24,29,30,32-34]Four did not specify the severity of disease,[15,17,18,31]and 4 did not provide MMSE scores of individuals with AD.[10,15,17,28]One study classified AD as ‘mild’, ‘moderate’ and ‘severe’,[24]and one classified AD as ‘mild’ and ‘moderate or severe’;[32]to minimize heterogeneity in the results of the included studies, we only extracted the data of individuals with mild AD from these 2 studies. Fourteen studies provided data of peripheral RNFL thickness (including the total,superior, inferior, nasal and temporal quadrant RNFL thicknesses);[9-15,17,24-25,28-29,31,33]two studies only provided data on the RNFL thickness of the 4 optical nerve quadrants;[16,34]and 3 studies only provided data on total RNFL.[18,30,32]We tried to contact the corresponding authors of these studies; only one author replied,[18]indicating that the study had not gathered data about RNFL thickness in each quadrant.
Apart from one study which was only available in abstract and did not provide the AD and MCI diagnostic criteria,[28]other studies diagnosed individuals with AD by use of the NINCDS-ADRDA guidelines or DSM criteria. Most studies involving individuals with MCI diagnosed individuals with MCI using the Petersen criteria; one used Winbald criteria;[31]and one based the MCI diagnosis on memory complaints, and scores in the delayed memory test of the MMSE.[32]
Aside from 1 study which used NFA to measure RNFL thickness,[33]the other studies all used OCT. Six of the studies only measured a single eye;[9,10,12,15,16,33]11 studies measured both eyes and reported the mean RNFL thickness of both eyes;[11,13,14,18,24,25,29,30,31,32,34]1 study provided separate measures of the RNFL thickness in the right and left eyes (the results were similar, so we used the data for the right eye);[31]and 2 studies did not mention whether a single eye or both eyes had been assessed.[17,28]
Eighteen studies found that RNFL thicknesses among individuals with AD or MCI were significantly thinner than that in the controls; the remaining study showed inconsistent results.[33]Some studies that compared RNFL thickness in each quadrant of the optic nerve between different groups of individuals reported that the RNFL thicknesses of individuals with AD or MCI were significantly thinner than that in controls in the superior[9,12-15,17,34]and inferior quadrants;[11,14,25]while other studies found significant differences in the temporal quadrant.[14,16,17]Comparing RNFL thickness in individuals with AD versus that in individuals with MCI, 3 studies found that the RNFL thickness among individuals with AD was significantly thinner than that among individuals with MCI,[14,31,32]and 4 studies showed thinner RNFL in AD than in MCI, but the difference was not statistically significant.[11,15,18,25]
3.2 Quality assessments and publication bias of included studies
We used the NOS scale to assess the quality of the included studies. One study was only an abstract, so we did the quality assessments on 18 studies. The mean ratings of the two independent raters are shown in Table 1. The overall score ranged from 4 to 8 (the theoretical range is 0 to 9), and the mean (sd) score was 5.66 (1.79).The NOS scale does not have a standard cutoff score for ‘high-quality’ studies, so we chose to classify studies with NOS scores of 7 or higher as ‘high-quality’. Based on this cutoff score, 7 of the 18 studies (39%) were classified as ‘high-quality’; 6 of these 7 high-quality
studies were conducted in China. The main reasons studies were rated as ‘low-quality’ included using other psychiatric inpatients as controls and not using blinded evaluation of the RNFL assessment. In the absence of additional information, the study for which we only had an abstract[28]was also classified as ‘low-quality’.

Table 1. Characteristics of studies included in the systematic review

Table 1. Characteristics of studies included in thesystematic review (continued)

Table 2. Total andfour quadrant mean(sd) retinal nerve fiber layer (RNFL) thickness for normal controls (NC), individuals with Mild Cognitive Impairment (MCI), andindividuals withAlzheimer’s Disease (AD) in the studies included ineachof the comparative analyses

Table 2. Total andfour quadrant mean (sd) retinal nerve fiber layer (RNFL) thickness for normal controls (NC), individuals with Mild Cognitive Impairment (MCI), andindividuals with Alzheimer’s Disease (AD) in the studies included in each of thecomparativeanalyses (continued)
We analyzed the possibility of publication bias among the 17 studies which compared total RNFL thickness between individuals with AD or MCI and normal controls. As shown in Figure 2, the funnel plot depicted an obvious asymmetry, indicating publication bias with smaller studies showing a greater mean difference in RNFL thickness between normal controls and those with AD or MCI.

Figure 2. Funnel plot of publication bias in comparison of mean total retinal nerve fiber layer (RNFL) thickness between cases and controls for 17 studies
3.3 Differences between the RNFL thickness among individuals with Alzheimer’s disease and normal controls
The heterogeneity test for the 16 studies that compared the total RNFL thickness of individuals with AD to that of normal controls[9-15,17,18,24,28-33]indicated high heterogeneity (I2=97%), and sensitivity analysis (i.e.,removing studies with extreme results and those that accounted for a disproportionately large part of the pooled sample) did not fi nd the source of heterogeneity,so we used subgroup analysis to further explore the source of heterogeneity. We classified studies based on quality: high-quality group had NOS scores > 7; lowquality group had NOS scores <7. As shown in Figure 3A,the 6 high-quality studies had improved homogeneity for total RNFL thickness (I2=70%), but the 10 low-quality studies remained quite heterogeneous (I2=98%). Metaanalysis using a random effects model of the pooled sample of 578 subjects from the 6 high-quality studies found a weighted mean difference (WMD) of -7.34(95% CI, -11.29 to -3.40; p<0.001). Thus, when only considering the methodologically stronger studies,the total RNFL thickness of individuals with AD was significantly thinner than that of normal controls.
Heterogeneity tests for the 15 studies that compared RNFL thicknesses in each of the four quadrants of the optic nerve of individuals with AD to normal controls[9-17,24,28,29,31,33,34]found I2values ranging from 87% to 98%, indicating high heterogeneity between the studies. As was true for the total RNFL thickness, sensitivity analysis did not identify the source of the heterogeneity, but subclassification of the studies into 6 high-quality studies and 9 low-quality studies found that the homogeneity was sufficient to justify pooling results of the 6 high-quality studies for the RNFL thickness in superior (I2=30%), inferior (I2=53%), and nasal (I2=7%) quadrants, but the high heterogeneity of the high-quality study results for the temporal quadrant(I2=82%) precluded conducting a meta-analysis. Results for the 9 low-quality studies indicate high heterogeneity of RNFL thickness for all four quadrants (I2>75%), so it was not possible to pool the results in meta-analyses.Meta-analysis using fixed effect models in the pooled sample of 578 in the 6 high-quality studies found a WMD of -7.92 (95% CI, -8.58 to -7.26, p<0.001) for the superior quadrant (Figure 3B) and a WMD of 0.03(95% CI, -1.28 to 1.34, p=0.960) for the nasal quadrant;meta-analysis using a random effects model in these 6 studies found a WMD of -9.53 (95% CI, -13.51 to -5.5,p<0.001) for the inferior quadrant (Figure 3C). Thus,based on results from the high-quality studies, the RNFL thickness in the superior and inferior quadrants of the occipital nerve was significantly thinner in individuals with AD than in normal controls, but this was not the case in the nasal or temporal quadrants.
3.4 Differences between the retinal nerve fiber layer thickness of individuals with MCI and normal controls
Heterogeneity tests of the results for the 9 studies that compared total RNFL thickness between individuals with MCI and normal controls[11,14,15,17,18,24,25,31,32]showed high heterogeneity (I2=97%). Sensitivity analysis did not fi nd the source of heterogeneity, but subgroup analysis found that the 5 high-quality studies were sufficiently homogenous (I2=0%) to justify pooling the results using a fi xed effect model while the 4 low-quality studies were sufficiently homogeneous (I2=75%), to justify pooling the results using a random effects model. Meta-analysis of the pooled sample of 541 individuals from the 5 high-quality studies using a fixed effect model found a WMD of -1.20 (95% CI, -1.79 to -0.60, p<0.001), and meta-analysis of the pooled sample of 218 individuals
from the 4 low-quality studies using a random effects model found a WMD of -12.22 (95% CI, -15.56 to -8.88)(Figure 4A). This indicates that total RNFL thickness in individuals with MCI was significantly thinner than that in normal controls.

Figure 3. Comparison of retinal nerve fiber layer (RNFL) thickness in individuals with Alzheimer’s disease (AD)versus normal controls (NC) stratified by study quality3A: TOTAL RNFL THICKNESS, POOLING RESULTS FOR THE 6 HIGH-QUALITY STUDIES[Note: I2 for low-quality studies >75%, so result for low-quality studies is not interpretable.]

3B: SUPERIOR QUADRANT RNFL THICKNESS, POOLING RESULTS FOR THE 6 HIGH-QUALITY STUDIES[Note: I2 for low-quality studies >75%, so result for low-quality studies is not interpretable].

3C: INFERIOR QUADRANT RNFL THICKNESS, POOLING RESULTS FOR THE 6 HIGH-QUALITY STUDIES[Note: I2 for low-quality studies >75%, so result for low-quality studies is not interpretable.]
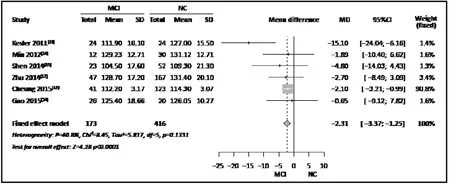
Heterogeneity tests for the 7 studies which provided the data about RNFL thickness in each quadrant,[11,14,15,17,24,25,31]indicated high heterogeneity of the results for the superior, inferior, and temporal quadrants (I2>75%). Sensitivity analysis found that after removing the study by Ascaso,[31]the I2value for the superior quadrant results dropped from 89% to 17%and that for the inferior quadrant dropped from 81% to 41%, indicating that the low-quality study by Ascaso[31](which, based on MMSE scores, included individuals with relatively severe AD) was the reason for the heterogeneity of the 7 studies in these two quadrants.Meta-analysis of the pooled sample of 589 subjects in the remaining 6 studies using a fi xed effect model found a WMD of -2.87 (95% CI, -3.84 to -1.91, p<0.001) for the superior quadrant (Figure 4B), and a WMD of -2.31(95% CI, -3.37 to -1.25, p<0.001) for the inferior quadrant(Figure 4C), indicating that, based on the subset of studies that excludes the study by Ascaso,[31]the RNFL thickness in the superior and inferior quadrants of the optic nerve of individuals with MCI were significantly thinner than those in normal controls.
We also did sensitivity analysis for the RNFL results for the temporal quadrant and found that after removing Cheung’s study[15]I2declined from 82% to 48%,suggesting that this study was the reason for the high heterogeneity. As shown in Figure 4D, meta-analysis of the pooled sample of 487 individuals in the remaining 6 studies using a fi xed effect model found a WMD of -6.92(95% CI, -9.48 to -4.35, p<0.001), indicating that, based on the subset of studies that excludes the study by Cheung,[15]the RNFL thickness in the temporal quadrant of the optic nerve among individuals with MCI was significantly thinner than that in normal controls.
Heterogeneity tests for the results for the nasal quadrant in the 7 studies that compared individuals with MCI to normal controls found an I2of 48%; metaanalysis of the pooled sample of 651 individuals in the 7 studies using a fi xed effect model found a WMD of 0.59(95% CI, -0.07 to 1.25, p=0.080), indicating no significant difference in the thickness of the nasal quadrant of the optic nerve in individuals with MCI compared to that in normal controls.

Figure 4. Comparison of retinal nerve fiber layer (RNFL) thickness in individuals with mild cognitive impairment (MCI) versus normal controls (NC)4A: TOTAL RNFL THICKNESS (stratified by study quality)[Note: When using a fixed effect model on the 5 high-quality studies, the WMD (95% CI) is unchanged]

4B: SUPERIOR QUADRANT RNFL THICKNESS (sensitivity analysis, removing study by Ascaso[31])
4C: INFERIOR QUADRANT RNFL THICKNESS (sensitivity analysis, removing study by Ascaso[31])

4D: TEMPORAL QUADRANT RNFL THICKNESS (sensitivity analysis, removing study by Cheung[15])
3.5 The differences between the retinal nerve fiber layer thickness of individuals with AD and individuals with MCI
Heterogeneity testing for the 8 studies that compared total RNFL thickness in individuals with AD versus that in individuals with MCI,[11,14-15,17-18,24,31-32]found high heterogeneity (I2=79%). The I2declined substantially (to 40%) after removing Ascaso’s study[31]in the sensitivity analysis. As shown in Figure 5A, meta-analysis of the pooled sample of 432 individuals in the remaining 7 studies using a fi xed effect model found a SMD of -2.23(95% CI, -2.79 to -1.67, p<0.001), indicating that, based on the subset of studies that excludes the study by Ascaso,[31]the total RNFL thickness in individuals with AD was significantly thinner than that in individuals with MCI.
Assessment of the heterogeneity testing of the 6 studies which provided data for RNFL thickness in each quadrant[11,14-15,17,24,31]found that I2in the superior quadrant was 47%; meta-analysis of the pooled sample of 364 subjects in the 6 studies using a fixed effect model found a SMD of -5.29 (95% CI, -6.26 to -4.32,p<0.001) (Figure 5B), indicating significantly thinner RNFL in the superior quadrant of the optic nerve of individuals with AD versus that in individuals with MCI.The I2for the results of the 6 studies for the inferior quadrant was 66%; meta-analysis of the pooled sample of 364 subjects using a random effects model (Figure 5C) found a WMD of -8.44 (95% CI, -14.18 to -2.70,p=0.004), indicating that the inferior quadrant of the optic nerve in individuals with AD is also significantly thinner than that in individuals with MCI.
The I2for the results of the 6 studies for the temporal quadrant of the optic nerve was 50%. Metaanalysis of the pooled sample of 364 subjects using a fi xed effect model found a WMD of -0.43 (95% CI, -1.21 to 0.34, p=0.270), indicating no significant difference in the thickness of the temporal quadrant of the optic nerve between individuals with AD and those with MCI.
The I2for the results in the 6 studies for the nasal quadrant was 76%; a sensitivity analysis indicated that the study by Ascaso[31]was the cause of the high heterogeneity. After deleting this study, the I2dropped to 0% and a meta-analysis of the pooled sample of 325 subjects in the 5 remaining studies using a fi xed effect model found a WMD of -0.40 (95% CI, -1.07 to 0.26,p=0.230), indicating that, based on the subset of studies that excludes the study by Ascaso,[31]the thickness of the nasal quadrant of the optic nerve in persons with AD is not significantly different from that of persons with MCI.
4. Discussion
4.1 Main findings
Assessing RNFL thickness using the Optical Coherence Tomography (OCT) technology is safe, quick, and relatively accurate, so there is a substantial and growing literature about the potential power of the method to predict the onset of MCI and AD. We found 19 studies,including 6 from China (4 of which had only been published in Chinese), that assess total RNFL thickness and RNFL thickness in the 4 quadrants of the optic nerve in AD or MCI. Most of the studies had relatively small sample sizes, the severity of MCI and AD varied considerably across studies, and only a minority of the studies were methodologically robust, so it is not surprising that the results were quite heterogeneous.When restricting the analysis to 6 high-quality studies (5 were conducted in China and 1 in Singapore), the metaanalysis of the pooled sample indicated that the total RNFL thickness and that in the superior and inferior quadrants of the visual nerve were significantly thinner in individuals with AD than in matched healthy controls.Similarly, pooling results from 5 high-quality studies that compared RNFL results for MCI and controls,indicated significantly thinner total RNFL in MCI than in controls, and pooling results from studies that provided quadrant-specific results showed significantly thinner RNFL in the superior, inferior, and temporal quadrants of individuals with MCI versus that in normal controls.Results from studies that directly compared RNFL thickness in individuals with mild or moderate AD to that in individuals with MCI found (after removing one outlier study) that RNFL thickness was significantly thinner in individuals with AD than in individuals with MCI. Thus, there appears to be a progressive thinning of the RNFL as cognitive functioning declines. This fi nding confirms several community-based studies that report that RNFL becomes thinner with age[35-37]and as cognitive function declines.[38-40]These changes are most evident in the superior and inferior quadrants of the optic nerve, but there does not appear to be any quadrant-specific results, so there is no clear advantage to using quadrant-specific measures of RNFL thickness instead of the measure for total RNFL thickness.
4.2 Limitations
This analysis has had four major limitations. First, the sample sizes of the included studies were generally small; only 2 of the 19 studies[15,17]had more than 100 subjects. This meant that the pooled samples used in the different meta-analyses were also relatively small.Second, the overall research quality was low; only 7 of the 19 studies were judged to be ‘high-quality’. Third,potential confounders such as age, gender, smoking history, blood pressure, blood sugar, blood lipids, and so forth, were not considered. All of the studies were crosssectional, so there was no opportunity to demonstrate progressive thinning of RNFL with cognitive decline.Finally, there was a clear publication bias in the included studies (with smaller studies favoring larger differences between cases and controls) and several of the included studies did not have blind raters assess the RNFL(increasing the risk of performance bias).

Figure 5. Comparison of retinal nerve fiber layer (RNFL) thickness in individuals with Alzheimer’s disease (AD)versus mild cognitive impairment (MCI)5A: TOTAL RNFL THICKNESS (sensitivity analysis, removing study by Ascaso[31])

5B: SUPERIOR QUADRANT RNFL THICKNESS
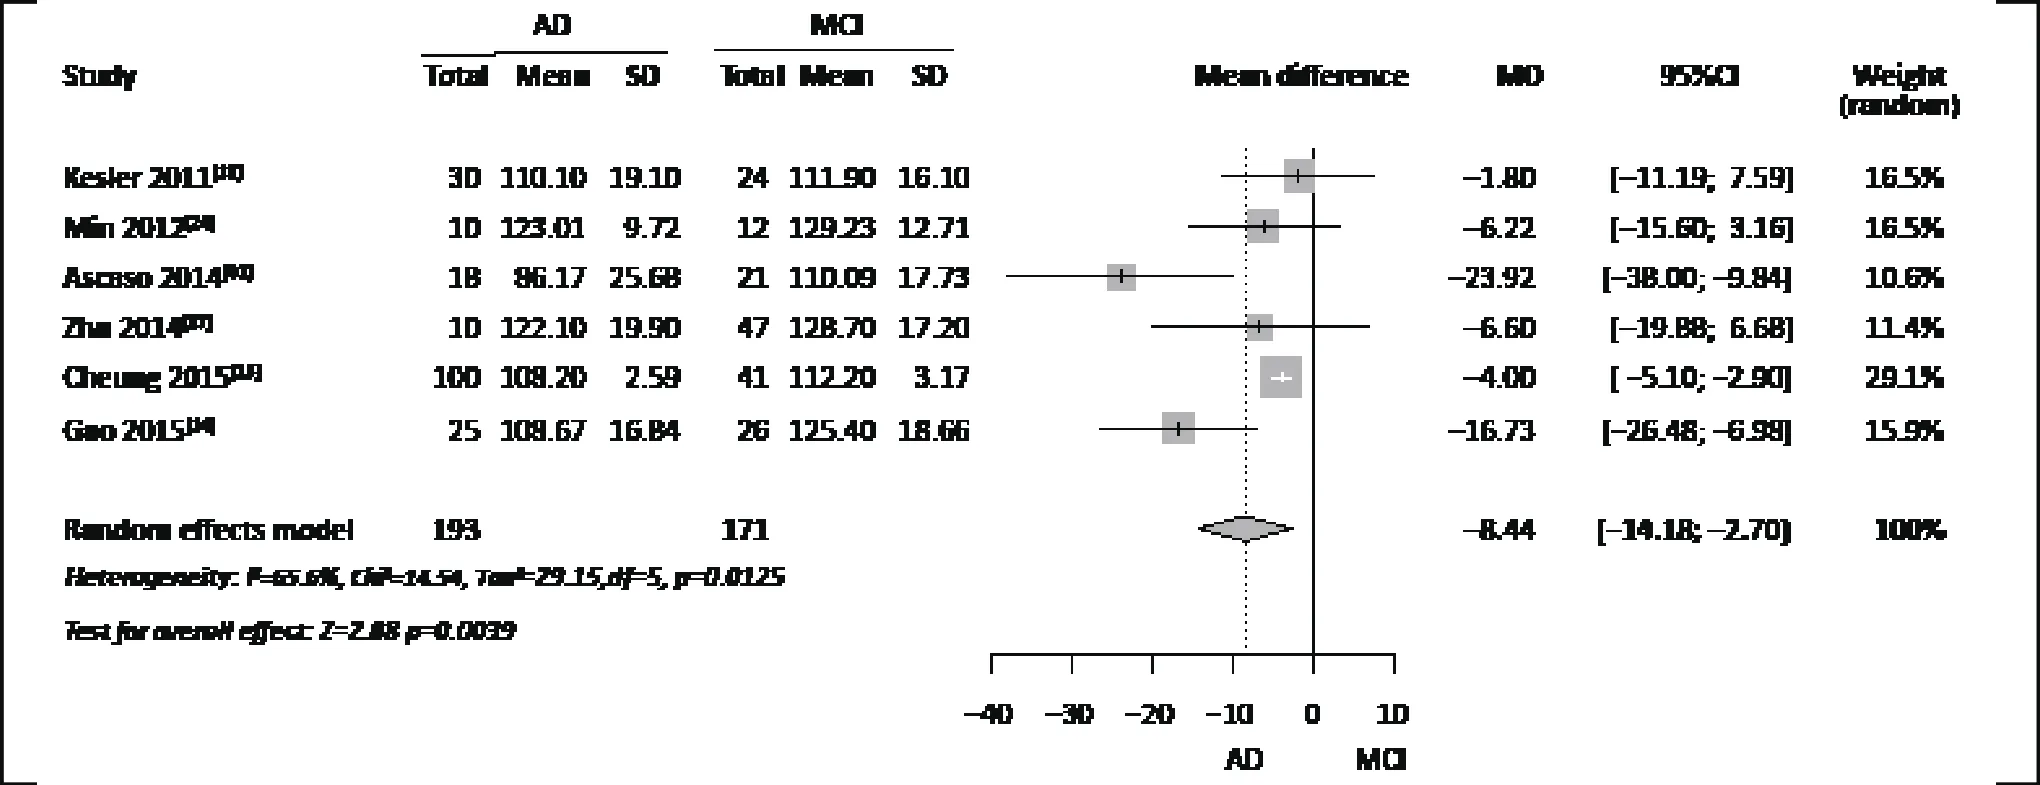
5C: INFERIOR QUADRANT RNFL THICKNESS
4.3 Importance
Abnormality in retinal tissues is closely related to pathological changes of the central nervous system so neurodegenerative diseases such as AD should be ref l ected in changes in the optic nerve. This systematic review and meta-analysis included 19 studies (4 of which were only available in Chinese) that compared peripheral RNFL thickness of individuals with AD,MCI, and age and gender matched normal controls.The results show that RNFL thickness – primarily the total thickness and that in the superior and inferior quadrants of the visual nerve – was significantly thinner in individuals with MCI than in normal controls and significantly thinner in individuals with AD than in individuals with MCI. This progressive thinning as the severity of cognitive decline increases suggests that RNFL thickness could be used as marker for the detection of early AD. The lack of unique findings by quadrant of the visual nerve suggests that the total RNFL score is sufficient; reporting RNFL results by quadrant does not increase the predictive power of the information.
Acknowledgement
The authors thank the reviewers and editors for their helpful comments.
Funding
National Foundation of Natural Science (81200833;81371505; 81571034), the Shanghai Municipal Commission of Science and Technology (134119a2501),and the Shanghai Mental Health Center (2013-YJ-09).
Conflict of interest statement
The authors report no conflict of interest related to this manuscript.
1. Ferri CP, Prince M, Brayne C, Brodaty H, Fratiglioni L, Ganguli M, et al. Global prevalence of dementia: a Delphi consensus study. Lancet. 2005; 366(9503): 2112-2117. doi: http://dx.doi.org/10.1016/S0140-6736(05)67889-0
2. Alzheimer’s Disease International. World Alzheimer Report 2015, the Global Impact of Dementia: an Analysis of Prevalence, Incidence, Cost and Trends. London: Alzheimer’s Disease International; 2015
3. Salloway S, Sperling R, Brashear HR. Phase 3 trials of solanezumab and bapineuzumab for Alzheimer’s disease. N Engl J Med. 2014; 370(15): 1460
4. Fiandaca MS, Mapstone ME, Cheema AK, Federoff HJ.The critical need for defining preclinical biomarkers in Alzheimer’s disease. Alzheimers Dement. 2014; 10(3 Suppl):S196-212. doi: http://dx.doi.org/10.1016/j.jalz.2014.04.015
5. Guo L, Duggan J, Cordeiro MF. Alzheimer’s disease and retinal neurodegeneration. Curr Alzheimer Res. 2010; 7(1): 3-14. doi: http://dx.doi.org/10.2174/156720510790274491#sthash.9V6guXgA.dpuf
6. Tsilis AG, Tislidis KK, Pelidou SH, Kitisos G. Systematic review of the association between Alzhemer's diseease and chronic gaucoma. Clin Ophthalmol. 2014; 13(8): 2095-2104. doi:http://10.2047/OPTH.S09534
7. Kirby E, Bandelow S,Hogervorst E. Visual impairment in Alzheimer’s disease: a critical review. J Alzheimers Dis. 2010;21(1): 15-34.
8. Galetta KM, Calabresi PA, Frohman EM,Balcer LJ. Optical coherence tomography (OCT): imaging the visual pathway as a model for neurodegeneration. Neurotherapeutics. 2011;8(1): 117-132. doi: http://dx.doi.org/10.1007/s13311-010-0005-1
9. Kirbas S, Turkyilmaz K, Anlar O, Tufekci A, Durmus M. Retinal nerve fiber layer thickness in patients with Alzheimer's disease. J Neuroophthalmol. 2013; 33(1): 58-61. doi: http://dx.doi.org/10.1097/WNO.0b013e318267fd5f
10. Parisi V, Restuccia R, Fattapposta F, Mina C, Bucci MG,Pierelli F. Morphological and functional retinal impairment in Alzheimer’s disease patients. Clin Neurophysiol. 2001;112(10): 1860-1867. doi: http://dx.doi.org/10.1016/S1388-2457(01)00620-4
11. Kesler A, Vakhapova V, Korczyn AD, Naftaliev E, Neudorfer M. Retinal thickness in patients with mild cognitive impairment and Alzheimer’s disease. Clin Neurol Neurosurg.2011; 113(7): 523-526. doi: http://dx.doi.org/10.1016/j.clineuro.2011.02.014
12. Chi Y, Wang Y, Yang l. [The investigation of retinal nerve fiber loss in Alzheimer’s disease]. Zhonghua Yan Ke Za Zhi. 2010;46(2): 134-139. Chinese
13. Chen Y, Sun Y. Changes of the thickness of retina nerve fiber layer in Alzheimer’s disease. Medical Bulletin of Shanghai Jiaotong University. 2013; 25(1): 19-23
14. Gao L, Liu Y, Li X, Bai Q, Liu P. Abnormal retinal nerve fiber layer thickness and macula lutea in patients with mild cognitive impairment and Alzheimer’s disease. Arch Gerontol Geriatr. 2015; 60(1): 162-167. doi: http://dx.doi.org/10.1016/j.archger.2014.10.011
15. Cheung CY, Ong YT, Hilal S, Ikram MK, Low S, Ong YL, et al.Retinal ganglion cell analysis using high-definition optical coherence tomography in patients with mild cognitive impairment and Alzheimer’s disease. J Alzheimers Dis. 2015;45(1): 45-56. doi: http://dx.doi.org/10.3233/JAD-141659
16. Garcia-Martin ES, Rojas B, Ramirez AI, de Hoz R, Salazar JJ,Yubero R, et al. Macular thickness as a potential biomarker of mild Alzheimer’s disease. Ophthalmology. 2014;121(5): 1149-1151.e3. doi: http://dx.doi.org/10.1016/j.ophtha.2013.12.023
17. Zhu LP, Ren XL, Wang YX, Xu L, Zhang XJ. [Retinal nerve fiber layer thickness in the patients with mild cognitive impairment or Alzheimer’s disease]. Yan Ke. 2014; 4: 231-234. Chinese
18. Oktem EO, Derle E, Kibaroglu S, Oktem C, Akkoyun I,Can U. The relationship between the degree of cognitive impairment and retinal nerve fiber layer thickness. Neurol Sci. 2015; 36(7): 1141-1146. doi: http://dx.doi.org/10.1007/s10072-014-2055-3
19. McKhann GM, Knopman DS, Chertkow H, Hyman BT,Jack CR, Jr, Kawas CH, et al. The diagnosis of dementia due to Alzheimer’s disease: recommendations from the National Institute on Aging-Alzheimer’s Association workgroups on diagnostic guidelines for Alzheimer’s disease.Alzheimers Dement. 2011; 7(3): 263-269. doi: http://dx.doi.org/10.1016/j.jalz.2011.03.005
20. Battle DE. Diagnostic and Statistical Manual of Mental Disorders (DSM). Codas. 2013; 25(2): 191-192
21. Petersen RC, Smith GE, Waring SC, Ivnik RJ, Tangalos EG, Kokmen E. Mild cognitive impairment: clinical characterization and outcome. Arch Neurol. 1999; 56(3):303-308. doi: http://dx.doi.org/10.1001/archneur.56.3.303
22. Stang A. Critical evaluation of the Newcastle-Ottawa scale for the assessment of the quality of nonrandomized studies in meta-analyses. Eur J Epidemiol. 2010; 25(9): 603-605. doi:http://dx.doi.org/10.1007/s10654-010-9491-z
23. Deng Y, Chen Y, Xie L, Wang G, Xu W, Tang H, et al.[Morphological change of retina in mild Alzheimer’s disease]. Zhen Duan Xue Li Lun Yu Shi Jian. 2009; 8(4): 397-400. Chinese
24. Min B, Zhang L, Lu Y, Zhou A, Wei C, Jia J. [Degeneration of optic nerve and retina in patients of mild cognitive impairment and Alzheimer’s disease]. Shen Jing Ji Bing Yu Jing Shen Wei Sheng. 2012; 12(5): 491-494. Chinese. doi: http://dx.chinadoi.cn/10.3969/j.issn.1009-6574.2012.05.018
25. Shen Y, Liu L, Cheng Y, Feng W, Shi Z, Zhu Y, et al. Retinal nerve fiber layer thickness is associated with episodic memory deficit in mild cognitive impairment patients. Curr Alzheimer Res. 2014; 11(3): 256-266. doi: http://dx.doi.org/1 0.2174/1567205011666140131114418
26. Shi Z, Wu Y, Wang M, Cao J, Feng W, Cheng Y, et al. Greater attenuation of retinal nerve fiber layer thickness in Alzheimer’s disease patients. J Alzheimers Dis. 2014; 40(2):277-283. doi: http://dx.doi.org/10.3233/JAD-131898
27. Lu Y, Li Z, Zhang XQ, Ming BQ, Jia JP, Wan R, et al. Retinal nerve fiber layer structure abnormalities in early Alzheimer’s disease: Evidence in optical coherence tomography. Neurosci Lett. 2010; 480(1): 69-72. doi: http://dx.doi.org/10.1016/j.neulet.2010.06.006
28. Ferrari L, Vitali F, Di Maggio G, Santangelo R, Houdayer E, Coppi E, et al. Retinal nerve fiber layer thinning as a mirror of neurodegeneration in Alzheimer’s disease. Clin Neurophysiology. 2014; 126(1): e8. doi: http://dx.doi.org/10.1016/j.clinph.2014.10.050
29. Iseri PK, Altinas O, Tokay T, Yuksel N. Relationship between cognitive impairment and retinal morphological and visual functional abnormalities in Alzheimer disease. J Neuroophthalmol. 2006; 26(1): 18-24. doi: http://dx.doi.org/10.1097/01.wno.0000204645.56873.26
30. Moreno-Ramos T, Benito-Leon J, Villarejo A, Bermejo-Pareja F. Retinal nerve fiber layer thinning in dementia associated with Parkinson’s disease, dementia with lewy bodies, and Alzheimer’s disease. J Alzheimers Dis. 2013; 34(3): 659-664.doi: http://dx.doi.org/10.3233/JAD-121975
31. Ascaso FJ, Cruz N, Modrego PJ, Lopez-Anton R, Santabarbara J, Pascual LF, et al. Retinal alterations in mild cognitive impairment and Alzheimer’s disease: an optical coherence tomography study. J Neurol. 2014; 261(8): 1522-1530. doi:http://dx.doi.org/10.1007/s00415-014-7374-z
32. Paquet C, Boissonnot M, Roger F, Dighiero P, Gil R,Hugon J. Abnormal retinal thickness in patients with mild cognitive impairment and Alzheimer’s disease. Neurosci Lett. 2007; 420(2): 97-99. doi: http://dx.doi.org/10.1016/j.neulet.2007.02.090
33. Kergoat H, Kergoat MJ, Justino L, Chertkow H, Robillard A,Bergman H. An evaluation of the retinal nerve fiber layer thickness by scanning laser polarimetry in individuals with dementia of the Alzheimer type. Acta Ophthalmol Scand.2001; 79(2): 187-191. doi: http://dx.doi.org/10.1034/j.1600-0420.2001.079002187.x
34. Berisha F, Feke GT, Trempe CL, McMeel JW, Schepens CL.Retinal abnormalities in early Alzheimer’s disease. Invest Ophthalmol Vis Sci. 2007; 48(5): 2285-2289
35. Wang YX, Pan Z, Zhao L, You QS, Xu L, Jonas JB. Retinal nerve fiber layer thickness. The Beijing Eye Study 2011. PLoS One.2013; 8(6): e66763. doi: http://dx.doi.org/10.1371/journal.pone.0066763
36. Alamouti B, Funk J. Retinal thickness decreases with age: an OCT study. Br J Ophthalmol. 2003; 87(7): 899-901
37. Bowd C, Zangwill LM, Blumenthal EZ, Vasile C, Boehm AG,Gokhale PA, et al. Imaging of the optic disc and retinal nerve fiber layer: the effects of age, optic disc area, refractive error,and gender. J Opt Soc Am A Opt Image Sci Vis. 2002; 19(1):197-207. doi: http://dx.doi.org/10.1364/JOSAA.19.000197
38. Laude A, Lascaratos G, Henderson RD, Starr JM, Deary IJ,Dhillon B. Retinal nerve fiber layer thickness and cognitive ability in older people: the Lothian Birth Cohort 1936 study. BMC Ophthalmol. 2013; 13: 28. doi: http://dx.doi.org/10.1186/1471-2415-13-28
39. van Koolwijk LM, Despriet DD, Van Duijn CM, Oostra BA,van Swieten JC, de Koning I, et al. Association of cognitive functioning with retinal nerve fiber layer thickness. Invest Ophthalmol Vis Sci. 2009; 50(10): 4576-4580. doi: http://dx.doi.org/10.1167/iovs.08-3181
40. Mok KH, Lee VW, So KF. Retinal nerve fiber layer measurement of the Hong Kong Chinese population by optical coherence tomography. J Glaucoma. 2002; 11(6):481-483
(received, 2015-09-07; accepted 2015-10-15)

Dr. Wang obtained her master’s degree from Tongji University School of Medicine in 2010. She is currently a medical resident in the Department of Psychiatry at the Tenth People’s Hospital of Tongji University, Shanghai. Her main research interests are senile cognition, cognitive aging, and psychosomatic diseases in general hospitals.
阿尔茨海默病和轻度认知功能障碍患者外周视神经纤维层厚度的meta分析
王美娟,竺映波,石中永,李春波,申远
阿尔茨海默病;轻度认知功能障碍;视网膜神经纤维层; meta分析
Background:Previous studies report that the thickness of the peripheral retinal nerve fiber layer (RNFL) in individuals with Alzheimer’s disease (AD) and mild cognitive impairment (MCI) is significantly thinner than in normal controls (NC), but RNFL thickness in different quadrants of the optic nerve remains unclear.Aim:Conduct a systematic review of studies that assess peripheral RNFL thickness in AD and MCI.Methods:Based on pre-defined criteria, studies in English or Chinese were identified from PubMed,Embase, ISI web of knowledge, Ovid/Medline, Science Direct, Cochrane Library, Chinese National Knowledge Infrastructure (CNKI), Chongqing VIP database, WANFANG DATA, and the China BioMedical Literature Service System (SinoMed). Review Manager 5.3 was used for analysis.Results:The 19 cross-sectional studies identified had a pooled sample of 1455 individuals. There was substantial heterogeneity between studies that compared RNFL in AD or MCI to normal controls, but this heterogeneity was primarily restricted to low-quality studies. Combining 6 high-quality studies (n=578)indicated that total RNFL thickness and the thickness of superior and inferior RNFL quadrants in AD were significantly thinner than in normal controls. Similarly, combining 5 high-quality studies (n=541) indicated significantly thinner total RNFL thickness in MCI than in controls. Six studies (n=589) found thinner RNFL in the superior and inferior quadrants in MCI than in controls; and 6 studies (n=487) found thinner RNFL in the temporal quadrant in MCI than in controls. Finally, 7 studies (n=432) indicated that total RNFL was thinner in AD than in MCI, and 6 studies (n=364) indicated thinner RNFL in the superior and inferior quadrants in AD than in MCI.Conclusions:Much of the heterogeneity in results from previous studies may be due to poor methodology.Peripheral RNFL thicknesses, particularly in the superior and inferior quadrants, becomes progressively thinner as cognitive function declines, so this could be a candidate biomarker for early identif i cation of AD.Methodologically rigorous studies in large population-based cohort studies that follow elderly individuals over time and that simultaneously collect information on potential mediating factors (such as blood pressure,blood glucose, and lipid levels) are needed to confirm or disprove the potential predictive value of RNFL.
[Shanghai Arch Psychiatry. 2015, 27(5): 263-279.
http://dx.doi.org/10.11919/j.issn.1002-0829.215100]
1Department of Psychiatry, Tenth People’s Hospital of Tong Ji University, Shanghai, China
2Shanghai Key Laboratory of Psychotic Disorders, Shanghai Mental Health Center, Shanghai Jiao Tong University School of Medicine, Shanghai, China
*correspondence: kmshy@sina.com
#joint fi rst authors
A full-text Chinese translation of this article will be available at http://dx.doi.org/10.11919/j.issn.1002-0829.215100 on February 26, 2016.
背景:既往研究发现阿尔茨海默病 (Alzheimer’s disease,AD) 和轻度认知障碍 (mild cognitive impairment, MCI) 患者外周视神经纤维层 (retinal nerve fiber layer, RNFL) 厚度显著薄于正常对照组 (normal control, NC),但视神经RNFL在各个象限的具体厚度尚不清楚。目的:运用系统综述综合评估AD和MCI患者的外周RNFL厚度。方法按照预先制定的纳入和排除标准,从PubMed、EMBASE、ISI Web of Knowledge、Ovid/Medline、Science Direct、Cochrane Library、中国知识资源总库(CNKI)、重庆维普数据库、万方数据和中国生物医学文献服务系统 (SinoMed) 筛选中英文研究。采用Review Manager 5.3软件进行统计分析。结果:共纳入19项横断面研究(含合并样本量1455例)。通过比较AD或MCI患者和正常对照的RNFL,发现各研究间的异质性很大,但这种异质性主要限于低质量研究。合并其中6项高质量研究(n=578) 后发现AD患者总的RNFL和上、下方象限的RNFL厚度较正常对照明显变薄。类似地,合并5项高质量研究 (n=541)后发现MCI患者总的RNFL厚度显著薄于对照组。有6项研究 (n=589) 发现MCI患者的上、下象限RNFL比对照组薄;而另外6项研究 (n=487) 发现MCI患者颞象限RNFL比对照组薄。最后,有7项研究 (n=432) 表明AD患者的总RNFL比MCI患者薄,而有6项研究 (n=364)显示AD患者的上、下象限RNFL比MCI患者薄。结论:既往研究结果的大部分异质性可能是由于方法学的不足。外周RNFL的厚度,特别是在上、下象限,在认知功能下降的同时逐渐变薄,所以这可以作为AD早期识别的候选辅助生物标记。我们需要进一步开展在方法学上更有说服力的、基于人群的队列研究来随访老年患者并同时收集潜在中介因素的信息(如血压、血糖和血脂水平),从而证实或证伪RNFL潜在的预测价值。
本文全文中文版从2016年2月26日起在
http://dx.doi.org/10.11919/j.issn.1002-0829.215100可供免费阅览下载
猜你喜欢
现代食品科技(2022年8期)2022-09-02
中老年保健(2022年2期)2022-08-24
中老年保健(2022年1期)2022-08-17
中学生数理化·高一版(2022年3期)2022-04-05
中国药理学通报(2022年3期)2022-03-22
初中生学习指导·提升版(2020年10期)2020-09-10
奥秘(2018年9期)2018-09-25
中成药(2017年10期)2017-11-16
中学生数理化·七年级数学人教版(2017年4期)2017-07-08
中华灾害救援医学(2015年7期)2016-01-07

- 上海精神医学的其它文章
- Adjunctive treatment with high frequency repetitive transcranial magnetic stimulation for the behavioral and psychological symptoms of patients with Alzheimer’s disease:a randomized, double-blind, sham-controlled study
- Effectiveness of Traditional Chinese Medicine (TCM) treatments on the cognitive functioning of elderly persons with mild cognitive impairment associated with white matter lesions
- Heredity in comorbid bipolar disorder and obsessive-compulsive disorder patients
- Assessment of a six-week computer-based remediation program for social cognition in chronic schizophrenia
- The effect of simple imputation on inferences about population means when data are missing in biomedical research due to detection limits
- Infanticide by a mother with untreated schizophrenia