海表水温变动对东、黄海鲐鱼栖息地分布的影响
2015-06-24 14:11:13苏杭陈新军汪金涛
海洋学报 2015年6期
苏杭,陈新军,汪金涛
(1. 上海海洋大学 海洋科学学院,上海 201306;2. 国家远洋渔业工程技术研究中心,上海 201306;3. 大洋渔业资源可持续开发省部共建教育部重点实验室,上海 201306;4. 远洋渔业协同创新中心,上海 201306 )
海表水温变动对东、黄海鲐鱼栖息地分布的影响
苏杭1,4,陈新军1,2,3,4*,汪金涛1,2,3,4
(1. 上海海洋大学 海洋科学学院,上海 201306;2. 国家远洋渔业工程技术研究中心,上海 201306;3. 大洋渔业资源可持续开发省部共建教育部重点实验室,上海 201306;4. 远洋渔业协同创新中心,上海 201306 )
海表水温(SST)通常是表征鱼类栖息地分布的主要指标。本文根据1999—2007年我国大型灯光围网的鲐鱼生产统计数据,结合海洋遥感获得的SST,分析了渔汛期间鲐鱼栖息地的适宜SST范围,探讨了SST变动情况下鲐鱼栖息地的变化趋势。研究结果表明,东、黄海鲐鱼7—12月的适宜SST范围为15~30℃。根据政府气候变化专门委员会(IPCC)第四份评估报告,本文拟定4种SST上升的情况,即(1)每月平均SST+0.5℃;(2)每月平均SST+1℃;(3)每月平均SST+2℃;(4)每月平均SST+4℃。结果显示,东、黄海鲐鱼的潜在栖息有明显向北移动的趋势,并且栖息地面积逐渐减小。研究认为,全球气候变化引起的SST上升,可能会对近海鲐鱼栖息地造成严重的影响。
鲐鱼;气候变化;海表水温升高;栖息地
1 引言
鲐鱼(Scomberjaponicus)属于近海浮游性鱼类,广泛分布于西太平洋以及沿岸区域。其资源主要由韩国、日本和中国(包括台湾省)的灯光围网渔船所捕获。已有的研究认为,鲐鱼资源出现了下降趋势[1—3],东、黄海大型灯光围网(不含群众灯光围网作业)鲐鱼产量在1.8万~2.3 万吨间波动[4]。国内外学者[5—9]对鲐鱼渔业生物学、渔场分布及其与海洋环境如表温、水团、厄尔尼诺等的关系[10—11]进行了比较系统的研究。鱼类栖息地是渔业资源与渔场学的重要研究内容[12—14],栖息地范围的变化直接受到各种环境因子的影响,进而也影响到鱼类的资源量及其空间分布。海表水温(SST)是影响鱼类栖息地的重要环境因子之一,水温上升是当前全球气候变化中的一个重要特征。为此,本研究拟通过我国近海鲐鱼灯光围网的生产统计数据,结合海洋遥感的SST因子,确定其适宜的栖息地分布范围,同时在不同SST升高情况下预测鲐鱼栖息地的变化趋势,为今后鲐鱼资源管理和栖息地分布研究提供基础。
2 材料与方法
2.1 数据
(1)渔获数据。本文的渔获生产统计数据来自中国远洋渔业协会上海海洋大学鱿钓技术组。时间为1999—2007年7—12月,数据包括作业日期、作业位置、渔区总产量(t)、放网次数,研究区域为东海25°~38°N、121°~128°E。时间分辨率是按月,空间分辨率为0.25°×0.25°表示一个渔区。
(2)海表水温数据。海表水温(SST)来源于OceanWatch网站(http://oceandata.sci.gsfc.nasa.gov/MODISA/Mapped/Monthly/4km/SST/),空间分辨率为0.05°×0.05°。由于渔获量、SST数据的空间分辨率不同,因此必须对其空间尺度进行转化并统一。利用Matlab编程软件将空间分辨率数据转化为0.25°×0.25°。
2.2 方法
(1)资源丰度计算。单位捕捞努力量的渔获量(catch per fishing effort,CPUE)通常被用来衡量渔业资源丰度[15]。分别统计每一个渔区(0.25°×0.25°)内1999—2007年7—12月渔获产量和作业次数,并计算获得单船平均月产量,即CPUE。其计算公式如下:
(1)
式中,CPUEi为渔区i的鲐鱼资源丰度(t/网次);CATCHi为渔区i的产量(单位:t);NETi为渔区i的作业次数(单位:网次)。
(2)鲐鱼栖息地分布。利用统计获得的CPUE绘制空间分布图,以此探讨其7—12月栖息地空间分布规律。
(3)鲐鱼栖息地的适宜SST分析。利用频度分析法,分析7—12月CPUE与SST的关系,获得7—12月最适的SST范围。
(4)SST升高对鲐鱼栖息地分布的影响预测。专家预测[16],预计到2100年全球表温会上升1.8~4.0℃,海平面升高幅度为18 ~59 cm,为此本文拟定4种SST升高的情况:① 每月平均SST+0.5℃;② 每月平均SST+1℃;③ 每月平均SST+2℃;④ 每月平均SST+4℃。
(5)栖息地面积计算:利用Marine explore 4.0软件中Area Calculation功能计算,分析SST引起东、黄海鲐鱼栖息地面积变化的趋势。
3 研究结果
3.1 CPUE时空分布
由图1可知,7月CPUE最低,不足15 t/网次;11月和12月的CPUE值为最高,均超过25 t/网次(图1)。7—12月栖息地有明显向北移动的趋势。7—8月主要分布在26°~28°N、122°30′~124°30′E;9—10月主要分布在33°~37°30′N、123°~124°30′E;11—12月主要分布在32°30′~34°N、124°~125°30′E(见图2)。

图2 1999—2007年东、黄海鲐鱼7—12月CPUE(t/网次)空间分布图Fig.2 Monthly spatial distribution of average CPUE of Scomber japonicus during 1999—2007
3.2 7—12月东黄海鲐鱼适宜SST分析
由图3可知,7—9月适宜SST范围与10—12月明显不同。7月份CPUE主要分布在SST为24~30℃的海域,其中高CPUE分布在SST为27~30℃的海域;8月份CPUE趋向于SST为24~30℃的海域,其中高CPUE更趋向于SST为28~29℃的海域;9月份CPUE集中在SST为20~29℃的海域,其中高CPUE主要集中在SST为25~28℃的海域;10月CPUE基本在SST为15~27℃的海域,其中高CPUE基本在SST为17~25℃的海域;11月CPUE主要分布在SST为12~23℃的海域,其中高CPUE主要分布在SST为19~21℃的海域;12月CPUE适宜SST为8~20℃的海域,其中高CPUE更适合SST为10~17℃的海域。
3.3 东、黄海鲐鱼潜在栖息地分布
以各月最适SST为依据,选择CPUE值高的8—11月份,绘制了8—11月份潜在栖息地分布图(见图4)。8月份潜在栖息地主要分布在26°~31.5°N、122.5°~128°E;9月份主要分布在26°~33°N、121°~128°E;10月份主要分布在30°~38°N、121°~128°E;11月份主要分布在27.5°~37.5°N、121°~128°E。
在SST上升0.5℃、1℃、2℃、4℃情况下,其7—12月潜在栖息地的变化情况见图5。随着SST上升,鲐鱼潜在栖息地逐渐向北移。8月份,SST上升0.5℃时,其潜在栖息地最南边界从31.5°N北移到33°N;SST上升1℃时,向北移至33.5°N;SST上升2℃时,继续向北移至36°N;SST上升4℃时,到达36.5°N附近。9月份,SST上升0.5℃时,其潜在栖息地最南边界从30.5°N北移到31.5°N;SST上升1℃时,向北移至32.5°N;SST上升2℃时,继续向北移至34.5°N;SST上升4℃时,到达36°N附近。10月份,SST上升0.5℃时,其潜在栖息地最南边界从30°N北移至30.5°N;SST上升1℃时,向北移至31°N;SST上升2℃时,继续向北移至32°N;SST上升4℃时,到达33.5°N附近;11月份,SST上升0.5℃时,其潜在栖息地最南边界从27°N北移至28°N;SST上升1℃时,向北移至29°N;SST上升2℃时,继续向北移至31°N;SST上升4℃时,到达34°N附近。
由表1可知,8—11月份东、黄海鲐鱼的栖息地面积随SST上升呈减小趋势。其中在7—12月SST上升0.5℃、1℃、2℃、4℃时,8月份栖息地面积分别减小34%、53%、67%、87%;9月份的栖息地面积分别减小15%、39%、24%、53%;10月份则分别增加4%、7%、2%和减小17%;11月份分别减小9%、0%、3%、50%。
4 讨论与分析
4.1 环境因子对东、黄海鲐鱼CPUE的时空变动影响
分析发现,1999—2007年7—9月鲐鱼较高CPUE主要集中在26°~28°N、122°~124°E海域;10—12月主要集中在33°~36°N、123°~125°E海域。
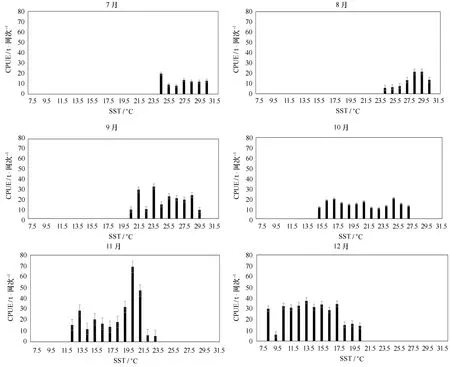
图3 1999—2007年7—12月SST与CPUE关系Fig.3 Relationship between SST and CPUE of Scomber japonicus during 1999—2007
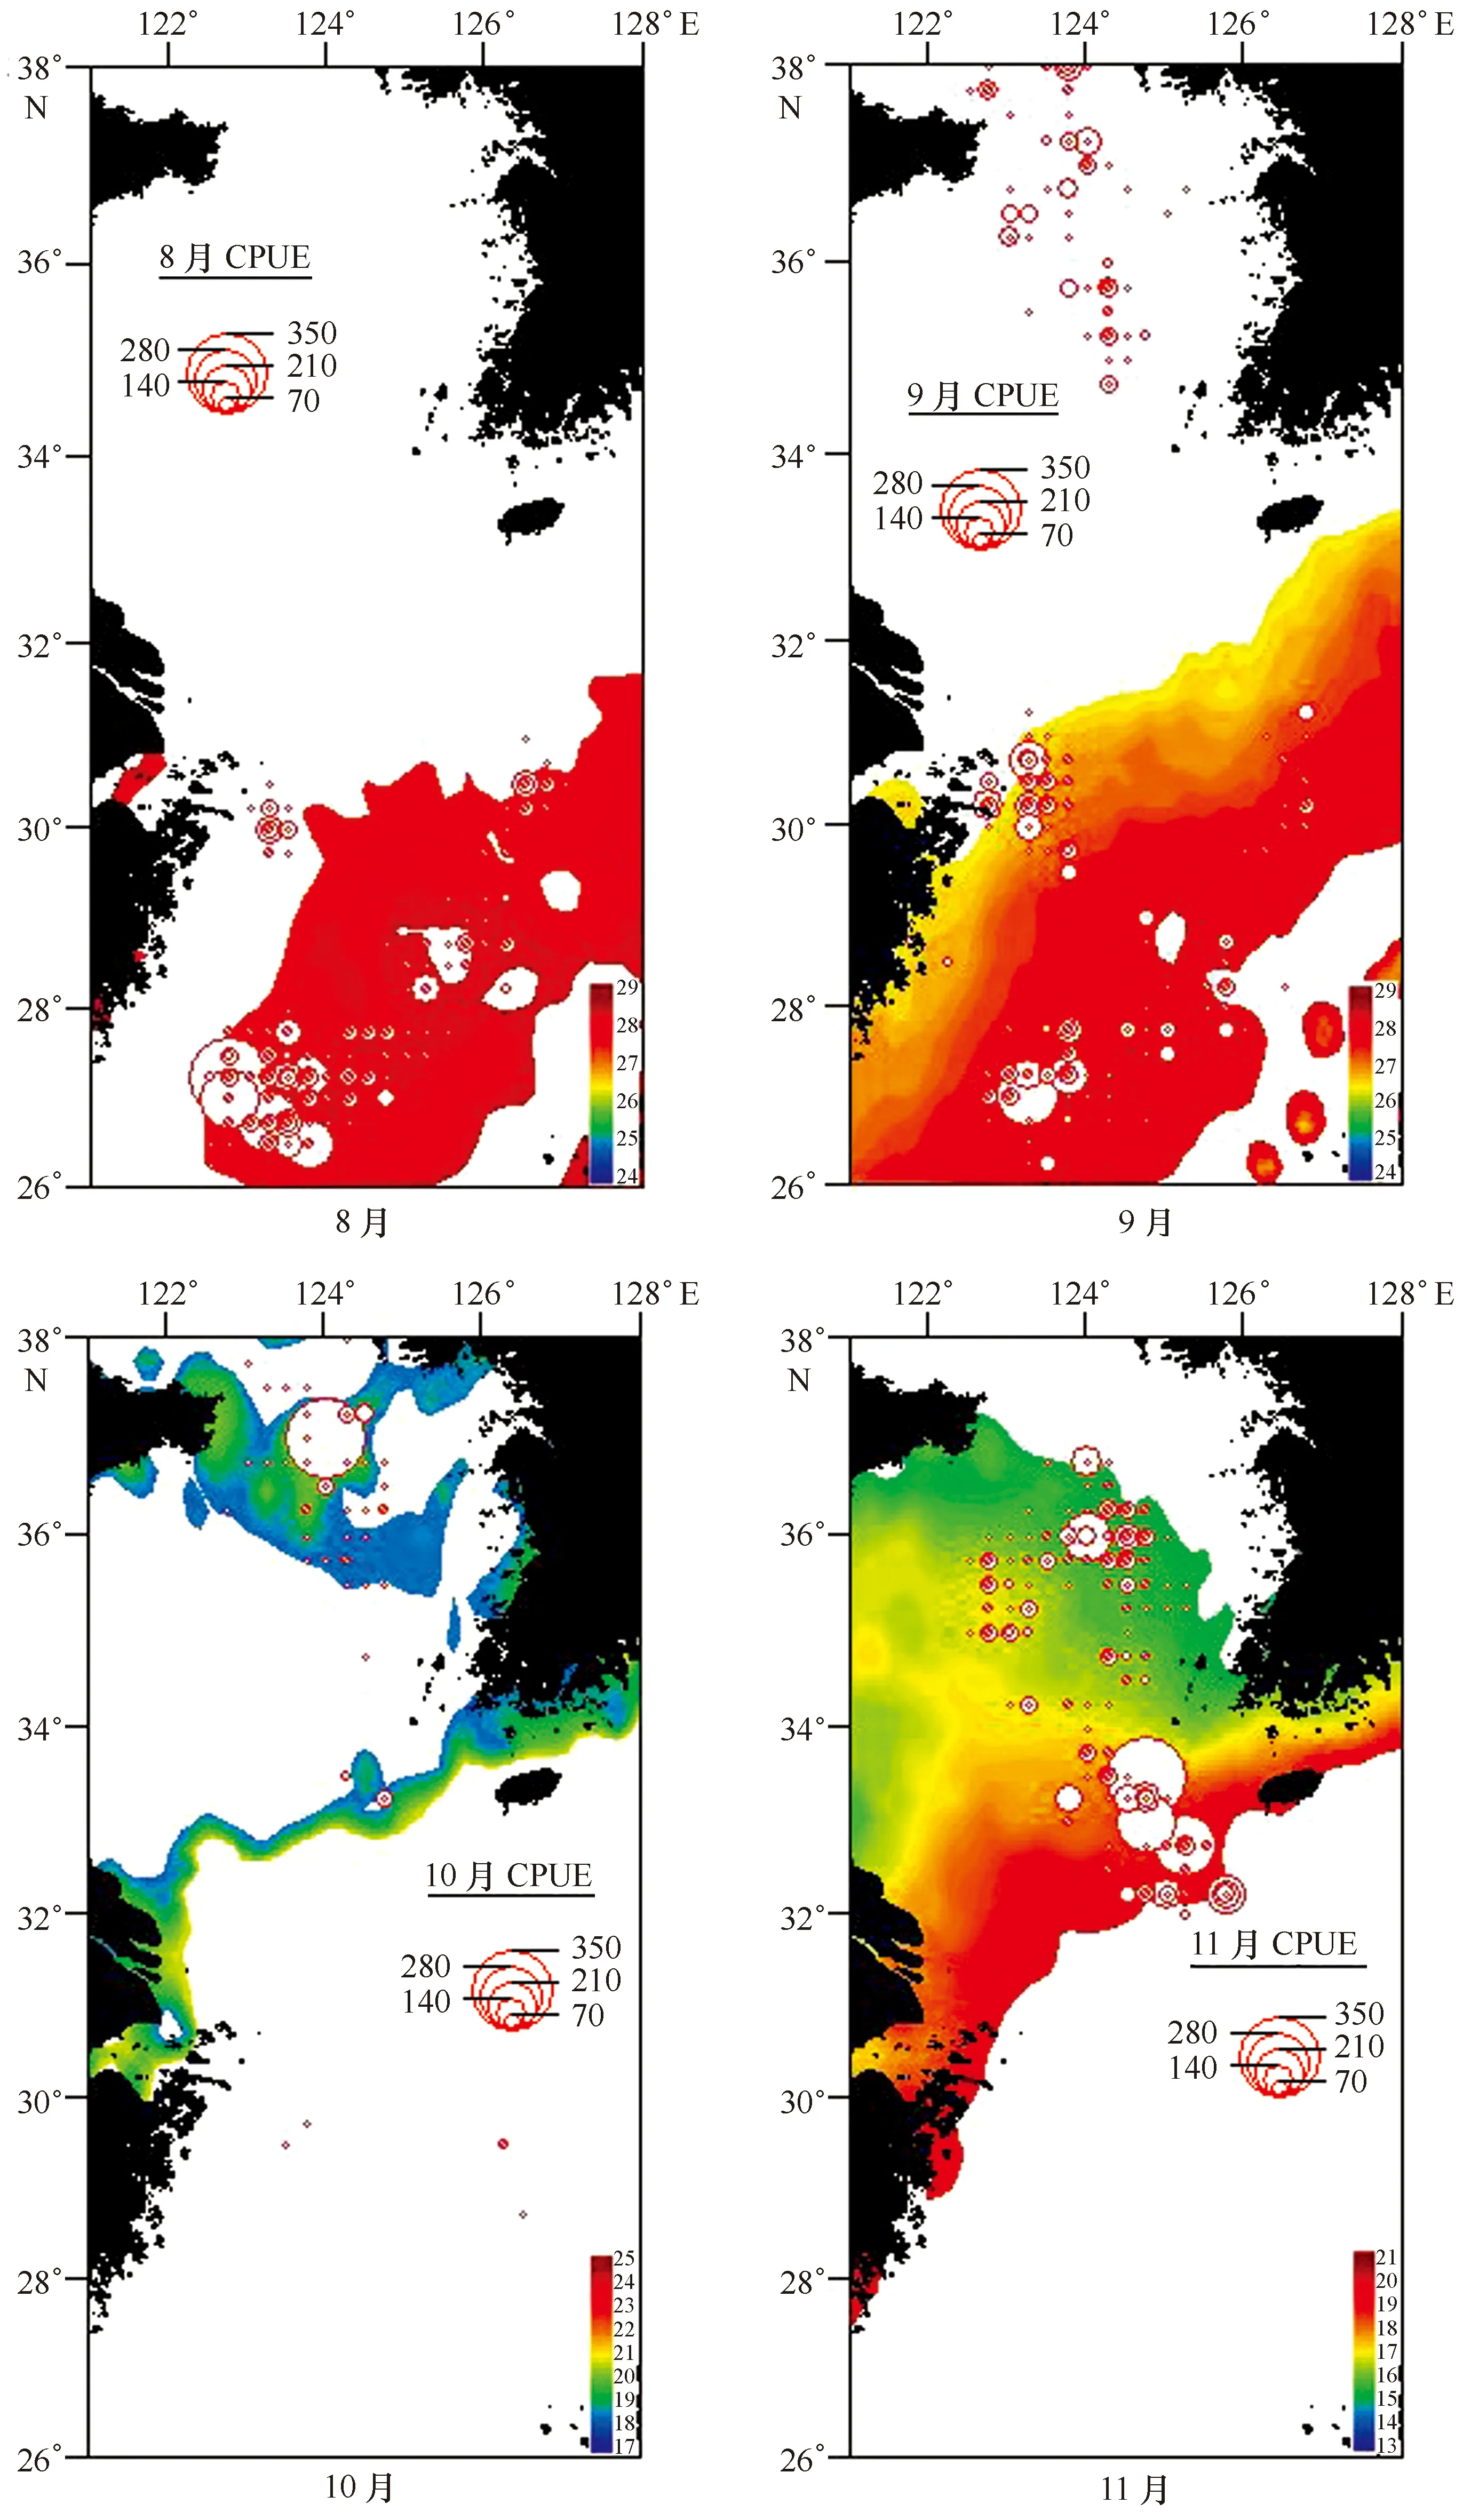
图4 8—11月鲐鱼CPUE(t/网次)与SST(℃)分布叠加图Fig.4 CPUE distribution of Scomber japonicus combined with SST

图5 SST上升0.5℃、1℃、2℃、4℃后8—11月鲐鱼潜在栖息地预测分布图Fig.5 Monthly potential habitats of the Scomber japonicus with increase of 0.5℃,1℃,2℃ and 4℃ during August to November
表1 8-11月鲐鱼潜在栖息地面积随海表水温上升的变化情况
Tab.1 Monthly area of potential habitat ofScomberjaponicusunder the increase of SST
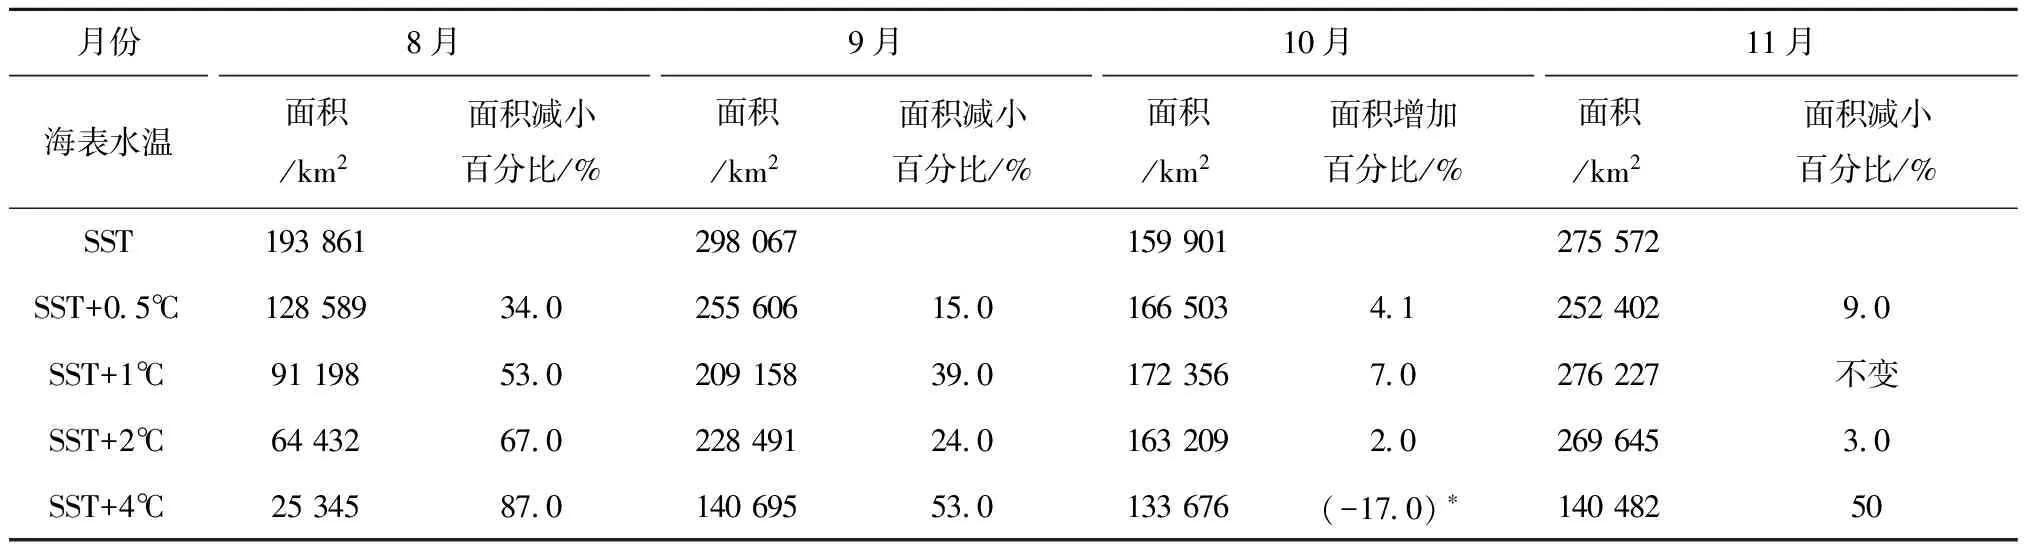
月份8月9月10月11月海表水温面积/km2面积减小百分比/%面积/km2面积减小百分比/%面积/km2面积增加百分比/%面积/km2面积减小百分比/%SST193861298067159901275572SST+0 5℃12858934 025560615 01665034 12524029 0SST+1℃9119853 020915839 01723567 0276227不变SST+2℃6443267 022849124 01632092 02696453 0SST+4℃2534587 014069553 0133676(-17 0)∗14048250
注:*表示减少百分比。
南部渔场CPUE为18.94 t/网次,北部渔场为25.19 t/网次,北部渔场的CPUE明显比南部较高。前人研究认为,东、黄海鲐鱼资源丰度会受经度、纬度、季节、海洋环境等条件影响[17—21]。崔科和陈新军[15]、宋海棠等[22]、杨红等[23]研究发现,鲐鱼渔场重心变化主要受沿岸水团和外海高盐水团的强弱变化影响。每年春季鲐鱼自东海中南部越冬场开始生殖洄游,到达东海中部,性成熟的鲐鱼即在此海域产卵,未成熟的鲐鱼则继续向北洄游进入黄海; 产卵后的鲐鱼在东海中索饵,秋季向北洄游到达黄海; 冬季返回东海的越冬场[3,24],这与本文鲐鱼渔场重心迁移方向及其栖息地分布基本一致。
4.2 海表水温对东、黄海鲐鱼潜在栖息地的影响
SST是影响许多中上层鱼类资源量的重要因素,如沙丁鱼[25—26]、竹筴鱼和鳀鱼[27]。张孝威[28]和李纲等[29]指出鲐鱼的生殖、洄游对SST变化非常敏感。研究结果表明在17~19℃和28~30℃范围内渔获量较高,最适SST范围随季节变化而变化。7、8、9月最适SST为24~30℃,10、11、12月最适SST为15~19℃。因此,本文利用最适SST来预测东、黄海鲐鱼栖息地分布(见图4),方法是可行的。
SST上升是全球气候变化的一个重要现象。本文通过模拟不同SST上升情况下来预测鲐鱼栖息地迁移及其面积变化(以最适SST作为鲐鱼栖息地分布海域)。研究表明,SST上升对鲐鱼栖息地范围影响是显著的,且不同月份的影响情况明显有差异,各月东、黄海鲐鱼栖息地面积在SST升高情况下总体呈减小趋势。因此,本研究认为SST升高将会对鲐鱼时空分布产生重要影响。但是,海洋环境变化[30—31]以及厄尔尼诺[32]都会对鱼类时空分布产生重要影响,也就是说影响鱼类时空分布的因素是很多的,为此建议以后在研究鲐鱼资源的栖息地位置时应该结合叶绿素、海流等更多的海洋环境因子[33],来预测分析其栖息地的变化。
[1] 程家骅,林龙山. 东海区鲐鱼生物学特征及其渔业现状的分析研究[J]. 海洋渔业,2004,26(2): 73-78.
Cheng Jiahua,Lin Longshan. Study on the biological characteristics and status of common mackerel (ScomberjaponicusHouttuyn) fishery in the East China Sea region[J]. Marine Fisheries,2004,26(2): 73-78.
[2] 王凯,严利平,程家骅,等. 东海鲐鱼资源合理利用的研究[J]. 海洋渔业,2007,29(4): 337-343.
Wang Kai,Yan Liping,Cheng Jiahua,et al. Study on the reasonable utilization of Chub mackerel in the East China Sea[J]. Marine Fisheries,2007,29(4): 337-343.
[3] 张洪亮,周永东,姚光展. 浙江群众传统灯光围网渔业利用资源状况分析[J]. 海洋渔业,2007,29(2): 174-178.
Zhang Hongliang,Zhou Yongdong,Yao Guangzhan. Analysis on the utilization of resources in small scale traditional light seining fisheries of Zhejiang Province[J]. Marine Fisheries,2007,29(2): 174-178.
[4] 李纲,陈新军. 东海鲐鱼资源和渔场时空分布特征的研究[J]. 中国海洋大学学报,2007,37(6): 921-926.
Li Gang,Chen Xinjun. Tempo-spatial characteristic analysis of the mackerel resource and its fishing ground in the east China Sea[J]. Periodical of Ocean University of China,2007,37(6): 921-926.
[5] 李振太,许柳雄. 东海南部鲐鱼生物学特征研究[J]. 福建水产,2005(1): 47-50.
Li Zhentai,Xu Liuxiong. Approach on biological characteristics ofscomberjaponicusin the southern east China Sea[J]. Journal of Fujian Fisheries,2005(1): 47-50.
[6] 刘勇,严利平,胡芬,等. 东海北部和黄海南部鲐鱼年龄和生长的研究[J]. 海洋渔业,2005,27(2): 133-138.
Liu Yong,Yan Liping,Hu Fen,et al. Age and growth ofPneumatophorusjaponicusin the north of the east China Sea and the south of the Yellow Sea[J]. Marine Fisheries,2005,27(2): 133-138.
[7] 孙耀,于淼,刘勇,等. 现场胃含物法测定鲐的摄食与生态转换效率[J]. 水产学报,2003,27(3): 245-250.
Sun Yao,Yu Miao,Liu Yong,et,al. Determination of food consumption and ecological conversion efficiency ofPneumatophorusjaponicusby stomach contents method[J]. Journal of Fisheries of China,2003,27(3): 245-250.
[8] Yamada T,Aokia I,Mitani I. Spawning time,spawning frequency and fecundity of Japanese chub mackerel,Scomberjaponicusin the waters around the Izu Islands,Japan[J]. Fisheries Research,1998,38(1): 83-89.
[9] 陈卫忠,李长松. 鲐鱼幼鱼耳石日轮的初步观察与研究[J]. 水产学报,1996,20(2): 139-143.
Chen Weizhong,Li Changsong. A primary observation and study on the daily increment in otolith for juvenile Japanese mackerelPneumatophorusjapunicus[J]. Journal of Fisheries of China,1996,20(2): 139-143.
[10] 方水美,杨圣云,张澄茂. 台湾海峡南部灯光围网主要捕捞对象的水温选择及其季节变化[J]. 水产学报,2000,24(4): 370-375.
Fang Shuimei,Yang Shengyun,Zhang Chengmao. Selective water temperature and its seasonal variation for main species fished by light-seine from the southern Taiwan Straits[J]. Journal of Fisheries of China,2000,24(4): 370-375.
[11] 洪华生,何发祥,杨圣云. 厄尔尼诺现象和浙江近海鲐鲹鱼渔获量变化关系——长江口ENSO渔场学问题之二[J]. 海洋湖沼通报,1997(4): 8-16.
Hong Huasheng,He Faxiang,Yang Shengyun. El-Nio phenomenon and variation of catch ofScomberjaponicasandDecapterusmaruadsitrichiurus in offshare waters of Zhejiang province[J]. Transcations of Oceanology and Limnology,1997(4): 8-16.
[12] Laurs R M,Fiedler P C,Montgomery D R. Albacore tuna catch distributions relative to environmental features observed from satellites[J]. Deep-Sea Research Part A. Oceanographic Research Papers,1984,31(9): 1085-1099.
[13] Polovina J J,Howell E,Kobayashi D R,et al. The transition zone chlorophyll front,a dynamic global feature defining migration and forage habitat for marine resources[J]. Progress in Oceanography,2001,49(1/4): 469-483.
[14] Teo S L H,Boustany A M,Block B A. Oceanographic preferences of Atlantic Bluefin tuna,Thunnusthynnus,on their Gulf of Mexico breeding grounds[J]. Marine Biology,2007,152(5): 1105-1119.
[15] 崔科,陈新军. 东、黄海围网渔场鲐鲹鱼产量的年际变动[J]. 海洋学研究,2005,23(2): 41-49.
Cui Ke,Chen Xinjun. Study on inter-annual change of the yields ofPnunmatophorusjaponicusandDecapterusmaruadsifor purse seine fishing grounds in the East China Sea and the Yellow Sea[J]. Journal of Marine Sciences,2005,23(2): 41-49.
[16] Solomon S D,Qin M,Manning Z,et al. IPCC Summary for policymakers[C]// Climate Change 2007: the Physical Science Basis. Contribution of Working Group I to the Fourth Assessment Report of the Intergovernmental Panel on Climate Change. Cambridge: Cambridge University Press,2007.
[17] Yatsuia A,Mitana T,Watanabe C,et al. Current stock status and management of chub mackerel,Scomberjaponicus,along the Pacific coast of Japan——an example of allowable biological catch determination[J]. Fisheries Science,2002,68: 93-96.
[18] Hiyama Y,Yoda M,Ohshimo S. Stock size fluctuations in Chub mackerel (Scomberjaponicus) in the East China Sea and the Japan/East Sea[J]. Fisheries Oceanography,2002,11(6): 347-353.
[19] Yatsu A,Watanabe T,Ishida M,et al. Environmental effects on recruitment and productivity of Japanese sardineSardinopsmelanostictusand chub mackerelScomberjaponicuswith recommendations for management[J]. Fisheries Oceanography,2005,14(4): 263-278.
[20] 由上龍嗣,檜山義明,依田真里,等. 平成 16 年マサバ对馬暖流系群の資源評価[R]. 西海区水產研究所,2005.
Yugami R, Hiyama Y, Yoda M, et al. Resources analysis of common mackerelScomberjaponicus, Tsushima Warm Current stock in 2004[R].Seikai Regional Fisheries Research Lab,2005
[21] 由上龍嗣,檜山義明,依田真里,等. 平成 17 年マサバ对馬暖流系群の資源評価[R]. 西海区水產研究所,2006.
Yugami R, Hiyama Y, Yoda M, et al. Resources analysis of common mackerelScomberjaponicus, Tsushima Warm Current stock in 2005[R].Seikai Regional Fisheries Research Lab,2006
[22] 宋海棠,陈阿毛,丁天明,等. 浙江渔场鲐鲹鱼资源利用研究[J]. 浙江水产学院学报,1995,14(1): 2-12.
Song Haitang,Chen Amao,Ding Tianming,et al. A stock utilization survey of mackerel and scad in Zhejiang fishing area[J]. Journal of Zhenjiang College of Fisheries,1995,14(1): 2-12.
[23] 杨红,章守宇,戴小杰,等. 夏季东海水团变动特征及对鲐鲹渔场的影响[J]. 水产学报,2001,25(3): 209-214.
Yang Hong,Zhang Shouyu,Dai Xiaojie,et al. Characteristics of water masses and its influence on mackerel scad fishery in the East China Sea in the summer[J]. Journal of Fisheries of China,2001,25(3): 209-214.
[24] Hwang S D. Population ecology of pacific mackerel,Scomberjaponicus,off Korea[D]. Daejeon: Chungnam National University,1999.
[25] Park J H,Choi K H. A study on the formation of fishing ground and the prediction of the fishing conditions of mackerel,ScomberjaponicusHouttuyn[J]. Bull Natl Fish Res Dev Agency Korea,1995,49: 25-35.
[26] Jacobson L D,MacCall A D. Stock-recruitment models for Pacific sardine (Sardinopssagax)[J]. Canadian Journal of Fisheries and Aquatic Sciences,1995,52(3): 566-577.
[28] 张孝威. 鲐鱼[M]. 北京: 农业出版社,1983.
Zhang Xiaowei. Mackerel[M]. Beijing: China Agriculture Press,1983.
[29] 李纲,陈新军,田思泉. 我国东、黄海鲐鱼灯光围网渔业CPUE标准化研究[J]. 水产学报,2009,33(6): 1050-1059.
Li Gang,Chen Xinjun,Tian Siquan. CPUE standardization of chub mackerel (Scomberjaponicus) for Chinese large lighting-purse seine fishery in the East China Sea and Yellow Sea[J]. Journal of Fisheries of China,2009,33(6): 1050-1059.
[30] 曹晓怡,周为峰,樊伟,等. 印度洋大眼金枪鱼、黄鳍金枪鱼延绳钓渔场重心变化分析[J]. 上海海洋大学学报,2009,18(4): 466-471.
Cao Xiaoyi,Zhou Weifeng,Fan Wei,et al. Analysis on barycenter of fishing ground for bigeye tuna and yellowfin tuna by lonelining in the Indian Ocean[J]. Journal of Shanghai Ocean University,2009,18(4): 466-471.
[31] 曹杰,陈新军,刘必林,等. 鱿鱼类资源量变化与海洋环境关系的研究进展[J]. 上海海洋大学学报,2010,19(2): 232-239.
Cao Jie,Chen Xinjun,Liu Bilin,et al. Review on the relationship between stock recruitment of squid and oceanographic environment[J]. Journal of Shanghai Ocean University,2010,19(2): 232-239.
[32] 陈敏祥. 聖嬰現象對台灣鯖圍網漁業影響評估[D]. 基隆: 国立台湾海洋大学,2000.
Chen Minxiang. Impact assessment of the El Nio on the Mackerel Purse Seine Fishery in Taiwan[D]. Jilong: National Taiwan Ocean University,2000.
[33] 陈新军. 渔业资源与渔场学[M]. 北京: 海洋出版社,2004: 202-203,252-253.
Chen Xinjun.Fisheries resources and fishery science[M]. Beijing: China Ocean Press,2004:202-203,252-253.
Influence of sea surface temperature changes onScomberjaponicashabitat in the Yellow Sea and East China Sea
Su Hang1,4,Chen Xinjun1,2,3,4,Wang Jintao1,2,3,4
(1.CollegeofMarineSciences,ShanghaiOceanUniversity,Shanghai201306,China; 2.NationalEngineeringResearchCenterforOceanicFisheries,ShanghaiOceanUniversity,Shanghai201306,China; 3.TheKeyLaboratoryofSustainableExploitationofOceanicFisheriesResources,MinistryofEducation,ShanghaiOceanUniversity,Shanghai201306,China; 4.CollaborativeInnovationCenterforDistant-waterFisheries,Shanghai201306,China)
Sea surface temperature (SST) is an important indicator representing fish habitat. According toScomberjaponicusfishery-dependent data of large lighting-purse seine,combining with SST by remote sensing,the suitable range of SST ofScomberjaponicasduring the fishing seasons are analyzed and the changing tendency of theScomberjaponicashabitat caused by variation of water temperature are also discussed. The results proved that suitable range of SST ofScomberjaponicasin the East China Sea and Yellow Sea is 15-30℃. This study based on global climate simulations under several emission scenarios (A1FI,A1B,A1T,A2,B1,and B2) from the AR4 of the IPCC to examine the impact on potential habitats ofScomberjaponicasfor the next 100 years. So we simulate four kinds of water temperatures rise by gradient : (1) monthly average SST increase of 0.5℃;(2) monthly average SST increase of 1℃; (3) monthly average SST increase of 2℃;(4) monthly average SST increase of 4℃. The results indicated that the habitat ofScomberjaponicashad a obvious northwards shifting tendency,and the area of habitat would decreased gradually. It is concluded that the rising SST caused by the global climate change would have a seriously effect on the habitat ofScomberjaponicas. These results can make us understand the spatial distribution ofScomberjaponicasinfluenced by SST in fishery management and fishery forecasting,which also provide the guide for the prediction of theScomberjaponicuspotential habitat in the East China Sea and Yellow Sea.
Scomberjaponicas; climatic change; SST increase; potential habitat
10.3969/j.issn.0253-4193.2015.06.009
2014-09-19;
2015-03-14。
国家863计划(2012AA092303);国家发改委产业化专项(2159999);上海市研究生教育创新计划;上海市科技创新行动计划(12231203900);国家科技支撑计划(2013BAD13B01)。
苏杭(1992—),男,河南省商丘市人,主要从事渔业资源学研究。E-mail:615923118@qq.com
*通信作者:陈新军(1967—),男,教授。E-mail:xjchen@shou.edu.cn
S931.1
A
0253-4193(2015)06-0088-09
苏杭,陈新军,汪金涛. 海表水温变动对东、黄海鲐鱼栖息地分布的影响[J].海洋学报,2015,37(6):88—96,
Su Hang,Chen Xinjun,Wang Jintao. Influence of sea surface temperature changes onScomberjaponicashabitat in the Yellow Sea and East China Sea[J]. Haiyang Xuebao,2015,37(6):88—96,doi:10.3969/j.issn.0253-4193.2015.06.009
猜你喜欢
中国水产(2021年12期)2021-12-06 11:14:00
大自然探索(2021年12期)2021-02-07 01:37:04
海洋信息技术与应用(2020年2期)2020-07-27 01:42:02
热带海洋学报(2020年3期)2020-05-25 04:51:30
海洋通报(2020年6期)2020-03-19 02:10:08
成都信息工程大学学报(2019年5期)2019-05-21 00:46:28
当代水产(2019年4期)2019-05-16 03:04:20
汽车观察(2018年12期)2018-12-26 01:05:44
Journal of Oceanology and Limnology(2018年3期)2018-07-11 01:58:38
知识经济·中国直销(2017年11期)2017-11-28 05:32:34