Using Monte Carlo Simulation Technology to Improve Intuitive Effect of Teaching Probability and Mathematical Statistics Course
万文应 夏 庆
WAN Wenying, XIA Qing
(Basic Course Department of Military Economics Academy of CPLA, Wuhan, Hubei, 430035)
Abstract With the illustration of a specific problem, this paper demonstrates that using Monte Carlo Simulation technology will improve intuitive effect of teaching Probability and Mathematical Statistics course, and save instructors effort as well. And it is estimated that Monte Carlo Simulation technology will be one of the major teaching methods for Probability and Mathematical Statistics course in the future.
Key words Monte Carlo Simulation; intuitive; Probability and Mathematical Statistics
中图分类号:G424 文献标识码:A DOI:10.16400/j.cnki.kjdks.2015.02.045

I Preface
Probability and Mathematical Statistics is a discipline which studies the statistical rules of large amount of random phenomena. This discipline has a wide application in practice, ranging from natural science, engineering technology, social science, agriculture and industry production, medicine, geology, space technology, weather and disaster forecast to military.
However, most students think it is difficult to learn this discipline. They think definitions are too abstract to understand and they have difficulty in mastering the way of learning. Aiming at this phenomenon, the writer of this paper holds the following thought based on years teaching experience: the course, Probability and Mathematical Statistics, is different from the courses students learned previously, such as, Advanced Mathematics and Linear Algebra. Compared with that of Probability and Mathematical Statistics, the research objects of Advanced Mathematics and Linear Algebra are all more specific and clearer. For example, the main content of Advanced Mathematics is getting derivative or integral of specific functions; and for Linear Algebra, it is getting the solution of linear equations group. But Probability and Mathematical Statistics is the mathematics which studies chances. Its research objects are abstract and unspecific chances of random occurrence. And calculating such kind of chances is the main content of this course. If instructors could enhance the intuitive effect of Probability and Mathematical Statistics course in teaching, then students will find it is not so difficult to learn this course, and thus arouse their interest to study this course and improve learning efficiency.
Monte Carlo Simulation method originated in 18th century, when Pufeng decided circumferential rate,, by the method of randomly throwing needles. With the emergence and rapid development of modern computer technology, Monte Carlo Simulation method evolves into a method which uses computers to simulate probability process, and statistic the calculation results, and thus get the approximate solution of the problem.

Monte Carlo method is a method which is based on probability model. Following the process described by this model, it conducts a kind of digital simulation experiment by using mathematical means, and then has the experiment result as the approximate solution of the problem. If the problem is about the probability of occurring a certain event or the expectation value of a random variable, then the occurrence frequency of this event or the mathematical mean value of this random variables sample testing value could be obtained through a certain experimental method. They are then regarded as the approximate solution of the problem. This is the basic thought of Monte Carlo method.
Using Monte Carlo simulation technology in teaching Probability and Mathematical Statistics course could enhance students visual comprehension of conclusions and eliminate obstacles they met in study.
II Introduction of the features of Matlab software
If we want to adopt Monte Carlo simulation technology, we must use one type of programming language. At present, there are three computer mathematical languages which have the greatest influence worldwide. They are: MATLAB of Mathworks Company, Mathematica Language of Wolfram Research Company, and Maple Language of Waterloo Maple Company. The writer chooses MATLAB Language as the programming language, because the statistical toolbox of MATLAB has a powerful function, which covers almost every aspect of probability statistics. Concerning several issues that MATLAB hasnt taken into consideration, users could program M file themselves.
To scientific researchers, the MATLAB is a preferred computer mathematical language designed by Mathworks Company. It is also a language most suitable for many science and engineering disciplines. Matlab is a high-powered programming software which is used in engineering calculation. It gathers scientific calculation, visualization of results and programming in a very conveniently used environment. The basic data structure of Matlab is matrix, whose expression is quite similar to equations used in mathematical engineering calculation. It is very convenient and easy to learn. It includes five parts: MATLAB language, MATLAB operation environment, MATLAB image processing system, MATLAB mathematical function base and MATLAB application program interface. The main functions of MATLAB are: data and symbol calculation, data analysis and visualization, word processing, Simulink dynamic emulation, etc. Matlab is wildly used as a special-purpose scientific computer language in other countries high-learning academies, and relevant courses have been established as well. It is now regarded as one essential skill for undergraduates, graduates and instructors.
III Examples of application
Lets have exercise 24 on Page 115 from the textbook, Probability and Mathematical Statistics (second edition, edited by Liu Zhengxin) as an example to demonstrate that Monte Carlo simulation technology could improve intuitive effect of teaching. The exercise is as following:
Suppose are independent with each other, their density functions are as following
Try to get the probability density of the random variable = 2 + .
The Matlab codes are as following:
lam=1;n=100000;u=zeros(1,n);v=zeros(1,n);z=zeros(1,n);
for i=1:n
u(i)=2*rand; v(i)=-log(rand)/lam; z(i)=u(i)+v(i);
end
[N,h]=hist(z,100);N=N/(h(2)-h(1))/n;bar(h,N,1,'w');holdon;
x=0:0.01:2;y=0.5.*(1.-exp(-x));
plot(x,y);hold on;
x=2:0.01:10;y=0.5.*(exp(2)-1).*exp(-x);hold on;plot(x,y);
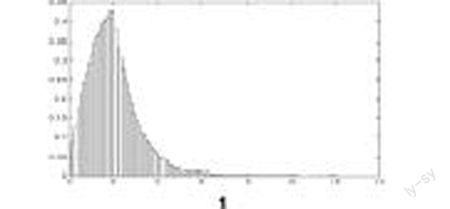
The first step: illustrate the process of how to create even distribution and index distribution, then use Matlab to create experimental curve.
1
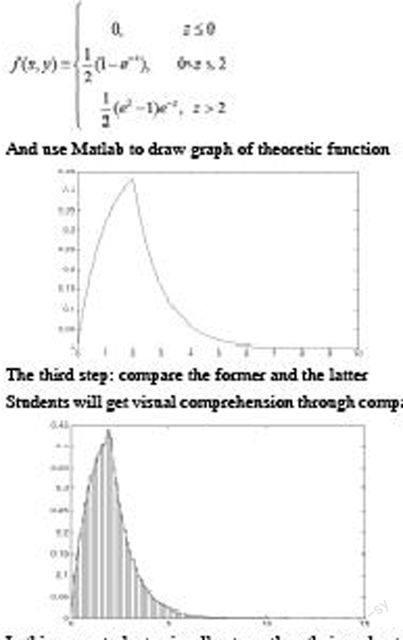
The second step: deduce the solution to the exercise from theories:
Since are random variables which are independent with each other, then the probability density of () is:
First get the distribution function of = 2 + ,() = {≤} = {2 + ≤} = (),
Then get the derivative of this distribution function, and we get:
And use Matlab to draw graph of theoretic function
The third step: compare the former and the latter
Students will get visual comprehension through comparison.
In this way, students visually strengthen their understanding of the definition, probability density. And this teaching method eliminates obstacles students met in study.
IV Conclusion
This is not all the application of Monte Carlo simulation technology in teaching Probability and Mathematical Statistics course. There are still lots of other wonderful examples. It could be said that almost the majority of examples and exercises from Probability and Mathematical Statistics course could be solved by using Monte Carlo simulation technology, and this technology could be used in instruction. We anticipate that Monte Carlo Simulation technology will be one of the major teaching methods for Probability and Mathematical Statistics course in the future.
References
[1] Liu Zhengxin, Yao Nan, Probability and Mathematical Statistics (second edition) [M]. Hubei Science and Technology Publishing House,2005.
[2] Xia Chuanwu, Examplification of MATLAB Application in Probability Statistics Teaching [J], Weifang Educational Academy Journal, 2007,Vol 4.
[3] Jiang Haifeng, On the Application of MCS in Probability and Mathematical Statistics Teaching [J], Mathematical Statistics and Management,2008,Vol 4.
[4] Wu Chuansheng, Economic Mathematics----Probability and Mathematical Statistics (second edition) [M]. Beijing, High-learning Education Publishing House,2009.

