
Visualization study on fluid distribution and end effects in core flow experiments with low-field mri method*
2015-04-20 05:52CHENGYichong程毅翀DIQinfeng狄勤丰GUChunyuan顾春元YEFeng叶峰HUAShuai华帅YANGPeiqiang杨培强
水动力学研究与进展 B辑 2015年2期
CHENG Yi-chong (程毅翀), DI Qin-feng (狄勤丰), GU Chun-yuan (顾春元), YE Feng (叶峰),HUA Shuai (华帅), YANG Pei-qiang (杨培强)
1. Shanghai Institute of Applied Mathematics and Mechanics, Shanghai University, Shanghai 200072, China,E-mail: 13816904775@126.com 2. Shanghai Key Laboratory of Mechanics in Energy Engineering, Shanghai University, Shanghai 200072, China 3. Shanghai Niumag Corporation, Shanghai 200061, China
Introduction
Core flow experiment is a principal way to study the micro flows in non-transparent rock media, and mainly used to examine the two-phase flow condition and the mechanism of chemical additive displacement.The experimental results for displacements are mainly described by macro parameters such as the flow rate,pressure difference and permeability[1], but the fluid distribution characteristics can only be indirectly and approximately determined by numerical simulation.As a result, the real condition of fluid distribution can not be given with the experiment. This situation needs to be improved for studying the displacement effect and exploring new displacement technology. In addition, the influence of parameters during the test can not be evaluated.
Moreover, in the core flow experiment, there exists a very common problem, i.e., the end effect, which may affect the experiment data, e.g., pressure, permeability, and misdirect the assessment of the results[2]. Flow condition from tube flow to seepage and blocking are deemed to be two primary causes of the end effect, and have occurred in some unsuccessful experiments, in which displacement pressure and permeability are abnormal compared to the results in the experiments of same type. Because there is no effective method to detect the local fluid distribution in the core, the influence of the end effect on experimentalresults can not be effectively determined[3,4].
Rock is non-transparent, so the inner condition can not be visually observed with optical instrument.Plane displacement model is a common method to image the fluid distribution, but it is a two-dimensional model instead of a real core. As is known to all, in the process of simplification, a lot of characteristics have been ignored. So a new, lossless and visual method should be developed to detect the fluid distribution and find the features of the end effect.
In order to get the fluid distribution data in core,a lot of visualization methods like microwave imaging,CT, NMR-T2distribution have been developed[5], but no effective data about the fluid distribution have been got with these methods. This paper reports our work on detecting the fluid distribution by using an improved low-field nuclear magnetic resonance imaging(MRI) device. In the following, some visualization tools that can detect the inner condition of core flow are listed and compared first. Then an experiment equipment developed by the authors to suit for MRI equipment is presented and a method is studied to achieve a high-quality real-time imaging during the displacement, which can reflect the fluid distribution and flow features in the core. Finally, through analyzing the MRI images of nature and artificial cores, the oil and water distributions can be clearly and visually displayed. The results show that the distributions of oil and water can be visually detected, and the existence of end effect and its influencing area can be visually verified by the MRI device.
1. Visualization tools in core flow experiments
Conventional core flow experiments aim to evaluate the effect of various kinds of displacing agentsʼ and only some macroscopic parameters such as the inlet and outlet pressures, rate of flow, resistivity, porosity and permeability can be determined. Actually this method can only get the data before and after the complex flowing, thus the above-mentioned parameters are all the indirect characterization of flow condition in core, and the flow state and distribution of fluid are unknown. In addition, sundry displacing effects of agents can not be visually evaluated due to the opaque property and microscopic pore structure characteristics of the core. In order to get the fluid distribution data in core, a lot of visualization methods like microwave imaging, CT, NMR-T2distribution have been developed, but the quality of these methods has to be improved. In 2004, Yi et al.[6]used CT to measure a core from an oil filed in China, and proved that CT is a feasible method for imaging the core structure. CT can also be used to observe the crack in a low-permeability core[7]. In 2004, a digital core laboratory was established in Australian National University[8], in which the researchers used their own CT system to research porous media imaging. The CT field of view(FOV) is 0.055×0.055 m2, and the resolution ratio is about 2 μm. They scanned the four different cores and rebuilt 2-D cross-sections images. But unfortunately,until now, a most advanced CT system cannot be used to visually observe the fluid characteristics in the cores because it can not distinguish the fluid from the skeleton of core.
NMR-T2distribution is another way to study the internal characteristics of a core, but only macroscopic parameters such as porosity, permeability and oil and water content can be measured[9,10]. The internal distribution of flow can not be observed with this method.
In recent years, the magnetic resonance imaging(MRI) has been found its wide application in oilfields.It has been mainly applied to the well logging technology and the reservoir assessment, and has achieved some good results. A study by Wang[11]got static image of fluid distribution in core by using MRI. Lang et al.[12]obtained the slice imaging of core, and the crack image was observed. Liu et al.[13]obtained the slice images of glass sand filling tube through highfield magnetic resonance equipment, and then rebuilt a three-dimensional image by using these slice images data.
MRI equipment can be classified into two kinds by its field intensity: low-field and high-field ones.The high-field MRI has been widely used in medical imaging for its high resolution. But for the core analysis, lots of experiments failed to get the images of the fluid in core[11]because natural core contains iron ions more or less. Iron ions destroy the homogeneity of magnetic field and high-field MRI is very sensitive to the iron ion[14]. This phenomenon made the high-field MRI can not be used to image the selected nature cores which contains even if only a few iron ions. At the same time, low-filed MRI has been widely used in well logging for its anti-jamming capability[15]. But until now, the low-field MRI equipment was mainly used to analyzeT2distribution.
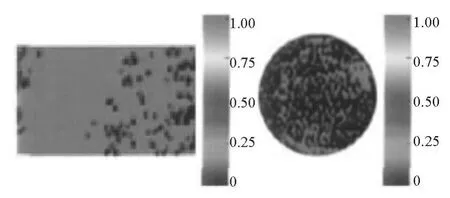
Fig.1 Water distribution in core[14]
In 2012, an MRI equipment was used in the Key Laboratory of CO2Utilization and Reduction Technology at Tsinghua University[16]. In the equipment, theCO2migration mechanism (Fig.1) in glass sand filling tube was used, and the thickness of the MRI images was 0.016 m while the diameter of the sand-filled pipe was 0.025 m. It is regrettable that the short relaxation signals which contain the information of fluid distribution in micro channels with very small diameter can not be got in their experiment.
Though some important work has been conducted in the visualization of fluid distribution in a glass sand filling tube with MRI equipment, but there are two defects in Ref.[16]. First of all, the micro channel structure of glass sand filling tube is different from a natural core, and the fluid distribution in it can not be considered similar with a natural core. Secondly, the magnetic resonance equipment is easy to be disturbed by iron content in natural cores, so no real fluid distribution in natural core has been got in their experiments.
In these two years, some breakthrough occurred in core MRI technology, and a modified displacement system with MRI equipment was developed and some high-quality fluid distribution imaging results have been obtained in our laboratory. So before describing the results, the experiment system and the information needed to get a high-quality imaging result will be described in this paper.
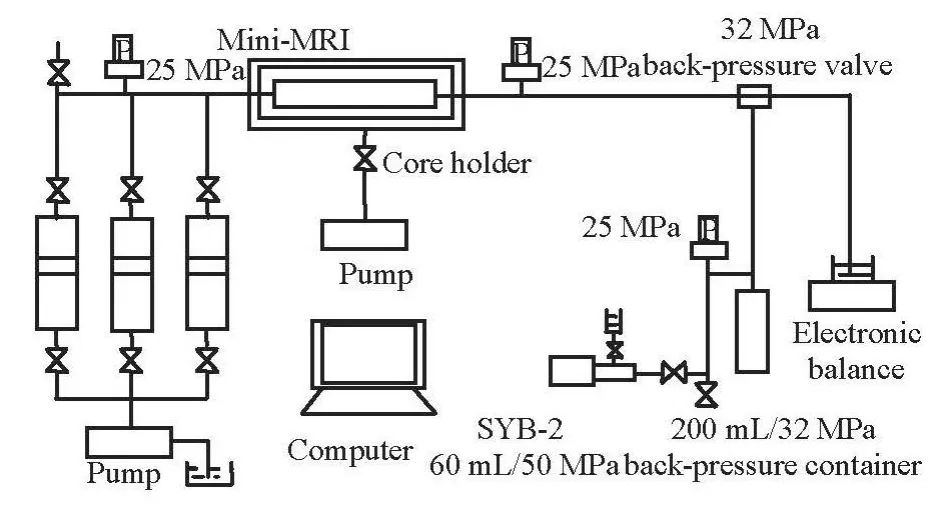
Fig.2 Schematic of set-up for examining core flow
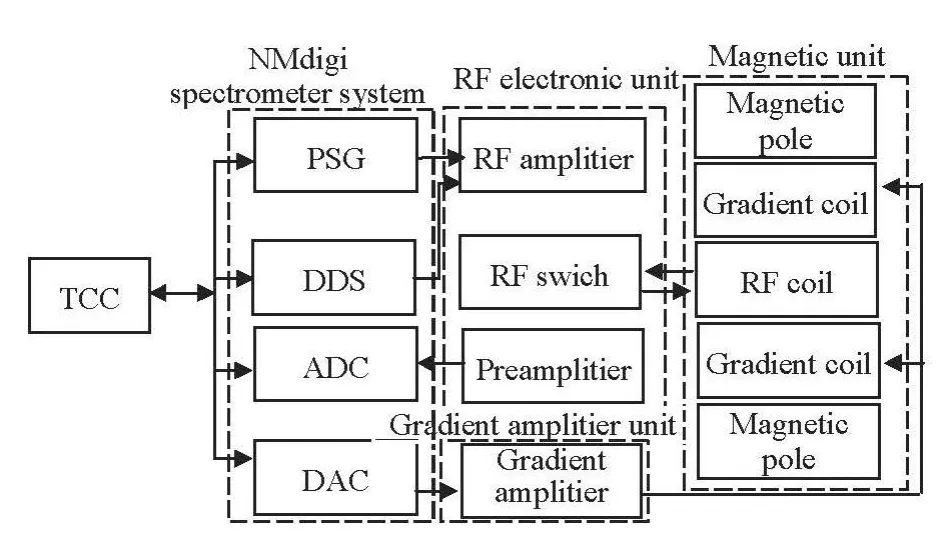
Fig.3 Framework of MINI-MRI
2. Set-up and media in experiments
2.1 The displacement system with MRI equipment
The nuclear magnetic resonance system in our laboratory includes a computer, a MINI-MRI device, a core holding unit, a pressure gage, an electronic balance unit and a displacement pump as shown in Fig.2.Diesel and water with relaxation agent are placed in two fluid containers. The system can record the inlet/outlet pressure and the fluid flow rate during the process of displacing to help evaluate the flow condition.
In this nuclear magnetic resonance system, the low-field MINI-MRI is a key equipment, and its framework is given in Fig.3. The framework and introduction about the low-field MINI-MRI may be referred to the user manual provided by the Niumag Corporation[17]. According to the functions, MINI-MRI consists of five parts: an industrial control computer (ICC)with an NM digit spectrometer system, an RF electronic unit (RFEU), a gradient amplifier unit (GAU), a magnet unit (MU) and a power supply unit (PSU).The ICC is the brain of the machine. It receives instructions from users and controls other units to execute tasks. Also it completes other tasks such as data processing, image rebuilding, etc.. The RFEU transmits RF signals and receives NMR signals both by RF coils.The GAU supplies gradient magnetic field, and the MU generates homogeneous magnetic field. The characteristic magnetic field strength is 0.5 Tesla, the range of resonance frequency is 21 MHz-23 MHz, the magnetic pole diameter is 0.11 m, the distance between two magnetic poles is 0.374 m, the magnetic field uniformity is 40 ppm (part per million) and the imaging region is 0.025 m×0.025 m×0.025 m.
Besides the low-field MINI-MRI, there are some other parts different from conventional flow experiments owing to the particularity of MRI experiment.In order to avoid interference in the process of collecting signal, the fluorocarbon oil is used as confining pressure liquid instead of water, and the core holder is made of polymer to shield disturbing signals. Moreover, its two ends are covered with copper mesh.
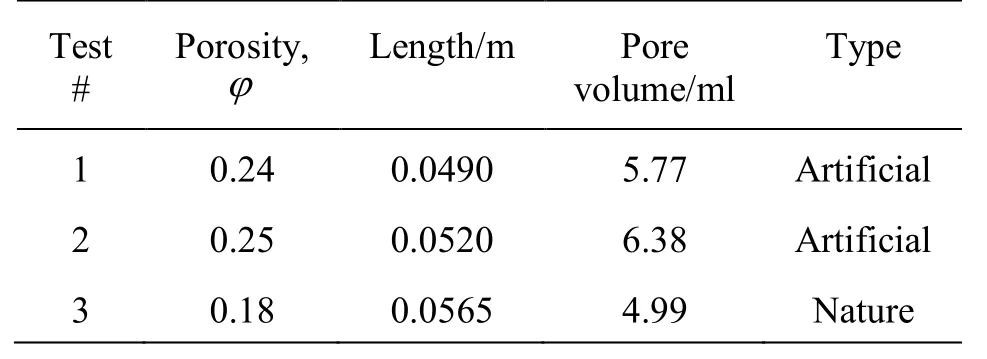
Table 1 The properties of rock samples
2.2 Media
2.2.1 Core samples
In our experiments, a natural core with the porosity of 0.18 and two artificial cores with the porosity of 0.25 and 0.24 respectively were selected. First, the artificial cores were used to verify the validity of the MRI method and the blocking location because white is the color that could pick out other substances on (in)it while the natural core was used to observe the fluid distribution in non-homogeneous porous medium.Their detailed properties are listed in Table 1. The main ingredient of three cores was sandstone, and their tested pore volumes were 5.77 ml, 6.38 ml and 4.99 ml respectively. Similarly to a standard displacement test, the natural core sample (#3) was 0.0254 m in diameter and 0.0565 m in length, the artificial cores sample were both 0.0254 m in diameter, 0.049 m and 0.052 m respectively in length.
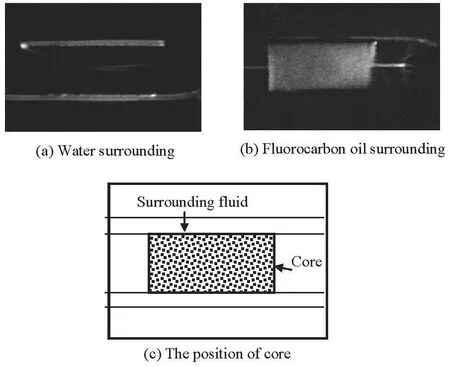
Fig.4 Comparison of water and fluorocabon oil as confining pressure liquid
2.2.2 Confining pressure liquid
As was mentioned above, in order to avoid interference in collecting signals, the fluorocarbon oil was used as confining pressure liquid instead of water.The interference resulted from water can be clearly seen in Fig.4. The images of the artificial core with water (Fig.4(a)) and fluorocarbon oil (Fig.4(b)) under the same field of view and NMR sequence were respectively captured. Figure 4(c) shows the position of core and surrounding fluid. In Fig.3(a), the signal of water is too bright while the core image of core is relatively dark, so one can not see the feature of the core sample by eyes. When the water was replaced by fluorocarbon oil as confining pressure liquid, the shape of core sample could be clearly seen (Fig.4(b)).
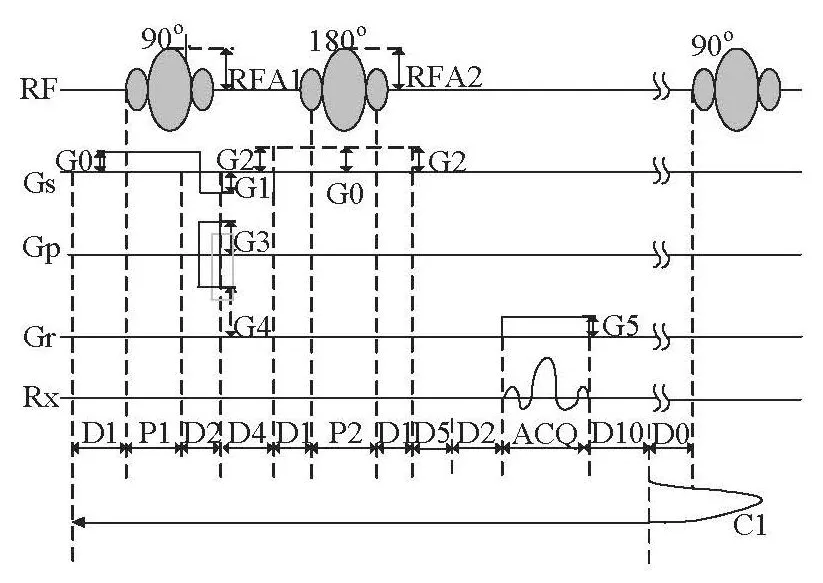
Fig.5 Multi-slice spin echo sequence[17]
2.3 MRI parameters
When a o 90 RF pulse was applied on the nucleus system and ao180 RF pulse after timeτ, an echo, the spin echo (SE), will appear. The impulse sequence in this experiment is multi-slice spin echo (MSE), which is a fundamental and common sequence and it not only has basic function like SE but also can image multiple lays. Its time sequence is shown in Fig.5 and the images in Fig.4 are obtained by reconstructing the signals from the MSE.
In the MSE imaging theory, the signal intensity can be described as
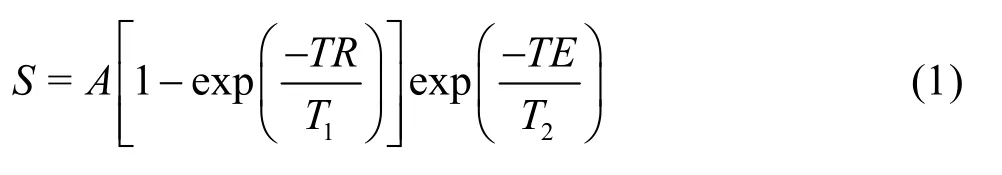
whereSis the signal intensity,Athe proton density,TRthe repetition time,T1the longitudinal relaxation time, TE the echo time, andT2the transverse relaxation time. In the MSE sequence,TRis the duration between the middles of the two o 90 pulses, andTEis the duration between the middle of theo90 pulse and echo peak. Through the experimental study, we find that shorterTEis more suitable for the imaging in core. Because surface relaxation is the main effect to the core, a shorterTEcan collect more signals of residual oil.
The image system developed by the authors was used for image reconstruction, image processing and image display.
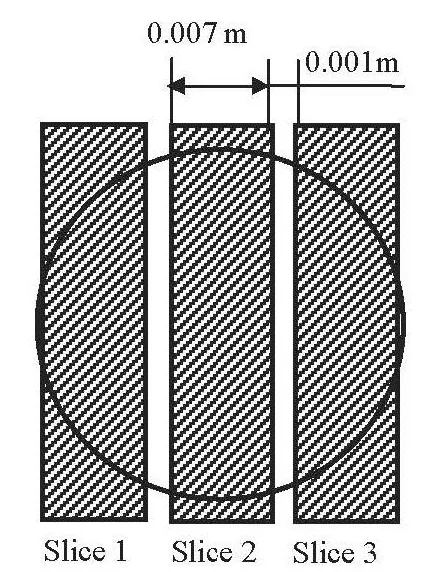
Fig.6 Image position
3. Experiments and results
3.1 Artificial core displacement one (test #1)
As a preparation step, the core sample was vacuumized for 48 h and saturated with diesel oil firstly and then displaced by 0.5% of manganese chloride solution till no oil flowed out of the outlet of core. When 0.5% of manganese chloride solution was displacedinto the microchannel of core at the speed of 0.1 ml/min, a flooding process of oil by water was simulated. The two-dimensional images werein-situdisplayed by the MRI software to monitor the displacement process. At the same time, the displaced oil quantity was also recorded by measuring cylinder.This traditional method can be used to examine the oil saturation of the core during the displacement.
In this experiment, the thickness of the MRI image was 0.007 m, while the space between two slice was 0.001 m (Fig.6).
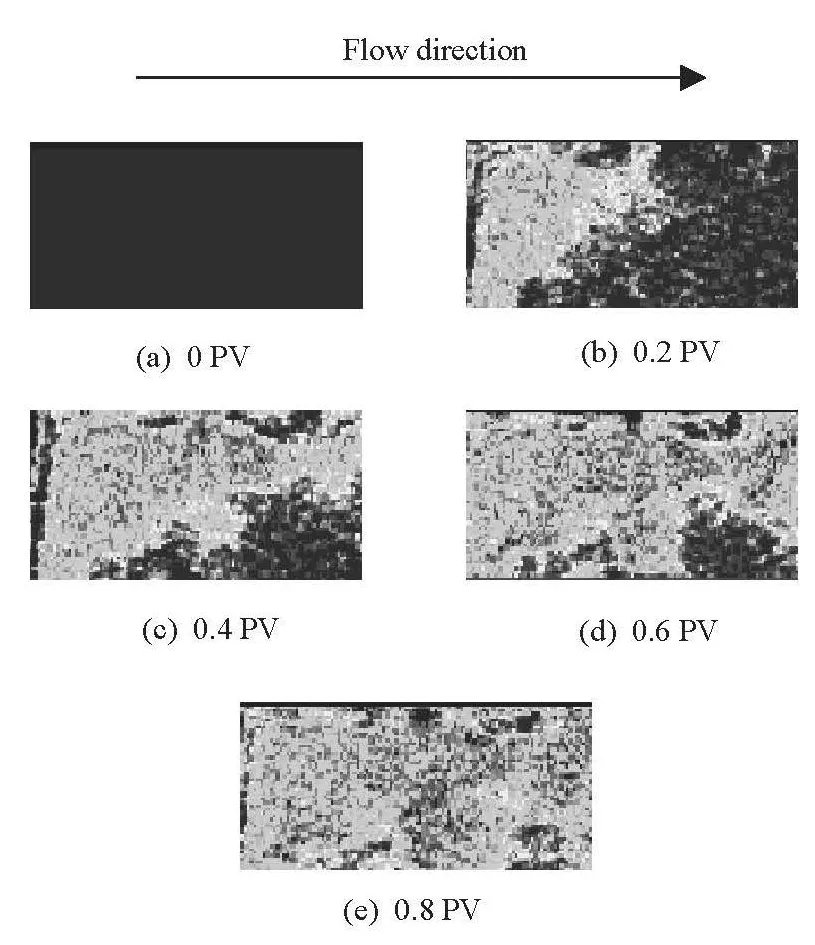
Fig.7 MRI images during forward displacement
In order to display the change in manganese chloride solution and diesel oil in the displacement process clearly and increase the visuality, the image got from the beginning of displacement was set as all red to indicate the zero manganese chloride solution involved. In Fig.7, five pictures of slice 2 are given, which represent the fluid distribution at the pore volume (PV)from 0 to 0.8 by a 0.2 step length respectively. With the increase of injected water, more oil was displaced by manganese chloride solution, and the blue pixel,which stands for existing manganese chloride solution in this area, in the picture was strengthened. While the red pixel, which stands for more diesel oil, was weakened. The injected water was fingering through the core and forming the clear boundary. From Fig.7 one can also see that the distribution of oil and manganese chloride solution are heterogeneous, which accords with the feature of the rock sample having uneven micro channel. Thus it can be seen that MRI images can be used to exhibit the internal flow features and fluid distribution in an opaque core sample.
Notable among these pictures in Fig.7, the diesel in the middle part of core has been displaced by injected manganese chloride solution while there are high levels of diesel oil still at the outlet and edge parts of rock sample. After displacement, the oil resided in the black area as shown in Fig.7.
Each pixel in Fig.7 is transformed by the MRI signals. The brightness of the pixels can be mapped to the quantity of the oil. Through comparing the saturation calculated by the measuring cylinder reading and MRI signals, the validity of MRI method can be verified.
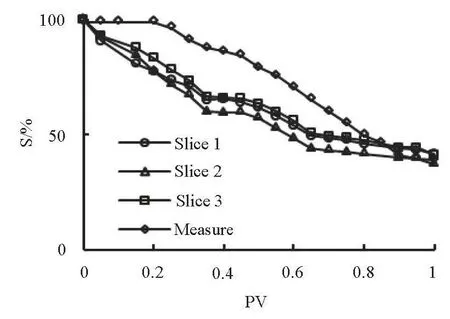
Fig.8 Oil saturation
Figure 8 is the comparison between measured value and MRI calculated value of oil saturation. The measured value has a little hysteresis (0.2 PVs) due to the vestigital fluid in the pipeline, which means there is 0.2PVs fluid in the outlet pipeline. The slice 2 is in the middle position of the core, the oil saturation from it decreases faster than the slice 1 and slice 3, which means the oil in middle area is displaced faster than in edge area. This phenomenon can be seen also from the residual oil distribution in Fig.7.
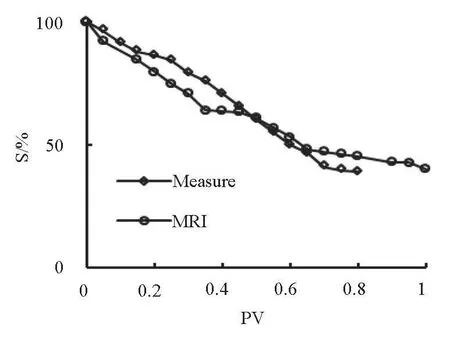
Fig.9 Comparison of oil saturation
Then we moved the measured data points forward by 0.2 PVs and compared with the mean oil saturation of three slices calculated by MRI method. The two curves are shown in Fig.9. During the displacement process, the curve of measured value decreases smoothly and the MRI calculated value changes more rapidly. This phenomenon is mainly due to the different data collect theories of two methods. Experimentaldata recorded by traditional metering method is the information after the fluid flows through the core while the MRI method measures the signals of fluid in the core.
The final absolute error of oil saturation at 0.8 PV is 6.1%. The error may come from the fluid in the gap space between the three slices and out of the FOV whose signals have not be collected.
To sum up, MRI method is more suitable to study the displacement mechanism.
3.2 Artificial core displacement two (test #2)
In Fig.7, besides the oil distribution information,there also presents an inclined black line near the left end of core sample in the last four pictures. This can be concluded as the end effect phenomenon. In fact,the end effect in core displacement tests has drawn more attention[18], but is firstly visually detected by our experiment with MRI. The flow condition saltation from tube flow to seepage and blocking are deemed to be two primary causes of the end effect. The first case always occurs at the two ends of the core,where flow channel has a rapid change in diameter between single inlet or outlet tube and porous media,and leads to the abnormity of pressure, permeability and flow velocity. For coping with this issue, a fluid diffuser plate was used by the researchers at the New Brunswick University to weaken the flow condition saltation[2]. In our laboratory, a spacer with groove was used to disperse the displacing fluid between inlet tube and core. As to the blocking, in our laboratory, a layer of nanoparticles on the inlet face was found after the displacement experiments with some kinds of hydrophobic nanoparticles injection-argument. After swashing the end surface, reverse displacement were used to solve this problem. But whether the influence can be totally removed is unknown.
As can often be seen in the displacement experiments, the core sample in our test was blocked at the inlet end by the rust in the tube, which was brought by the displace fluid. By swashing the impurities on the core surface as usual, reverse displacement of core can occur. Similarly with the test procedures in 4.1, an up to 20 PVs water was injected into the artificial core sample and a 0.5 ml/min speed was set to displace more fully.
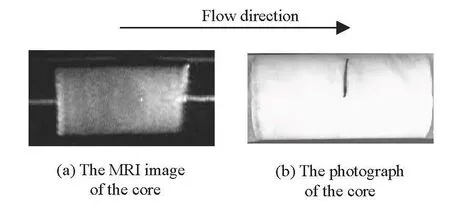
Fig.10 End effect picture of the core
Figure 10(a) shows the original MRI image of the core sample after forward displacement. There is a block of white pixel at the outlet of the core just like test #1, which is due to the sudden change of flow channel diameter. At the same time, a layer of white pixel is at the inlet of the core sample. Compared with the photograph of the core sample (in Fig.10(b)), there is a layer of dark color impurity close to the inlet end(about 0.002 m to the inlet), which is the precipitate impurity from the pipeline and could not been cleaned by mechanical method, because the impurity has soaked into the rock surface and leads to the abnormal signal. Therefore, this abnormal condition can not only be seen on the surface with eye, but also can be seen through MRI images.
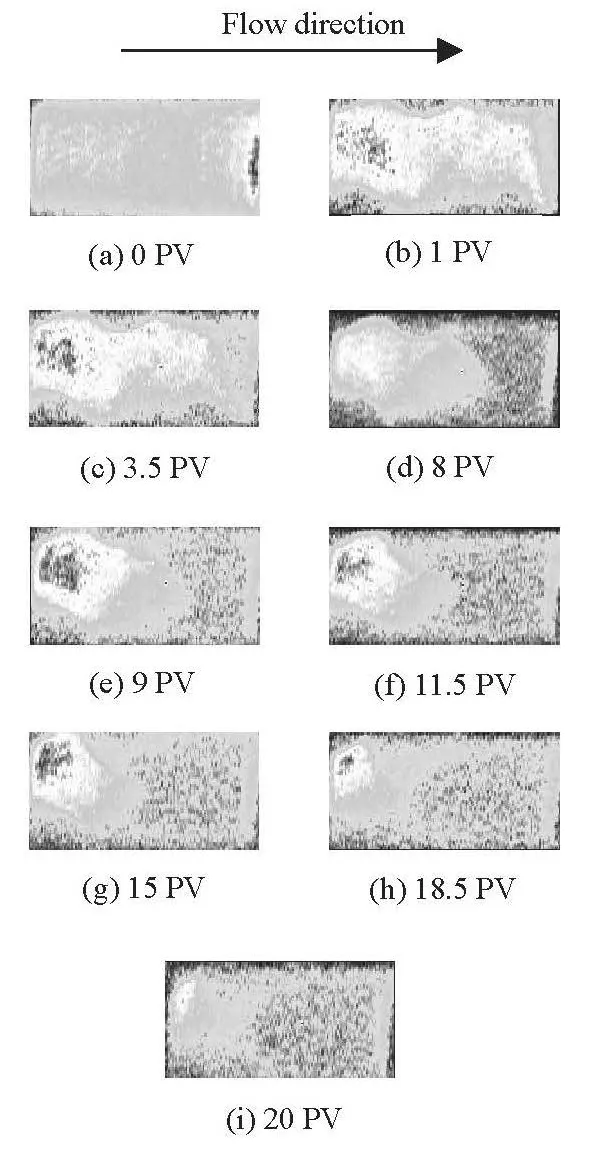
Fig.11 MRI images during reverse displacement
Figure 11 is the MRI images during the reverse displacement of core sample. At the instant of zero PV displacement with manganese chloride solution, the green pixel which represents ammonium chloride solution spread all over the whole rock sample except the red area near the right end, which corresponds to the impurity area in Fig.10(b). With the displacement carrying on, the blue pixel increases, and a displacement process can be clearly shown. It is worth noting that, the image of impurity exists in the whole displacement process, which indicates that the impurity may exist only in the near surface area and can not be washed out.
Through this experiment, we can infer that the porous structure of core can hold back the suspendedsolids in the displacing fluid like a filter. Firstly, the small solids will adsorb in layer in the microchannel wall and form a layer which will decrease the flow cannel diameter. Secondly, the particles will gather at the inlet end and form a blocking layer. The results show that cleaning the surface and reserve displacement can wipe off the precipitate on the surface, but can not remove the precipitate in the microchannel which may blocks the pore throat of core sample.
3.3 Natural core displacement (test #3)
As a preparation step, the core sample was vacuumized for 48 h and saturated with 0.5% manganese chloride solution firstly and then displaced by diesel till no water flowed out of the outlet of core. When 0.5% of manganese chloride solution was displaced into the micro channel of core at the speed of 0.5 ml/min, a flooding process of oil by water was simulated.
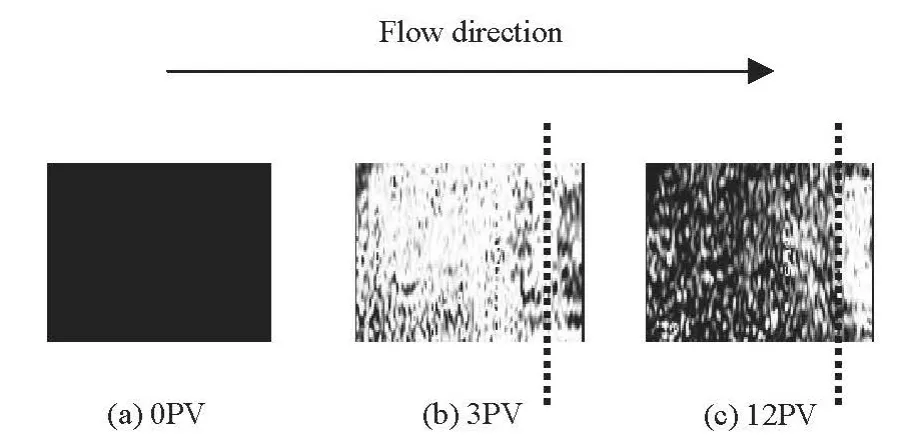
Fig.12 MRI images during forward displacement
In Fig.12, three pictures are given, which represent the fluid distribution at the PVs of 0, 3 and 12 respectively. With the increase of injected water, more oil was displaced by manganese chloride solution, and the blue pixel, which stands for existing manganese chloride solution in this area, in the picture is strengthened, while the red pixel, which stands for more diesel oil, is weakened. From Fig.12 one can also see that the distribution of oil and manganese chloride solution are heterogeneous, which accords with the feature of the rock sample having uneven micro channel. Thus it can be seen that MRI images can be used to exhibit the flow features and internal fluid distribution in an opaque core sample.
Notable among the pictures in Fig.12, the diesel in the middle and the entry part of core has been displaced by injected manganese chloride solution while there are high levels of diesel oil still at the end parts of rock sample. Excluding the possibility of insufficient displacement (the displacement manganese chloride solution has been up to 12 PV), an obvious phenomenon of end effect can be ensured, which is due to the sudden change of flow channel diameter. From Fig.12,about a 0.004 m influence range from core outlet end can be determined (marking with black dotted line).Meanwhile, MRI is a visual tool to observe the fluid distribution in the core and local condition of the fluid in the core can be known by analyzing the MRI images.
4. Conclusions
Through the above-mentioned work, the following conclusions could be reached.
(1) The oil and water distribution in the rock sample during a displacement test can be exhibited clearly and visually with MRI method. The change of fluid distribution can be locally and globally observed by means of analyzing MRI image during the displacement.
(2) Through comparing the measured value and MRI calculated value of oil saturation, the results show that data given by traditional methods form a little hysteresis. The value of hysteresis is based on the fluid volume in the pipeline.
(3) The end effect really exists in the core displacement test and has been firstly visually detected in our experiments. Through comparing the MRI images and the picture of the core, the position of the blocking can be exactly located. The results show the influence area of end effect is limited, which is 0.004 m to the end of a 0.005752 m length natural core.
[1] GONG Wei, DI Qin-feng and WANG Xin-liang et al.Seepage model and experiments of drag reduction by nanoparticle adsorption[J]. Journal of Hydrodynamics,2013, 25(6): 871-876.
[2] ROMERO-ZERÓN L., ONGSURAKUL S. and Li L.et al. Visualization of the effect of porous media wettability on polymer flooding performance through unconsolidated porous media using magnetic resonance imaging[J]. Petroleum Science and Technology, 2010,28(1): 52-67.
[3] AN M., APOSTOLOS K. An evaluation of the application of low field nmr in the characterization of carbonate reservoirs[C]. SPE Annual Technical Conference and Exhibition. San Antonio, USA, 2002.
[4] BRYAN J., KANTZAS A. and BELLEHUMEUR C.Oil-viscosity predictions from low-field nmr measurements[J]. SPE Reservoir Evaluation and Engineering,2005, 8(1): 44-52.
[5] SIOW B., DROBNJAK I. and CHATTERJEE A. et al.Estimation of pore size in a microstructure phantom using the optimised gradient waveform diffusion weighted NMR sequence[J]. Journal of Magnetic Resonance, 2012, 214(1): 51-60.
[6] YI Min, HUANG Rui-yao and SUN Liang-tian et al. A new method of measurementing reservoir core porosity and porosity distribution[J]. Journal of Southweat Petroleum Institute, 2004, 26(1): 43-46, 44(in Chinese).
[7] LIANG Ya-ning, ZHANG Shi-cheng and YE Yin-zhu et al. Application of computed tomography scanning technology in low-permeability sandstone core test[J]. Oil Drilling and Production Technology, 2011, 33(2): 98-101(in Chinese).
[8] ARNS C. H. A comparison of pore size distributions derived by NMR and X-ray-CT techniques[J]. Physica A:Statistical Mechanics and its Applications, 2004,339(1-2): 159-165.
[9] XIONG Xin, HA Da. Research of nuclear magnetic resonance logging permeability model[J]. Scientific and Technological Information, 2010, 22(2): 390-391(in Chinese).
[10] QU Yan-tao, JIANG Zhi-min and SHI Jing-shen et al.Water flooding studied by measuring NMR two-dimensional distribution function[J]. Chinese Journal of Magnatic Resonance, 2012, 29(1): 51-59(in Chinese).
[11] WANG Wei-ming.The physical study of nuclear mag netic resonance in rock and its application on petroleum industry[D]. Doctoral Thesis, Wuhan, China:Wuhan Institute of Physics and Mathematics, 2001(in Chinese).
[12] LANG Dong-jiang, LV Chen-yuan and LUN Zen-min et al. Study of method in core analysis by NMRI[J].Computerized Tomography Theory and Applications, 2012, 21(1): 27-35(in Chinese).
[13] LIU Yu, SONG Yong-chen and ZHAO Jia-fei. Cross sectional visualization and porosity measurement of porous media by using MRI Technique[J]. Journal of Test and Measurement Technology, 2011, 25(3): 195-199(in Chinese).
[14] LEVITT M. H. SPIN dynamics: Basics of nuclear magnetic resonance[M]. New York, USA: John Wiley and Sons, 2008.
[15] HÜRLIMANN M. D. Well logging encyclopedia of magnetic resonance[M]. Hoboken, USA: Wiley Online Library, 2012.
[16] MA Jin, XU Rui-na and LUO Shu et al. Core-scale experimental study on supercritical-pressure CO2migration mechanism during CO2geological storage in deep saline aquifer[J]. Journal of Engineering Thermophysics, 2012, 33(11): 1971-1975(in Chinese).
[17] ZHANG Ying-li. Magnetic resonance imaging system user manual, Version 1.01[R]. Shanghai, China:Shanghai Niumag corporation, 2011(in Chinese).
[18] PERRIN J. C., BENSON S. An experimental study on the influence of sub-core scale heterogeneities on CO2distribution in reservoir rocks[J]. Transport in Porous Media, 2010, 82(1): 93-109.

- 水动力学研究与进展 B辑的其它文章
- A general framework for verification and validation of large eddy simulations*
- Direct calculation method of roll damping based on three-dimensional CFD approach*
- Large-eddy simulation of the flow past both finite and infinite circular cylinders at Re =3900*
- Safe operation of inverted siphon during ice period*
- Flow field simulation of supercritical carbon dioxide jet: Comparison and sensitivity analysis*
- Ship hull optimization based on wave resistance using wavelet method*